. 2024 Apr 20;22(1):234.
doi: 10.1186/s12964-024-01621-x.

High glucose-induced p66Shc mitochondrial translocation regulates autophagy initiation and autophagosome formation in syncytiotrophoblast and extravillous trophoblast

Affiliations

High glucose-induced p66Shc mitochondrial translocation regulates autophagy initiation and autophagosome formation in syncytiotrophoblast and extravillous trophoblast

Lulu Ji et al. Cell Commun Signal. .

Abstract

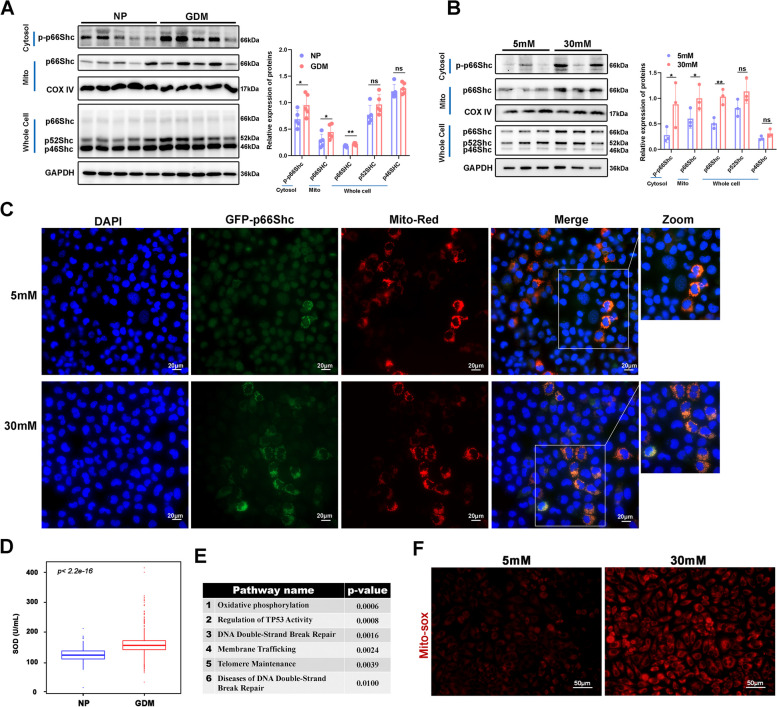
Background: p66Shc, as a redox enzyme, regulates reactive oxygen species (ROS) production in mitochondria and autophagy. However, the mechanisms by which p66Shc affects autophagosome formation are not fully understood.

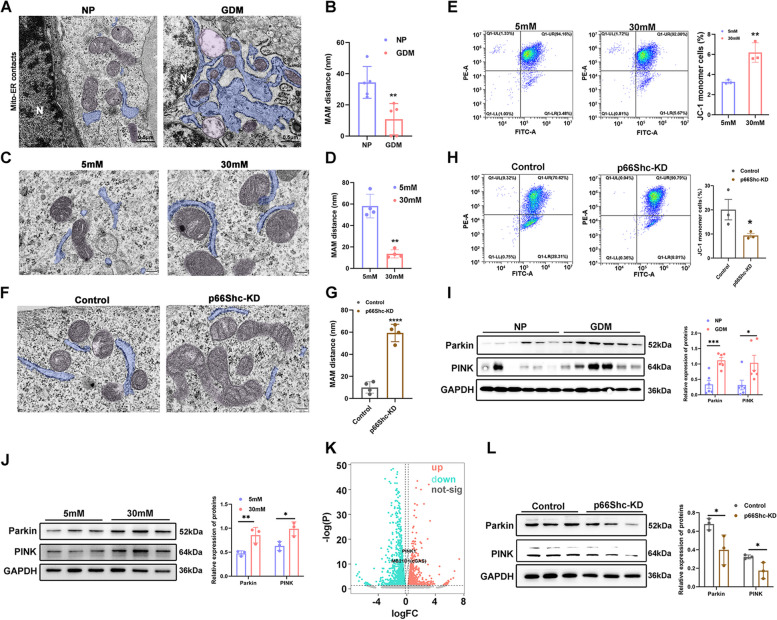
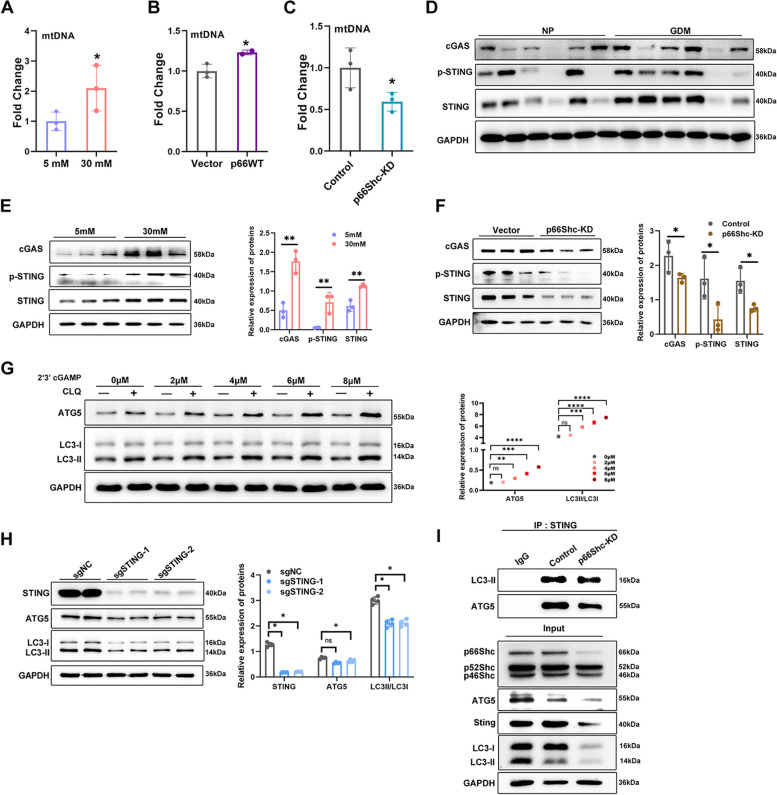
Methods: p66Shc expression and its location in the trophoblast cells were detected in vivo and in vitro. Small hairpin RNAs or CRISPR/Cas9, RNA sequencing, and confocal laser scanning microscope were used to clarify p66Shc's role in regulating autophagic flux and STING activation. In addition, p66Shc affects mitochondrial-associated endoplasmic reticulum membranes (MAMs) formation were observed by transmission electron microscopy (TEM). Mitochondrial function was evaluated by detected cytoplastic mitochondrial DNA (mtDNA) and mitochondrial membrane potential (MMP).

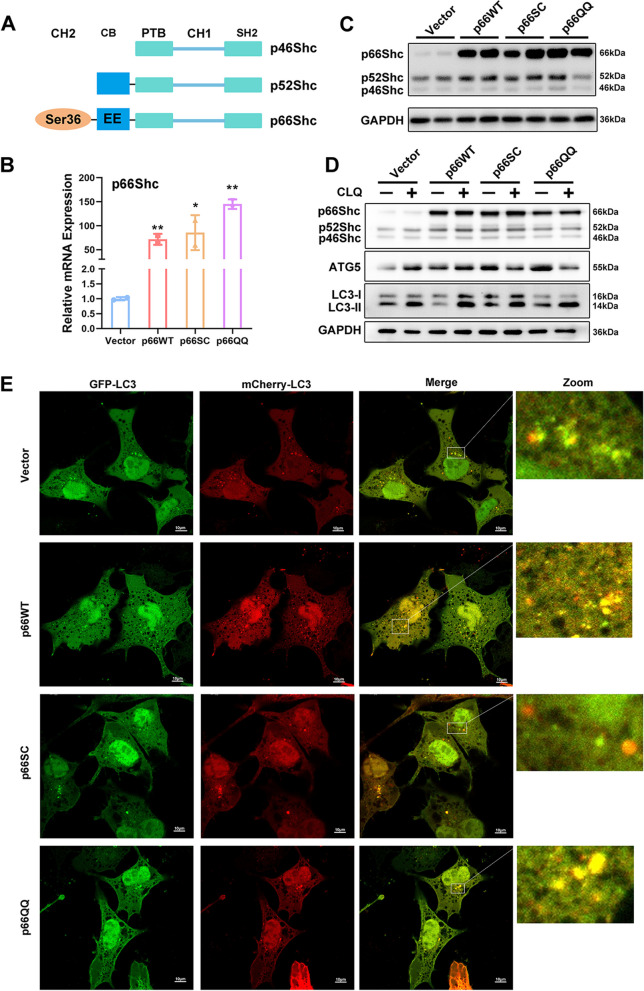
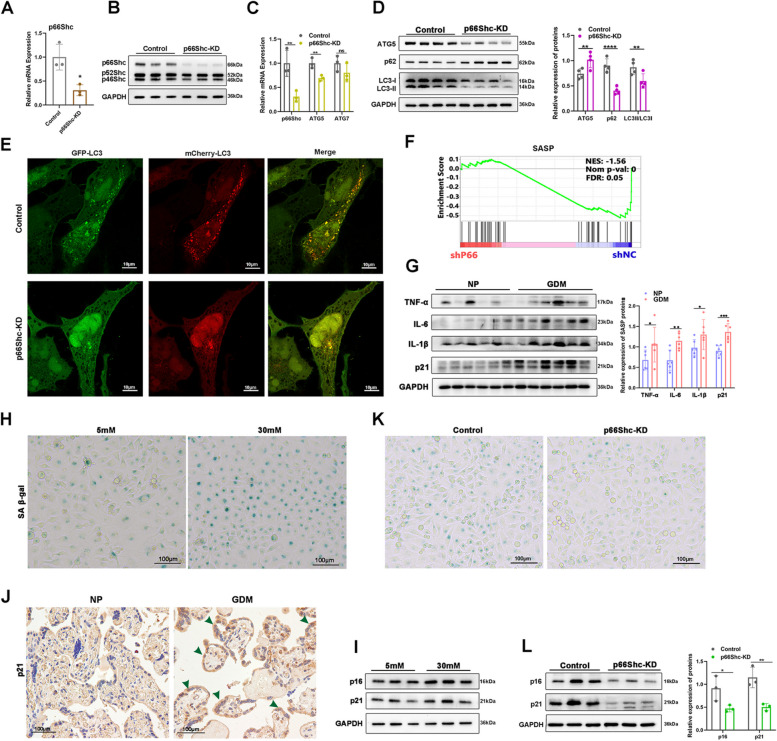
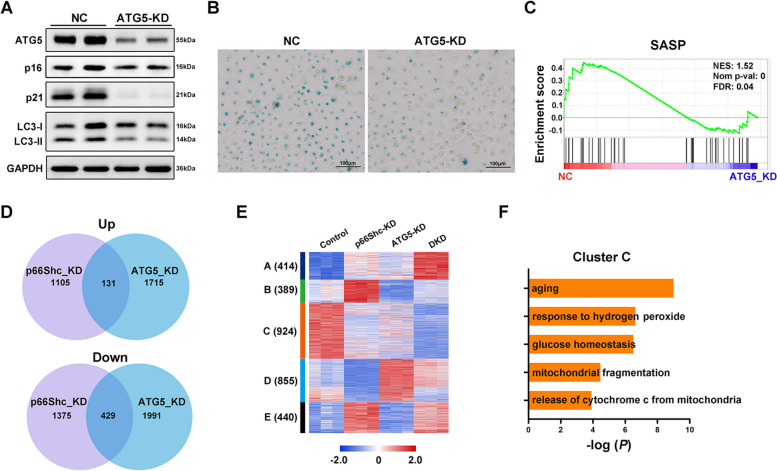
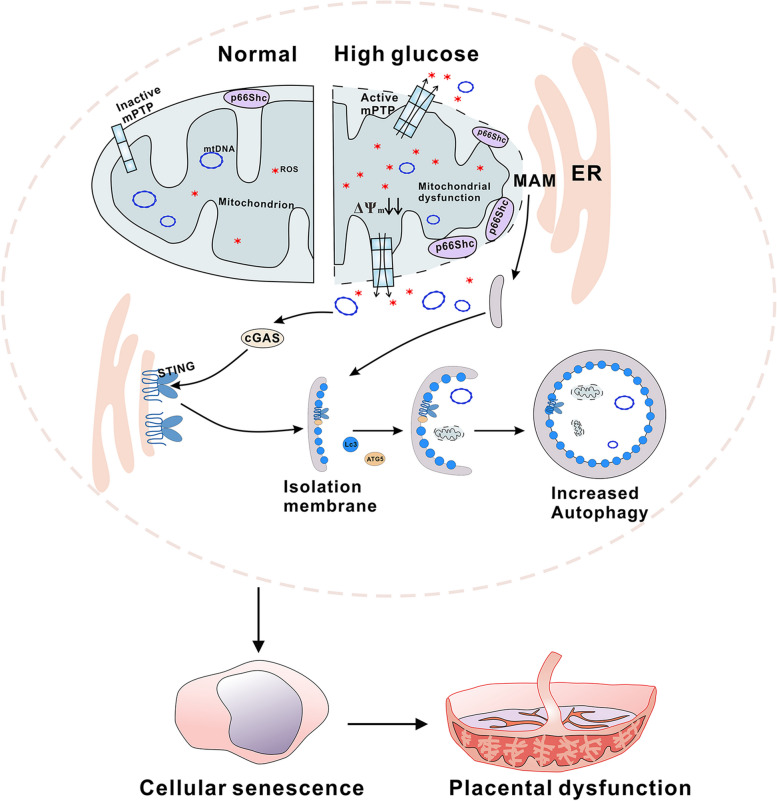
Results: High glucose induces the expression and mitochondrial translocation of p66Shc, which promotes MAMs formation and stimulates PINK1-PRKN-mediated mitophagy. Moreover, mitochondrial localized p66Shc reduces MMP and triggers cytosolic mtDNA release, thus activates cGAS/STING signaling and ultimately leads to enhanced autophagy and cellular senescence. Specially, we found p66Shc is required for the interaction between STING and LC3II, as well as between STING and ATG5, thereby regulates cGAS/STING-mediated autophagy. We also identified hundreds of genes associated several biological processes including aging are co-regulated by p66Shc and ATG5, deletion either of which results in diminished cellular senescence.

Conclusion: p66Shc is not only implicated in the initiation of autophagy by promoting MAMs formation, but also helps stabilizing active autophagic flux by activating cGAS/STING pathway in trophoblast.

Keywords: Autophagy; High glucose; MAM; cGAS/STING; p66Shc.


Conflict of interest statement

The authors declare no competing interests.

Figures

Fig. 1
Fig. 1
High glucose increased expression of p66Shc and its translocation to mitochondrion. A Western blot images and quantifications of protein expressions of p-p66Shc in cytosol, p66Shc in mitochondria and whole cell lysate in NP and GDM placentae. *P < 0.05, **P < 0.01. B Western blot images and quantifications of protein expressions of p-p66Shc in cytosol, p66Shc in mitochondria and whole cell lysate in 5 mM or 30 mM glucose treated HTR8/SVneo cells. *P < 0.05, **P < 0.01. C Fluorescence microscope images of co-localization of p66Shc (green) with mitochondria (red) in 5 mM or 30 mM glucose treated HTR8/SVneo cells. Scale bar, 20 μm. D Box plot shows the levels of maternal serum Mn-SOD between NP (n = 281) and GDM patients (n = 1037). E Gene ontology analysis of differentially expressed genes between NP and GDM placentae. F MitoSOX staining showing levels of mitochondrial superoxide in 5 mM or 30 mM glucose treated HTR8/SVneo cells. Scale bar, 50 μm
Fig. 2
Fig. 2
p66Shc promotes autophagy in trophoblast cells. A Schematic structure representations of three isoforms for p46Shc, p52Shc and p66Shc, and the locations of phosphorylatable serine at position 36 in the CH2 domain and two glutamic acid residues at positions 132 and 133 in the CB domain. B-C qRT-PCR analysis of p66Shc mRNA expression B and Western blot images of p66Shc protein expression C in p66WT, p66SC and p66QQ cells. *P < 0.05, **P < 0.01. D Western blot images of protein levels of p66Shc, ATG5 and LC3 in p66WT, p66SC and p66QQ overexpressed HTR8/SVneo cells treated with Chloroquine. E Representative confocal images of autophagic flux were obtained from HTR8/SVneo cells overexpressing p66WT, p66SC, and p66QQ and transfected with mCherry-EGFP-LC3 to label the autophagosomes (yellow) and autolysosomes (cherry). Scale bar, 10 μm
Fig. 3
Fig. 3
p66Shc knock-down rescues high glucose induced autophagy and senescence of trophoblast cells. A-B qRT-PCR analysis of p66Shc mRNA expression A and Western blot images of p66Shc protein expression (B) in control and p66Shc-KD cells. C qRT-PCR analysis of p66Shc, ATG5 and ATG7 mRNA expressions in control and p66Shc-KD cells. D Western blot images and quantifications of protein levels of ATG5, p62 and LC3 in control and p66Shc-KD cells. E Representative confocal images of autophagic flux in control and p66Shc-KD cells transfected with mCherry-EGFP-LC3 to label the autophagosomes (yellow) and autolysosomes (cherry). Scale bar, 10 μm. F Gene set enrichment analysis of SASP gene signature in control and p66Shc-KD cells. G Western blot images and quantifications of SASP protein expressions of TNF-α, IL-6, IL-1β and p21 in placentae of NP and GDM patients. *P < 0.05, **P < 0.01, ***P < 0.001. H SA-β-gal staining images showing cell senescence in 5 mM or 30 mM glucose treated HTR8/SVneo cells. Scale bar, 100 μm. I Western blot images of p16 and p21 protein levels in 5 mM or 30 mM glucose treated HTR8/SVneo cells. J IHC staining images of p21 in NP and GDM placentae. Green arrowheads indicate upregulation of p21 both in the cytoplasm and nucleus, with a predominant expression in the cytoplasm of syncytiotrophoblast cells in GDM placentae. Scale bar, 100 μm. K SA-β-gal staining showing cell senescence of control and p66Shc-KD cells. L Western blot images and quantifications of protein levels of p16 and p21 in control and p66Shc-KD cells. *P < 0.05, **P < 0.01, ****P < 0.0001
Fig. 4.
Fig. 4.
p66Shc and ATG5 co-regulate senescence of trophoblast cells. A Western blot images of protein levels of ATG5, p16, p21 and LC3 in control and ATG5-KD cells. B SA-β-gal staining showing cell senescence of control and ATG5-KD cells. C Gene set enrichment analysis of SASP gene signature in control and ATG5-KD cells. D Venn diagram illustrates the number of differentially expressed genes overlapped between p66Shc-KD and ATG5-KD cells. E K-means clustering heatmap shows expressions patterns of differentially expressed genes upon p66Shc-KD. F Gene ontology enrichment analysis of genes in cluster C
Fig. 5.
Fig. 5.
p66Shc regulates formation of MAM and mitophagy. A-B Representative TEM images A and quantifications B of mitochondrial ultrastructural changes in NP and GDM placentae, mitochondria (in purple) in close contact with ER (in blue) in which distance ≤ 25 nm were considered as MAM sites. Scale bar, 0.5 μm; N, nucleus. **P < 0.01. C-D Representative TEM images C and quantifications D of mitochondria (in purple) in close contact with ER (in blue) in which distances ≤ 25 nm was considered as contacts in 5 mM and 30 mM glucose treated HTR8/SVneo cells. Scale bar, 200 nm. **P < 0.01. E JC-1-based flow cytometry assay images and quantifications of fluorescence intensity distribution of 5 mM or 30 mM glucose treated HTR8/SVneo cells. **P < 0.01. F-G Representative TEM images F and quantifications G of Mito-ER contacts distance in control and p66Shc-KD cells. Scale bar, 200 nm. ****P < 0.0001. H JC-1-based flow cytometry assay images and quantifications of fluorescence intensity distribution of control or p66Shc-KD cells. *P < 0.05. I-J Western blot images and quantifications of protein levels of Parkin and PINK in (I) NP and GDM placentae and J 5 mM and 30 mM glucose treated HTR8/SVneo cells. *P < 0.05; **P < 0.01; ****P < 0.0001. K Volcano plot showing the mRNA expression changes upon p66Shc knockdown. L Western blot images and quantifications of protein levels of Parkin and PINK in control and p66Shc-KD cells. *P < 0.05
Fig. 6
Fig. 6
p66Shc mediated autophagy through cGAS/STING pathway A-C qRT-PCR analysis of relative cytosolic mtDNA levels in A 5 mM or 30 mM glucose treated HTR8/SVneo cells, B Control and p66WT overexpressed HTR8/SVneo cells, C Control and p66Shc-KD cells. *P < 0.05. D Western blot images of protein levels of cGAS, p-STING and STING in normal and GDM placentae. E Western blot images and quantifications of protein levels of cGAS, p-STING and STING in 5 mM or 30 mM glucose treated HTR8/SVneo cells. **P < 0.01. F Western blot images and quantifications of protein levels of cGAS, p-STING and STING in control and p66Shc-KD cells. *P < 0.05. G Western blot images and quantifications of protein levels of p-STING, STING and LC3II in HTR8/SVneo cells treated with 2’3’-cGAMP and Chloroquine. **P < 0.01, ***P < 0.001, ****P < 0.0001. H Western blot images and quantifications of protein levels of STING, LC3 and ATG5 in control and STING-KO HTR8/SVneo cells. *P < 0.05. I Co-immunoprecipitation coupled western blot images demonstrate the interactions between STING and LC3 or ATG5 in both control and p66Shc-KD cells
Fig. 7
Fig. 7
A model of p66Shc orchestrates autophagy via cGAS-STING signaling in trophoblast cells of GDM.Step 1, High glucose induces an upregulation of p66Shc expression and its translocation to the mitochondria, resulting in the accumulation of ROS and a reduction in MMP. This leads to activation of the mPTP, which subsequently causes the release of ROS and mtDNA into the cytoplasm. Step 2, p66Shc translocases into mitochondrial intermembrane space promotes the formation of MAMs, which serves as a membrane source for LC3 recruitment and lipidation through an ATG5 dependent mechanism. Step 3, The cytoplasmic mtDNA triggers and activation of STING, leading to the subsequent translocation of STING from the endoplasmic reticulum to the isolation membrane. LC3-positive membranes target DNA and dysfunctional mitochondrion to autophagosomes, which results in increased autophagy in trophoblast cells. Besides, this dysregulation ultimately impairs trophoblast cell function and potentially compromises placental integrity in patients with GDM

Similar articles

Cited by

References

    1. Lorenzo-Almoros A, Hang T, Peiro C, Soriano-Guillen L, Egido J, Tunon J, Lorenzo O. Predictive and diagnostic biomarkers for gestational diabetes and its associated metabolic and cardiovascular diseases. Cardiovasc Diabetol. 2019;18:140. doi: 10.1186/s12933-019-0935-9. - DOI - PMC - PubMed
    1. Nakashima A, Yamanaka-Tatematsu M, Fujita N, Koizumi K, Shima T, Yoshida T, Nikaido T, Okamoto A, Yoshimori T, Saito S. Impaired autophagy by soluble endoglin, under physiological hypoxia in early pregnant period, is involved in poor placentation in preeclampsia. Autophagy. 2013;9:303–316. doi: 10.4161/auto.22927. - DOI - PMC - PubMed
    1. Ji L, Chen Z, Xu Y, Xiong G, Liu R, Wu C, Hu H, Wang L. Systematic Characterization of Autophagy in Gestational Diabetes Mellitus. Endocrinology. 2017;158:2522–2532. doi: 10.1210/en.2016-1922. - DOI - PubMed
    1. Ciciliot S, Fadini GP. Modulation of Obesity and Insulin Resistance by the Redox Enzyme and Adaptor Protein p66(Shc) Int J Mol Sci. 2019;20:985. doi: 10.3390/ijms20040985. - DOI - PMC - PubMed
    1. Onnis A, Cianfanelli V, Cassioli C, Samardzic D, Pelicci PG, Cecconi F, Baldari CT. The pro-oxidant adaptor p66SHC promotes B cell mitophagy by disrupting mitochondrial integrity and recruiting LC3-II. Autophagy. 2018;14:2117–2138. doi: 10.1080/15548627.2018.1505153. - DOI - PMC - PubMed

Publication types

MeSH terms

Substances