. 2024 Apr 20;15(1):3374.
doi: 10.1038/s41467-024-47757-9.

Deviations in RSV epidemiological patterns and population structures in the United States following the COVID-19 pandemic

Affiliations

Deviations in RSV epidemiological patterns and population structures in the United States following the COVID-19 pandemic

Estefany Rios-Guzman et al. Nat Commun. .

Abstract

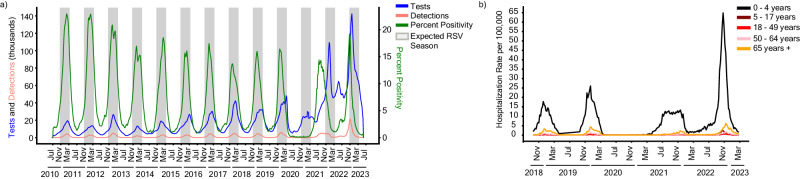
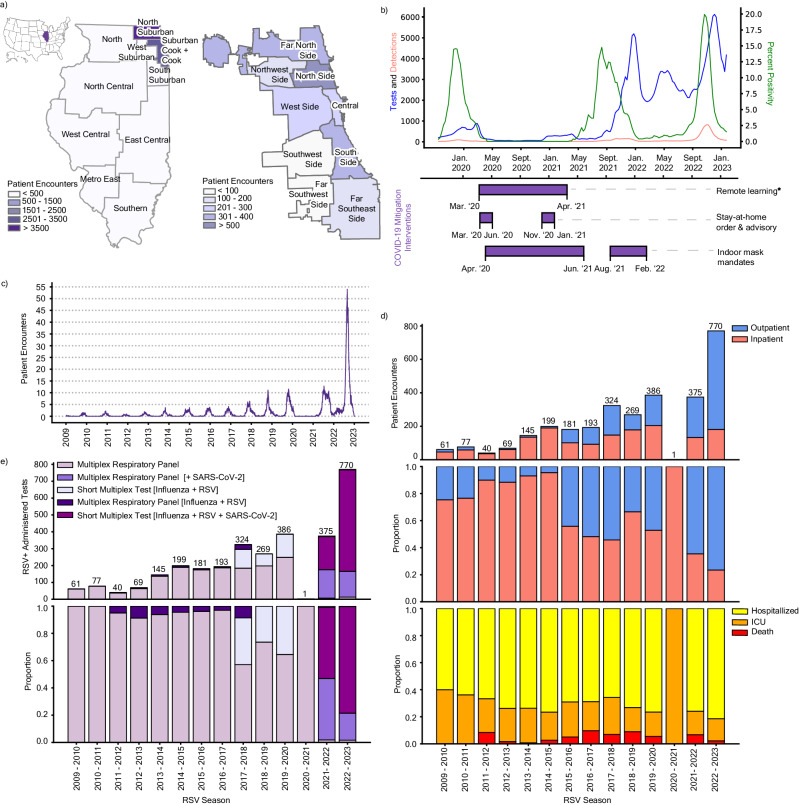
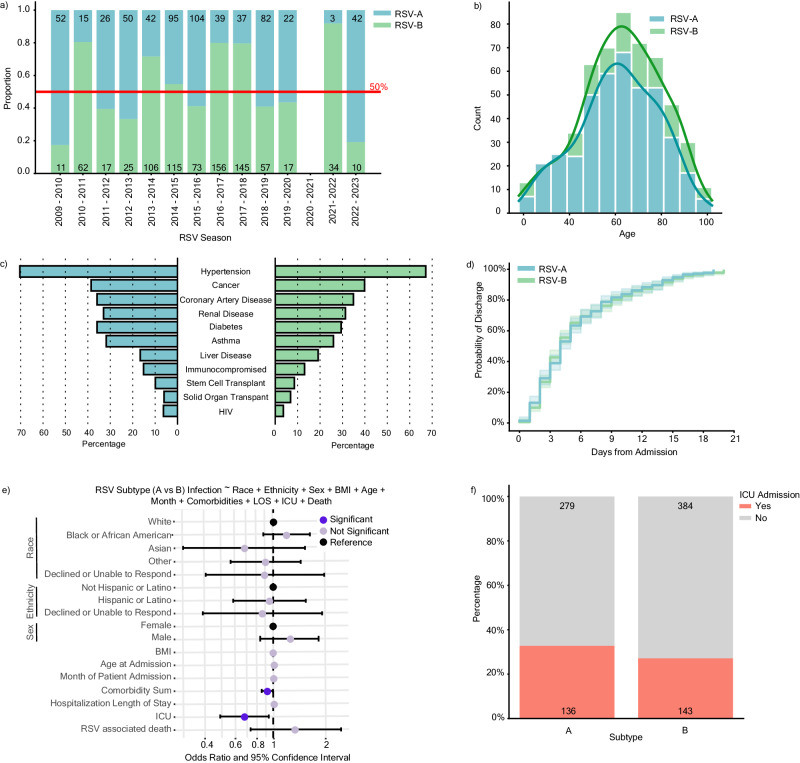
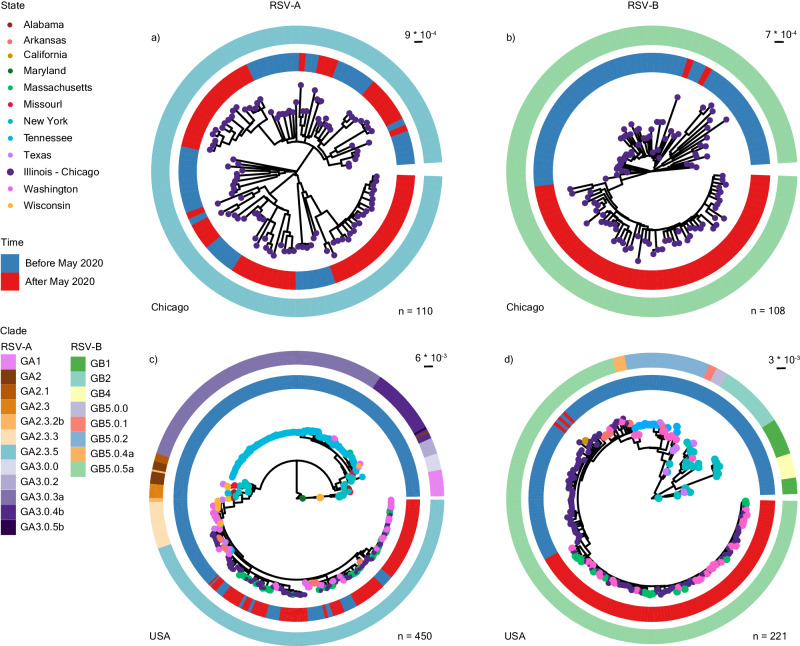
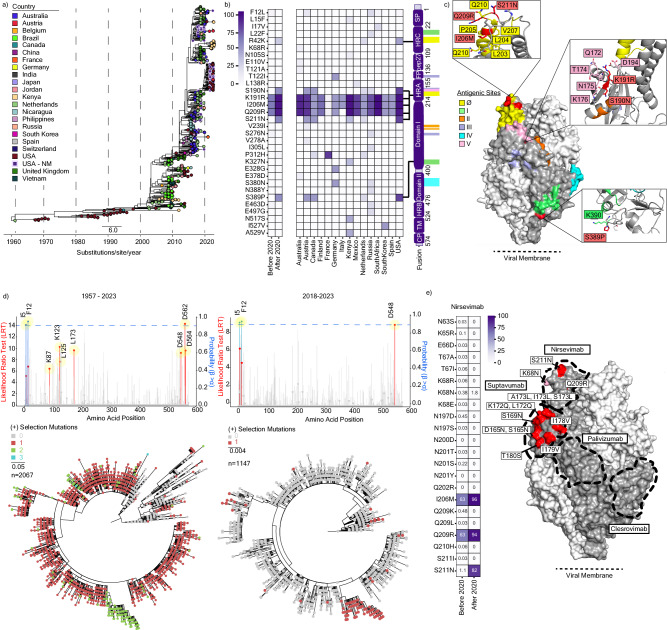
Respiratory Syncytial Virus (RSV) is a leading cause of acute respiratory tract infection, with the greatest impact on infants, immunocompromised individuals, and older adults. RSV prevalence decreased substantially in the United States (US) following the implementation of COVID-19-related non-pharmaceutical interventions but later rebounded with abnormal seasonality. The biological and epidemiological factors underlying this altered behavior remain poorly defined. In this retrospective cohort study from 2009 to 2023 in Chicago, Illinois, US, we examined RSV epidemiology, clinical severity, and genetic diversity. We found that changes in RSV diagnostic platforms drove increased detections in outpatient settings post-2020 and that hospitalized adults infected with RSV-A were at higher risk of intensive care admission than those with RSV-B. While population structures of RSV-A remained unchanged, RSV-B exhibited a genetic shift into geographically distinct clusters. Mutations in the antigenic regions of the fusion protein suggest convergent evolution with potential implications for vaccine and therapeutic development.


Conflict of interest statement

M.G.I. declares that research support from GSK was paid to his previous institution, Northwestern University; he received consulting fees from Adagio Therapeutics, ADMA Biologics, Adamis Pharmaceuticals, AlloVir, Atea, Cidara Therapeutics, Genentech/Roche, Janssen, Shionogi, Takeda, Talaris, and Eurofins Viracor; and payment for participating in data safety monitoring boards or advisory boards from Adamis Pharmaceuticals, AlloVir, National Institutes of Health, CSL Behring, Janssen, Merck, Seqirus, Takeda, and Talaris; all of these ended in December 2022; M.G.I. also receives author royalties from UpToDate, which is ongoing. J.F.H. received research support, paid to Northwestern University, from Gilead Sciences and is a paid consultant for Merck. E.R.G has previously been a paid consultant for Merck. All other authors declare no conflicts of interest.

Figures

Fig. 1
Fig. 1. Epidemiology of RSV in the United States from 2010 to 2023.
a Epidemiology of RSV as represented by a 3-week rolling average of tests (blue), detections (pink), and percent positivity (green) between July 10th, 2010, and June 3rd, 2023 per data provided to the National Respiratory and Enteric Virus Surveillance System (NREVSS). Expected RSV seasonality (gray bars) is defined as early November to late March. b Weekly Hospitalization rate per 100,000 individuals between October 13th, 2018 and March 11th, 2023 stratified by age groups: (i) 0–4 years (black), (ii) 5–17 years (maroon), (iii) 18–49 years (red) (iv) 50–64 years (pink), and (v) 65 years and older (orange) per data provided to the RSV-Associated Hospitalization Surveillance Network (RSV-NET).
Fig. 2
Fig. 2. RSV patient encounters reflect changes in testing platforms.
a RSV patient encounters between January 4th, 2009 and February 20th, 2023 sorted by zip code across the 11 Emergency Medical Service (EMS) regions in Illinois (left; as defined by the Illinois Department of Public Health) and the 9 community regions in the city of Chicago (right; as defined by regional census data). The location of Illinois in the US is annotated in purple (top left). b 3-week rolling average of RSV tests administered (blue), detections (pink), and percent positivity (green) data from the Chicago Department of Public Health (CDPH) from September 29th, 2019 to January 22nd, 2023. The timeline of COVID-19 mitigation measures implemented in Chicago is represented in purple bars below. The end of remote learning for Chicago Public Schools (CPS) was staged with K-8th grade return to in-person classes on March 1st, 2021, and 8th–12th grade return on April 19th, 2021. c Weekly rolling average of adult patient encounters in NM-affiliated institutions from January 4th, 2009 to February 20th, 2023. d Absolute counts (top) and proportion (middle) of NM-affiliated adult RSV patient encounters grouped by outpatients (blue) and inpatients (pink). Inpatients are further stratified by the proportion of those hospitalized without ICU admission (yellow), hospitalized with ICU admission (orange), and death (red) per RSV season (bottom). e Absolute counts (top) and proportion (bottom) of NM-affiliated adult patient encounters with a positive RSV test grouped by the diagnostic platform in each season (February to January).
Fig. 3
Fig. 3. RSV-A is associated with higher risk of ICU admission.
a Distribution of RSV subtype by season from April 2, 2009 to March 1, 2023 among 1437 outpatient (n = 495) and inpatient (n = 942) adults with typing information as reported by diagnostic platforms or through in-house PCR-based typing [RSV-A in blue (n = 609), RSV-B in green (n = 828)]. b Histogram of the age distribution of adult inpatients stratified by subtype (n = 415 RSV-A and n = 527 RSV-B). c Percent of adult inpatients with the indicated comorbid condition stratified by subtype. d Kaplan–Meier plot depicting the probability of discharge within 20 days of an RSV-associated hospitalization stratified by subtype (n = 377 RSV-A and n = 489 RSV-B). Inpatients with hospital stays longer than 20 days are not shown (n = 76). There is no statistical difference between subtypes by log-rank test (p = 0.620). e Odds ratio plot with 95% confidence intervals (CI) as calculated by a multivariable logistic regression model with RSV-A (reference) or RSV-B infection as the outcome variable for hospitalized adults (n = 942). Significant features (p < 0.05) are highlighted in dark purple (comorbidity sum; 0.025, ICU admission; 0.018), insignificant features (p >= 0.05) are shown in light purple, and reference categories for categorical variables are shown in black (refer to p values in Supplementary Fig. 4A). f Percentage and absolute count of inpatient cohort experiencing ICU admission (yes, orange, n = 279) and either outpatient or hospitalization admission (no, gray, n = 643).
Fig. 4
Fig. 4. Phylogenetic analysis of RSV-A and -B whole genome sequences.
a Maximum likelihood (ML) phylogenetic analysis of RSV-A whole genome sequences from NM-affiliated institutions in Chicago, Illinois from 2018 to 2022 (n = 110). b Equivalent ML phylogenetic analyses of RSV-B whole genome sequences from NM-affiliated institutions in Chicago, Illinois from 2017 to 2022 (n = 108). c ML phylogenetic analysis of RSV-A whole genome sequences from NM-affiliated institutions in Chicago, Illinois with publicly available genomes from the United States (US) collected from 1956 to 2022 (as of March 1st, 2023) (n = 450). d ML phylogenetic analysis of RSV-B whole genome sequences from NM-affiliated institutions in Chicago, Illinois with publicly available genomes from the US collected from 1979 to 2022, n = 221. For all trees, branch tips are colored by state of origin, the inner ring is colored by time (blue = before May 2020, red = after May 2020), and the outer ring is colored by clade as designated by Nextclade v2.14.1 (refer to Supplementary Table 1).
Fig. 5
Fig. 5. Globally circulating RSV-B mutations in fusion protein.
a Maximum likelihood (ML) phylogenetic temporal analysis of globally circulating RSV-B whole genome sequences collected from 1957 to 2023 (as of October 10, 2023) (n = 723). Branch tips are colored by country of origin, and scale units are substitutions/site/year. b Heatmap of RSV-B Fusion mutational frequency among sequences sampled before and after May 1, 2020 relative to the GB5.0.5a most recent common ancestor (MRCA, left). Isolates sampled after May 1, 2020, are further stratified by country (n = 15, middle). A schematic of F domains with antigenic site positions highlighted is shown on the right. c Structure homology modeling of RSV-B prefusion F from the NMH/US cluster using template PDB:6QOS via SWISS-MODEL. Antigenic sites (yellow = Ø, green = I, orange = II, purple = III, cyan = IV, pink = V) and mutations defining the NMH/US cluster (red) are annotated on the trimer structure. Side chain residues within 5 angstroms of the three US cluster-defining mutations (S190N, S211N, S389P) are labeled in the insets. d Overlayed lollipop and bar plots for episodic and pervasive positive selection analysis, respectively, of unique RSV-B F open reading frames (ORFs) from 1957 to 2023 (n = 2067, right) and from 2018 to 2023 (n = 1147, left). Lollipop plots depict the likelihood ratio test (LRT) for episodic positive selection by a mixed effects model of evolution (MEME); significant positions are highlighted in red (p < 0.05). Overlaid bar charts depict the posterior probability of pervasive positive selection by Fast Unconstrained Bayesian AppRoximation (FUBAR); significant positions at greater than 90% are highlighted in blue. Corresponding ML phylogenetic trees (bottom) display the number of positions undergoing positive selection in a given branch. e Heatmap displaying mutational frequencies at positions within the Nirsevimab binding site before and after May 1, 2020 (left). Mutational frequency by position after May 1, 2020, is overlaid on the RSV-B prefusion F homology model (right). Proposed monoclonal antibody binding sites for Nirsevimab, Suptavumab, Clesrovimab, and Palivizumab are outlined.

Update of

References

    1. Sherman AC, et al. The effect of Severe Acute Respiratory Syndrome Coronavirus 2 (SARS-CoV-2) mitigation strategies on seasonal respiratory viruses: a tale of 2 Large Metropolitan Centers in the United States. Clin. Infect. Dis. 2021;72:e154–e157. - PMC - PubMed
    1. Olsen SonjaJ, et al. Changes in influenza and other respiratory virus activity during the COVID-19 pandemic - United States, 2020–2021. Mmwr. Morbidity Mortal. Wkly. Rep. 2021;70:1013–1019. - PMC - PubMed
    1. Delestrain C, et al. Impact of COVID-19 social distancing on viral infection in France: a delayed outbreak of RSV. Pediatr. Pulmonol. 2021;56:3669–3673. - PMC - PubMed
    1. Jo KJ, Hwang YH, Kyung Y, Lee J-S, Park SE. 2631. The impact of the COVID-19 pandemic on seasonal respiratory virus circulation in Korean children. Open Forum Infect. Dis. 2023;10:ofad500.2243.
    1. IDWR Comparison graph with the past 10 years (weekly report) -RSV Infection -. https://www.niid.go.jp/niid/en/10/2096-weeklygraph/1661-21rsv.html.