. 2024 Apr 20;10(1):184.
doi: 10.1038/s41420-024-01954-z.

Replicative senescence and high glucose induce the accrual of self-derived cytosolic nucleic acids in human endothelial cells

Affiliations

Replicative senescence and high glucose induce the accrual of self-derived cytosolic nucleic acids in human endothelial cells

Deborah Ramini et al. Cell Death Discov. .

Abstract

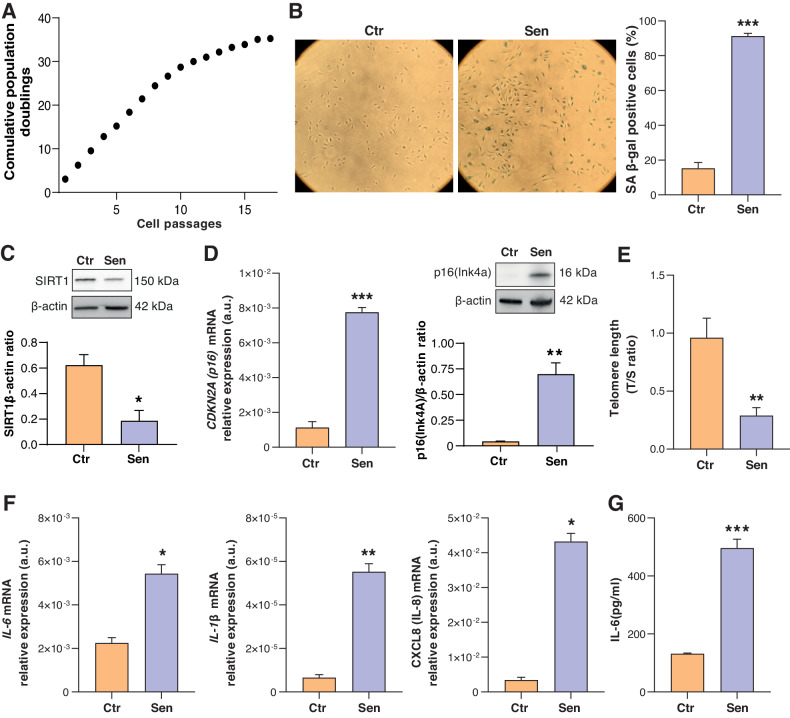
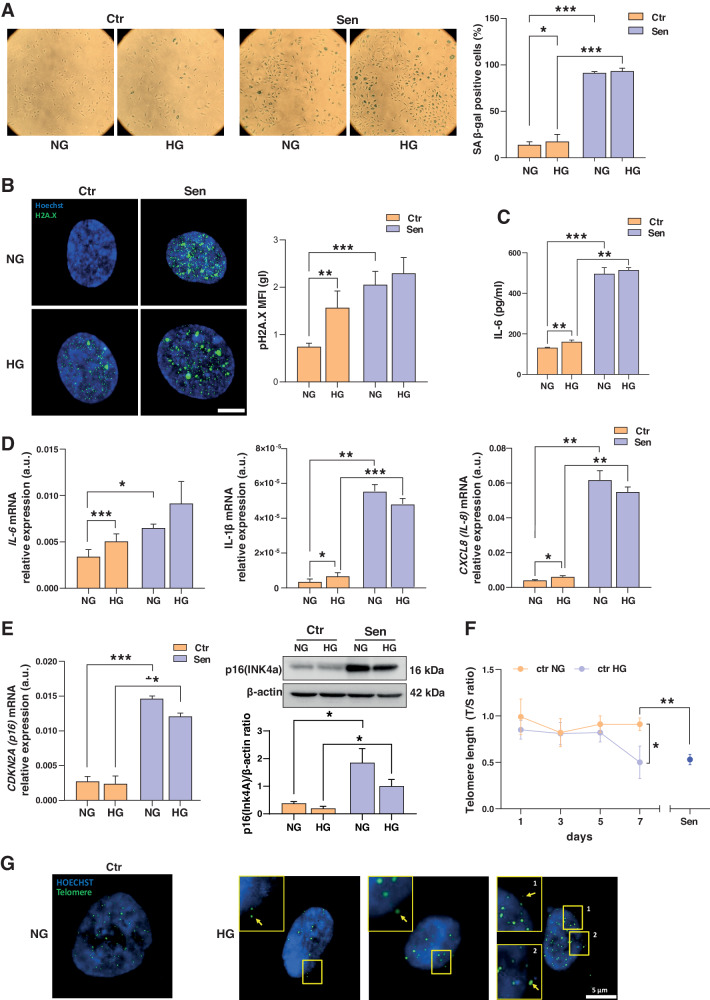
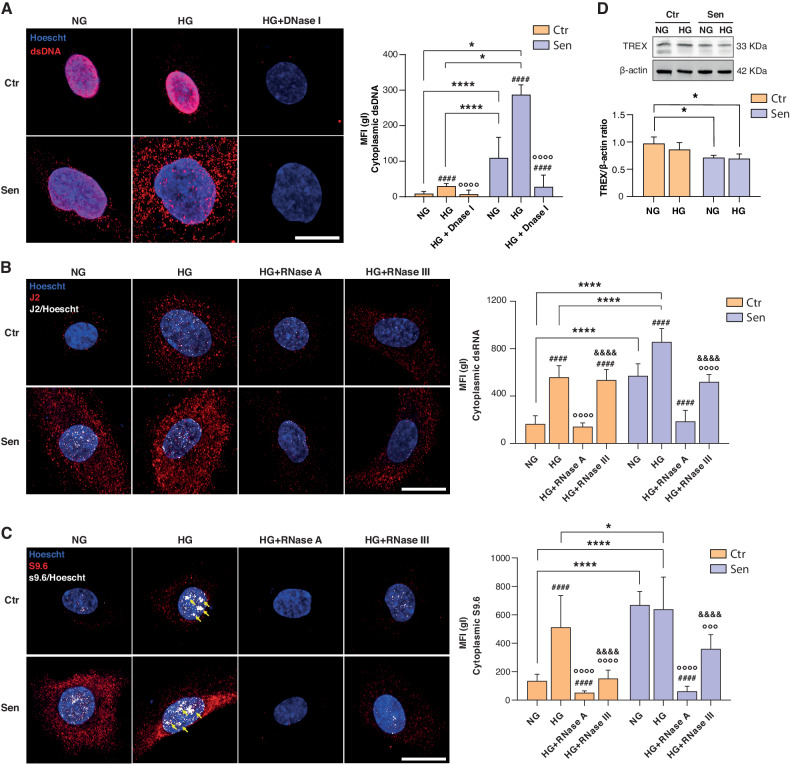
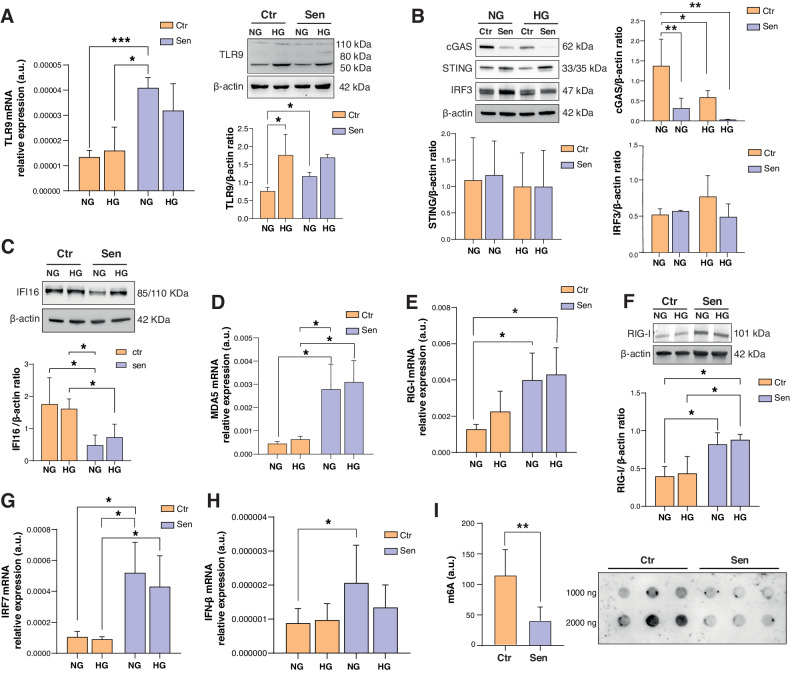
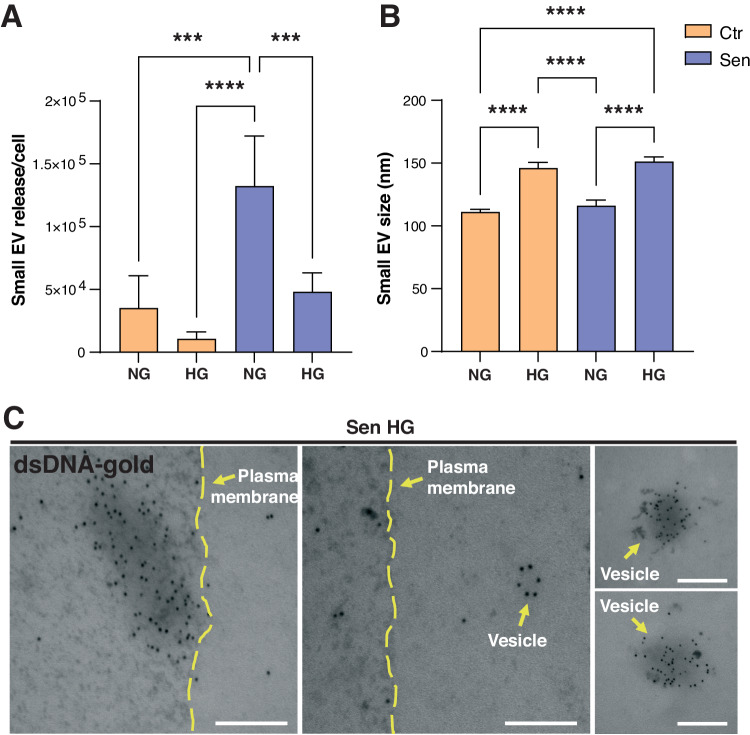
Recent literature shows that loss of replicative ability and acquisition of a proinflammatory secretory phenotype in senescent cells is coupled with the build-in of nucleic acids in the cytoplasm. Its implication in human age-related diseases is under scrutiny. In human endothelial cells (ECs), we assessed the accumulation of intracellular nucleic acids during in vitro replicative senescence and after exposure to high glucose concentrations, which mimic an in vivo condition of hyperglycemia. We showed that exposure to high glucose induces senescent-like features in ECs, including telomere shortening and proinflammatory cytokine release, coupled with the accrual in the cytoplasm of telomeres, double-stranded DNA and RNA (dsDNA, dsRNA), as well as RNA:DNA hybrid molecules. Senescent ECs showed an activation of the dsRNA sensors RIG-I and MDA5 and of the DNA sensor TLR9, which was not paralleled by the involvement of the canonical (cGAS) and non-canonical (IFI16) activation of the STING pathway. Under high glucose conditions, only a sustained activation of TLR9 was observed. Notably, senescent cells exhibit increased proinflammatory cytokine (IL-1β, IL-6, IL-8) production without a detectable secretion of type I interferon (IFN), a phenomenon that can be explained, at least in part, by the accumulation of methyl-adenosine containing RNAs. At variance, exposure to exogenous nucleic acids enhances both IL-6 and IFN-β1 expression in senescent cells. This study highlights the accrual of cytoplasmic nucleic acids as a marker of senescence-related endothelial dysfunction, that may play a role in dysmetabolic age-related diseases.


Conflict of interest statement

The authors declare no competing interests.

Figures

Fig. 1
Fig. 1. Characterization of replicative senescence in human umbilical vein endothelial cells (HUVECs).
A Growth curve showing cumulative population doublings (CPDs, Y axes) of HUVECs undergoing replicative Senescence (cell passages, X axes). B Representative images and quantification of the Senescence-Associated β-Galactosidase (SA β-Gal) staining positivity in young (Ctr, SA β-Gal < 10%) and Senescent (Sen, SA β-Gal > 80%) HUVECs. C Western blot and densitometric analysis of SIRT1 in Ctr and Sen cells. Protein expression values are reported as SIRT1/β-actin ratio. D p16(INK4a) mRNA relative expression in arbitrary units (a.u.) in Ctr and Sen cells obtained through Real Time PCR. Data were normalized using β-actin as internal control. Western blot and densitometric analysis of p16(Ink4a) in Ctr and Sen cells. Protein expression values are reported as p16(Ink4)/β-actin ratio. E Telomere length was analyzed by Real Time-PCR calculated as telomere/single copy gene ratio (T/S). F IL-6, IL-8, and IL-1 β mRNA relative expression in arbitrary units (a.u.) in CTR and SEN cells obtained through Real Time PCR. Data were normalized using β-actin as internal control. G IL-6 concentration (pg/ml) in the culture medium of Ctr and Sen cells. Data are mean ± SD of three independent experiments. *t test p < 0.05; **t test p < 0.01; ***t test p < 0.001.
Fig. 2
Fig. 2. High glucose promotes senescence feature acquisition in HUVECs.
A Representative images and quantification of the Senescence-Associated β-Galactosidase (SA β-Gal) staining positivity in Ctr and Sen HUVECs in presence of normal glucose (NG) or high glucose (HG) concentration in culture medium. B Representative immunofluorescence (IF) images and quantification of Ctr and Sen HUVECs in NG and HG conditions labeled with an antibody against h2ax-phosphorylated (green fluorescence) and Hoechst for nuclei staining (blue fluorescence). C IL-6 concentration (pg/ml) in the culture medium in Ctr and Sen cells. D IL-6, IL-8, and IL-1 β mRNA relative expression in arbitrary units (a.u.) in Ctr and Sen cells obtained through Real Time PCR. Data were normalized using β-actin as internal control. E p16(INK4a) mRNA relative expression in arbitrary units (a.u.) in Ctr and Sen cells in NG and HG conditions obtained through Real Time PCR. Data were normalized using β-actin as internal control. Western blot and densitometric analysis of p16(Ink4a) in Ctr and Sen cells. Protein expression values are reported as p16(Ink4)/β-actin ratio. F Telomere length was analyzed by Real Time-PCR calculated as telomere/single copy gene ratio (T/S) at day 1, 3, 5, and 7 of young cells in NG or HG condition. Telomere length was compared to Sen cells. G Representative IF images of telomeric FISH probes (green fluorescence) and Hoechst for nuclei staining (blue fluorescence). Yellow arrows indicate telomeric probes in cell cytoplasm. Data are mean ± SD of three independent experiments. *t test p < 0.05; **t test p < 0.01; ***t test p < 0.001.
Fig. 3
Fig. 3. RNA-sequencing analysis of HUVECs.
A Volcano plot depicting the impact of Senescence on the gene expression patterns in normal glucose levels. Some of the DE gene names were omitted due to the overlapping labels. In blue: downregulated DE genes; in red: upregulated DE genes; in green: non-significant (ns) genes. B Results of functional protein network analysis of 48 genes differentially expressed (adj. p-value < 0.10 and logFC > 1.5) in Senescent cells compared to young in normal glucose culture media. In red are highlighted proteins-players involved in interferon Alpha/Beta signaling. Nodes correspond to transcripts and edges represent protein–protein interactions: turquoise—known from curated databases, pink—known from experimentally determined, green—predicted based on gene neighborhood, red—predicted based on gene fusion, blue—predicted based on gene co-occurrence, lime—inferred from text mining, black—revealed from co-expression evidence, light blue—inferred from protein homology. C Volcano plot depicting the impact of Senescence on the gene expression patterns in high glucose levels. Some of the DE gene names were omitted due to the overlapping labels. In blue: downregulated DE genes; in red: upregulated DE genes; in green: non-significant (ns) genes.
Fig. 4
Fig. 4. High glucose-treated cells and senescent cells accumulate cytoplasmic self-derived nucleic acids.
A Representative images of nucleic and cytosolic double-stranded DNA (dsDNA) in HUVECs marked with anti-dsDNA antibody. Nuclei were labeled with Hoechst 33342 dyes (blue fluorescence). The specificity of the antibody was tested by using DNase I activity. Scale bar: 10 µm. B Anti-double-stranded RNA antibody (J2) was used to label dsRNA in HUVECs in presence/absence of high glucose treatment. RNase A and RNase III. White areas indicate co-localization of J2 antibody and Hoechst 33342 dyes. Scale bar: 10 µm. C S9.6. #, vs NG; °, vs. HG; &, vs HG+RNase A. White areas and yellow arrows indicate co-localization of S9.6 antibody and Hoechst 33342 dyes. Scale bar: 10 µm. D Western blot and densitometric analysis of TREX1. β-actin was used as a housekeeping protein. Data are mean ± SD of three independent experiments. *p < 0.05; **p < 0.01; ***p < 0.001; ****, ####, &&&& and °°°°p < 0.0001 for paired (HG vs. NG and DNase I/RNase III vs. HG) and unpaired (Sen vs. Ctr) t tests.
Fig. 5
Fig. 5. Cytosolic RNA sensors are upregulated in high glucose-treated and senescent HUVECs.
A mRNA relative expression and western blot with densitometric analysis of TLR9 in Ctr and Sen cells. Protein expression values are reported as TLR9/β-actin ratio. B Western blot and densitometric analysis of cGAS, STING, and IRF3 in Ctr and Sen cells. β-actin was used as housekeeping protein. C Western blot and densitometric analysis of IFI16 in Ctr and Sen cells. β-actin was used as housekeeping protein. D MDA5 mRNA relative expression in arbitrary units (a.u.) in Ctr and Sen cells obtained through Real Time PCR. Data were normalized using β-actin as internal control. E RIG-I mRNA relative expression in arbitrary units (a.u.) in Ctr and Sen HUVECs, β-actin was used as internal control. F Western blot with densitometric analysis of RIG-I in Ctr and Sen cells. Protein expression values are reported as RIG-I/β-actin ratio. G IRF7 relative expression in arbitrary units (a.u.) in Ctr and Sen cells obtained through Real Time PCR. Data were normalized using β-actin as internal control. H IFN-β1 relative expression in arbitrary units (a.u.) in Ctr and Sen cells obtained through Real Time PCR. Data were normalized using β-actin as internal control. I Representative dot blot of total RNA isolated from Ctr and Sen cells. 1-2 µg of RNA was probed with the antibody against N6-methyladenosine (m6A) at 1:1000 dilution in TBS 3% BSA. Data are mean ± SD of three independent experiments. *t test p < 0.05; **t test p < 0.01.
Fig. 6
Fig. 6. Exogenous DNA and RNA induce IL-6 and IFN-β1 expression.
A IL-6 and IFN-β1 relative expression of Ctr and Sen cells in NG and HG condition. HUVECs were treated with 1 µM of ODN and poly I:C for 24 h. Data were normalized using β-actin as internal control and represented as ODN or poly I:C/NT ratio. *t test p < 0.05; **t test p < 0.01; ***t test p < 0.001; ****t test p < 0.0001. B Summary of the differential regulation of cytosolic DNA and RNA sensing pathways in HUVECs under replicative senescence and high glucose conditions. ↑, upregulated; ↓, downregulated.
Fig. 7
Fig. 7. Senescent HUVECs release extracellular vesicles loaded with dsDNA.
A Number per cell and (B) size of small EVs released in Ctr and Sen in the absence or in the presence of HG determined by NTA. C Representative TEM images of dsDNA in EVs of Sen cells in HG. Scale bars: 100 nm. ***t test p < 0.001; ****t test p < 0.0001.

References

    1. Coppé JP, Patil CK, Rodier F, Sun Y, Munoz DP, Goldstein J, et al. Senescence-associated secretory phenotypes reveal cell-nonautonomous functions of oncogenic RAS and the p53 tumor suppressor. PLoS Biol. 2008;6:2853–68. - PMC - PubMed
    1. Takahashi A, Loo TM, Okada R, Kamachi F, Watanabe Y, Wakita M, et al. Downregulation of cytoplasmic DNases is implicated in cytoplasmic DNA accumulation and SASP in senescent cells. Nat Commun. 2018;9:1249. - PMC - PubMed
    1. Gluck S, Ablasser A. Innate immunosensing of DNA in cellular senescence. Curr Opin Immunol. 2019;56:31–6. - PubMed
    1. Ablasser A, Chen ZJ. cGAS in action: expanding roles in immunity and inflammation. Science. 2019;363:eaat8657. - PubMed
    1. Mullani N, Porozhan Y, Mangelinck A, Rachez C, Costallat M, Batsche E, et al. Reduced RNA turnover as a driver of cellular senescence. Life Sci Alliance. 2021;4:e202000809. - PMC - PubMed