. 2024 Apr 18;16(8):7141-7152.
doi: 10.18632/aging.205748. Epub 2024 Apr 18.

Aberrant expression of thyroidal hormone receptor α exasperating mitochondrial dysfunction induced sarcopenia in aged mice

Affiliations

Aberrant expression of thyroidal hormone receptor α exasperating mitochondrial dysfunction induced sarcopenia in aged mice

Yunlu Sheng et al. Aging (Albany NY). .

Abstract

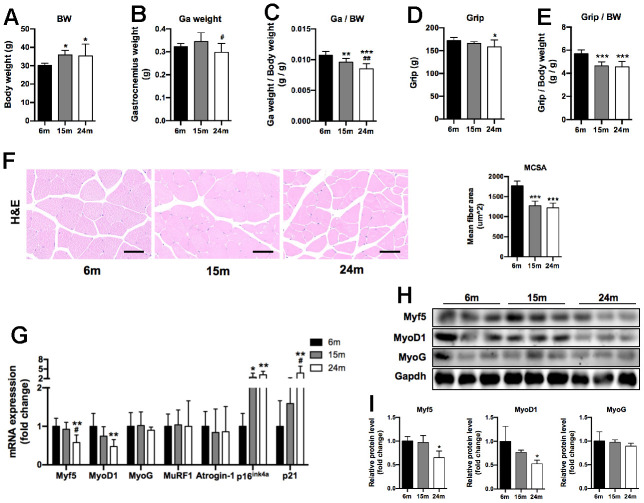
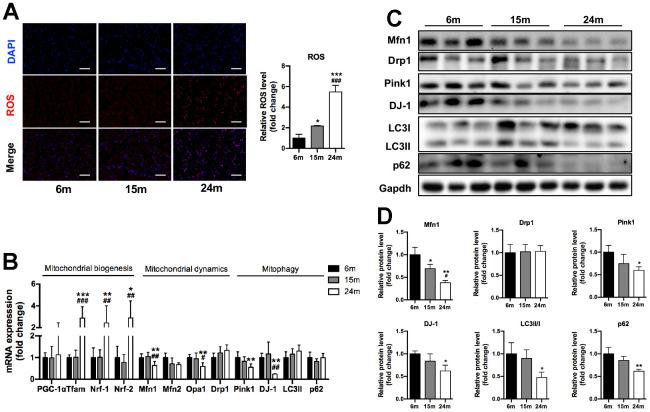
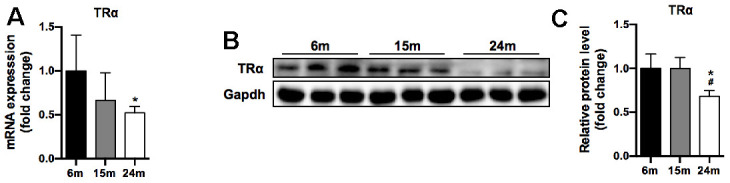
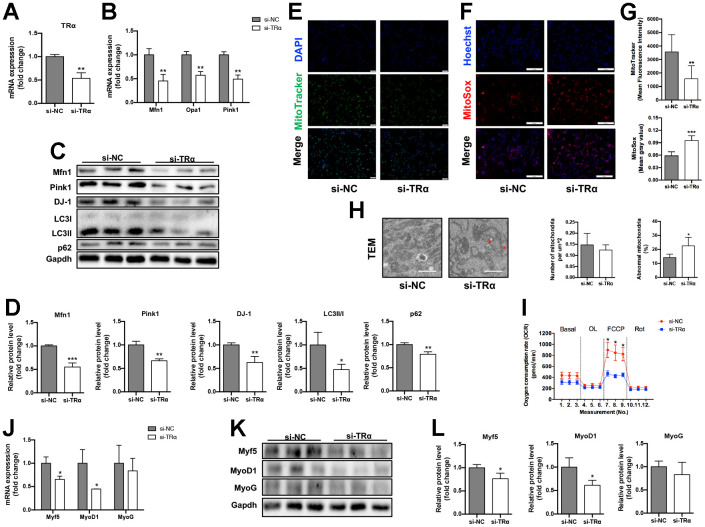
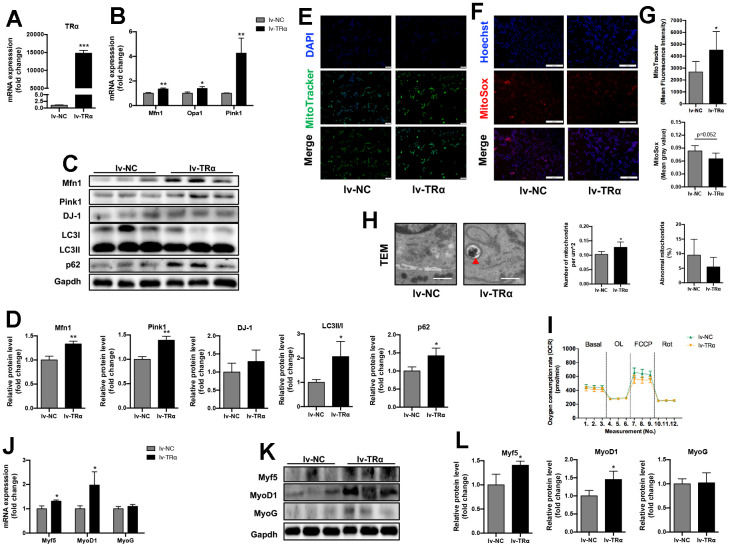
Disrupted mitochondrial dynamics and mitophagy contribute to functional deterioration of skeletal muscle (SM) during aging, but the regulatory mechanisms are poorly understood. Our previous study demonstrated that the expression of thyroid hormone receptor α (TRα) decreased significantly in aged mice, suggesting that the alteration of thyroidal elements, especially the decreased TRα, might attenuate local THs action thus to cause the degeneration of SM with aging, while the underlying mechanism remains to be further explored. In this study, decreased expression of myogenic regulators Myf5, MyoD1, mitophagy markers Pink1, LC3II/I, p62, as well as mitochondrial dynamic factors Mfn1 and Opa1, accompanied by increased reactive oxygen species (ROS), showed concomitant changes with reduced TRα expression in aged mice. Further TRα loss- and gain-of-function studies in C2C12 revealed that silencing of TRα not only down-regulated the expression of above-mentioned myogenic regulators, mitophagy markers and mitochondrial dynamic factors, but also led to a significant decrease in mitochondrial activity and maximum respiratory capacity, as well as more mitochondrial ROS and damaged mitochondria. Notedly, overexpression of TRα could up-regulate the expression of those myogenic regulators, mitophagy markers and mitochondrial dynamic factors, meanwhile also led to an increase in mitochondrial activity and number. These results confirmed that TRα could concertedly regulate mitochondrial dynamics, autophagy, and activity, and myogenic regulators rhythmically altered with TRα expression. Summarily, these results suggested that the decline of TRα might cause the degeneration of SM with aging by regulating mitochondrial dynamics, mitophagy and myogenesis.

Keywords: aging mice; mitochondrial dysfunction; mitophagy; skeletal muscles; thyroid hormone receptor α.


Conflict of interest statement

CONFLICTS OF INTEREST: The authors declare that they have no conflicts of interest.

Figures

Figure 1
Figure 1
Changes in body weight (BW), gastrocnemius muscle weight (Ga weight), four-limb grip strength (Grip), MCSA, and expression of myogenesis and senescence-related makers during aging. (A) Body weight of mice; (B) Ga weight of mice; (C) Ga weight normalized by BW (Ga weight/BW); (D) Grip strength of mice; (E) Grip strength normalized by BW (Grip/BW), n=10 for 6m group, n=9 for 15m group, n=11 for 24m group (AE); (F) Representative H&E staining images of Ga muscle section and quantitative analysis of MCSA level of three groups, Scale bar: 50 μm, n=3; (G) mRNA levels of myogenesis and senescence-related makers, n=7; (H) Representative Western blots and (I) quantification of Myf5, MyoD1, MyoG and Gapdh (loading control), n=3. *p<0.05, **p<0.01, ***p<0.001 vs. 6m group; #p<0.05, ##p<0.01 vs. 15m group.
Figure 2
Figure 2
Increased ROS production and altered mitochondrial regulators of SM in mice during aging. (A) Representative ROS fluorescence staining of Ga muscles and quantification, Scale bar: 100 μm, n=3; (B) mRNA levels of mitochondrial biogenesis, mitochondrial dynamics and mitophagy/autophagy-related markers, n=7; (C) Representative Western blots and (D) quantification of Mfn1, Drp1, Pink1, DJ-1, LC3II/I, p62 and Gapdh (loading control), n=3. *p<0.05, **p<0.01, ***p<0.001 vs. 6m group; #p<0.05, ##p<0.01 vs. 15m group.
Figure 3
Figure 3
TRα mRNA and protein levels of SM in mice during aging. (A) mRNA level of TRα, n=7; (B) Representative Western blots and (C) quantification of TRα and Gapdh (loading control), n=3. *p<0.05 vs. 6m group; #p<0.05 vs. 15m group.
Figure 4
Figure 4
Knockdown of TRα in C2C12. The cells were transfected with TRα-targeted siRNA or non-targeted siRNA for 24h, 48h or 72h. si-NC negative control, si-TRα siRNA-TRα. (A) mRNA level of TRα, n=3; (B) mRNA levels of Mfn1, Opa1 and Pink1, n=3; (C) Representative Western blots and (D) quantification of Mfn1, Pink1, DJ-1, LC3II/I, p62 and Gapdh (loading control), n=3; (E) Representative MitoTracker immunofluorescence staining of cells, nuclei were counterstained with DAPI, scale bar: 100 μm; (F) Representative MitoSox immunofluorescence staining of cells, nuclei were counterstained with Hoechst, scale bar: 200 μm; (G) Quantification of MitoTracker Green fluorescence intensity (n=8) and MitoSox Red fluorescence intensity (n=5), respectively, fluorescence intensity was quantified using densitometric image analysis software with cell quantity adjustment; (H) Representative transmission electron microscopy images of mitochondria and quantification of mitochondrial number and percentage of abnormal mitochondria, the red ‘*’ represents damaged mitochondria (mitochondria with disrupted membrane, loss of cristae, matrix dissolution and vacuolization), scale bar: 1 μm, n=5; (I) Seahorse analysis of oxygen consumption rate (OCR), OCR was measured continuously throughout the experimental period at baseline and in the presence of the indicated drugs: 1.5 μM oligomycin, 0.5 μM FCCP and 0.5 μM rotenone, n=4; (J) mRNA levels of Myf5, MyoD1 and MyoG, n=3; (K) Representative Western blots and (L) quantification of Myf5, MyoD1, MyoG and Gapdh (loading control), n=3. *p<0.05, **p<0.01 vs. control group (si-NC). All experiments were repeated three independent times.
Figure 5
Figure 5
Overexpression of TRα in C2C12. Cells were transfected with TRα-targeted overexpression plasmid or non-targeted plasmid for 24h, 48h or 72h. lv-NC negative control, lv-TRα overexpressing plasmid-vector TRα. (A) mRNA level of TRα, n=3; (B) mRNA levels of Mfn1, Opa1 and Pink1, n=3; (C) Representative Western blots and (D) quantification of Mfn1, Pink1, DJ-1, LC3II/I, p62 and Gapdh (loading control), n=3; (E) Representative MitoTracker immunofluorescence staining of cells, nuclei were counterstained with DAPI, scale bar: 100 μm; (F) Representative MitoSox immunofluorescence staining of cells, nuclei were counterstained with Hoechst, scale bar: 200 μm; (G) Quantification of MitoTracker Green fluorescence intensity (n=8) and MitoSox Red fluorescence intensity (n=5), respectively, fluorescence intensity was quantified using densitometric image analysis software with cell quantity adjustment; (H) Representative transmission electron microscopy images of mitochondria and quantification of mitochondrial number and percentage of abnormal mitochondria, the red ‘▲’ is labeling mitochondria inside autophagic vesicles, Scale bar: 1 μm, n=5; (I) Seahorse analysis of oxygen consumption rate (OCR), OCR was measured continuously throughout the experimental period at baseline and in the presence of the indicated drugs: 1.5 μM oligomycin, 0.5 μM FCCP and 0.5 μM rotenone, n=4; (J) mRNA levels of Myf5, MyoD1 and MyoG, n=3; (K) Representative Western blots and (L) quantification of Myf5, MyoD1, MyoG and Gapdh (loading control), n=3. *p<0.05, **p<0.01 vs. control group (lv-NC). All experiments were repeated three independent times.

References

    1. Bloise FF, Cordeiro A, Ortiga-Carvalho TM. Role of thyroid hormone in skeletal muscle physiology. J Endocrinol. 2018; 236:R57–68. 10.1530/JOE-16-0611 - DOI - PubMed
    1. Malmstroem S, Grove-Laugesen D, Riis AL, Bruun BJ, Ebbehoj E, Hansen KW, Watt T, Rejnmark L. Muscle Performance and Postural Stability Are Reduced in Patients with Newly Diagnosed Graves’ Disease. Thyroid. 2019; 29:783–9. 10.1089/thy.2018.0318 - DOI - PubMed
    1. Tysoe O. Skeletal muscle weakness in hypothyroidism. Nat Rev Endocrinol. 2021; 17:447. 10.1038/s41574-021-00528-8 - DOI - PubMed
    1. Yen PM. Physiological and molecular basis of thyroid hormone action. Physiol Rev. 2001; 81:1097–142. 10.1152/physrev.2001.81.3.1097 - DOI - PubMed
    1. Cruz-Jentoft AJ, Sayer AA. Sarcopenia. Lancet. 2019; 393:2636–46. 10.1016/S0140-6736(19)31138-9 - DOI - PubMed

Publication types

Substances

LinkOut - more resources