. 2024 Aug 1;144(5):496-509.
doi: 10.1182/blood.2023023237.

Integrative single-cell chromatin and transcriptome analysis of human plasma cell differentiation

Affiliations

Integrative single-cell chromatin and transcriptome analysis of human plasma cell differentiation

Elina Alaterre et al. Blood. .

Abstract

Plasma cells (PCs) are highly specialized cells representing the end stage of B-cell differentiation. We have shown that PC differentiation can be reproduced in vitro using elaborate culture systems. The molecular changes occurring during PC differentiation are recapitulated in this in vitro differentiation model. However, a major challenge exists to decipher the spatiotemporal epigenetic and transcriptional programs that drive the early stages of PC differentiation. We combined single cell (sc) RNA sequencing (RNA-seq) and assay for transposase-accessible chromatin with high throughput sequencing (scATAC-seq) to decipher the trajectories involved in PC differentiation. ScRNA-seq experiments revealed a strong heterogeneity of the preplasmablastic and plasmablastic stages. Among genes that were commonly identified using scATAC-seq and scRNA-seq, we identified several transcription factors with significant stage specific potential importance in PC differentiation. Interestingly, differentially accessible peaks characterizing the preplasmablastic stage were enriched in motifs of BATF3, FOS and BATF, belonging to activating protein 1 (AP-1) transcription factor family that may represent key transcriptional nodes involved in PC differentiation. Integration of transcriptomic and epigenetic data at the single cell level revealed that a population of preplasmablasts had already undergone epigenetic remodeling related to PC profile together with unfolded protein response activation and are committed to differentiate in PC. These results and the supporting data generated with our in vitro PC differentiation model provide a unique resource for the identification of molecular circuits that are crucial for early and mature PC maturation and biological functions. These data thus provide critical insights into epigenetic- and transcription-mediated reprogramming events that sustain PC differentiation.


Conflict of interest statement

Conflict-of-interest disclosure: The authors declare no competing financial interests.

Figures

None
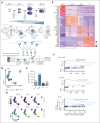
Graphical abstract
Figure 1.
Figure 1.
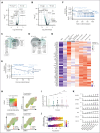
Single-cell transcriptomics analysis of MBCs, prePBs, plasmablasts and PCs during B to PC differentiation. (A) Schematic representation of the in vitro model of B to PC differentiation. MBCs from human peripheral blood were purified and cultured with activating molecules, sCD40L and oligodeoxynucleotides, and cytokines, IL-2, IL-10, and IL-21 to obtain prePBs at day 4. Cells were then cultured with IL-2, IL-6, IL-10, IL-15, and IL-21 cytokines to obtain PBs at day 7. Finally, PBs were cultured with IL-6, IL-15, and IFNα until day 10 to obtain PCs. Flow cytometry gating of CD19+/CD27+ MBCs at day 0, CD20/CD38 prePBs at day 4, CD20/CD38+ PBs at day 7 and CD38+/CD138+ PCs at day 10. Schematic representation of the BD Rhapsody single-cell analysis system used in this study. MBC, prePB, PB, and PC were thawed and tagged with 4 different tags to associate, after sequencing, each read to 1 stage. The 4 populations (almost 10 000 cells) were pooled and loaded onto a cartridge composed of more than 200 000 wells. Unique barcoded beads were added in excess and after washing, each cell was associated to a unique bead, allowing the association of each read to a unique cell. Then, cells were lysed and messenger RNA (mRNA) was hybridized on the beads. To finish, beads were recovered to synthetize complementary DNA and amplify libraries prior to sequence. (B) UMAP representation of the 4 stages identified using tags and demultiplexing. (C) Number of positive differentially expressed genes identified for the 4 stages using pairwise comparisons (one stage vs all other cells). (D) mRNA expression of B-cell TFs: BACH2, BCL6 and PX5; and PC TFs: IRF4, PRDM1 and XBP1. (E) Heat map of the top 10 genes upregulated of each stage. (F) Gene ontology enrichment analysis showing both pathways enriched in upregulated and downregulated genes during transitions: from MBC to prePB, from prePB to PB and from PB to PC.
Figure 2.
Figure 2.
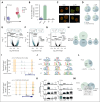
Single-cell chromatin accessibility of MBCs, prePBs, plasmablasts, and PCs during B to PC differentiation. (A) UMAP representation of the 4 stages analyzed separately and then merged together. Peaks detected with MACS2 peak calling were used for UMAP representation. (B) Number of differentially accessible peaks identified for the 4 stages using pairwise comparisons (one stage vs all other cells). (C) Cells were fixed with 4% paraformaldehyde for 10 minutes at different time points: MBCs (day 0), PrePBs (day 4), PBs (day 7), and PCs (day 10). Immunofluorescence to detect H3K27me3 levels (green) was performed with an anti-H3K27me3 antibody. DNA was stained with DAPI (4′,6-diamidino-2-phenylindole) (red). Scale bar, 10 μm. (D) Proportion of peaks localized on genes (in blue) and distal elements (in green) for each stage. (E-G) Volcano plots of differentially accessible peaks identified during transitions: from MBC to prePB, from prePB to PB, and from PB to PC, respectively. Peaks identified as significantly accessible were colored in blue (P value <.05 and log2(fold change) > 0.25). (H) Venn diagrams representing genes that were upregulated in RNA-seq data set (in blue) and/or associated with more open chromatin in ATAC-seq data set (in green). (I) Peak tracks of BATF and BATF3 revealing differentially accessible peaks on BATF and BATF3 genes and on distal elements. (J) TF motif enrichment of differentially accessible peaks for each stage. (K) mRNA expression of TFs belonging to the AP-1 family in the 4 stages using the RNA-seq data set. (L) Proportion of differentially accessible peaks in the prePB stage enriched in BATF3 motif. (M) Venn diagram of the number of genes upregulated in the prePB stage identified using the RNA-seq data set and the number of genes associated with a more open chromatin enriched in BATF3 motif identified using ATAC-seq data set. Common genes represented potential BATF3 targets.
Figure 3.
Figure 3.
Integration of scRNA-seq and scATAC-seq data sets. (A-B) UMAP representation of scRNA-seq and scATAC-seq merged data set. First, using the top 50 differentially expressed genes of each stage from the scRNA-seq data set and the number of reads within genes of interest from the scATACseq data set, a gene activity matrix was calculated for scATAC-seq data set to find and set anchors. Gene expression values of scATAC-seq data set were predicted using the global gene expression values of scRNA-seq data set and identified anchors. Both scRNA-seq and scATAC-seq gene expression matrixes were finally merged. (C) Number of cells predicted using the gene activity matrix vs actual number of observed cells at each stage (MBC, prePB, PB, and PC). (D) Percentage of prePB and PB predicted as MBC, prePB, PB, and PC. (E) Volcano plot showing differentially expressed genes (using the gene activity matrix) between the prePB predicted as prePB and the prePB predicted as PC. Genes identified as significantly differentially expressed were colored in blue (P value <.05 and log2(fold change) >0.25). (F) IFI6 expression observed in MBC, prePB, PB, and PC using scRNA-seq (top) and scATAC-seq (bottom) data sets. High and low expression were represented in dark blue and in yellow, respectively.
Figure 4.
Figure 4.
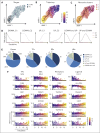
Identification of subpopulations within the different stages of B to PC differentiation. (A) Seurat k-nearest neighbors clustering identified 7 clusters: 1 cluster corresponding to MBC and 2 clusters for each stage of prePB, PB, and PC. (B) Identification of quiescent cells (G1) and proliferative cells (S and G2M) using the Seurat cell-cycle scoring. (C) mRNA expression of CDC20, CDK1, MKI67 and PCNA involved in cell cycle. High and low expression were represented in dark blue and in yellow, respectively. (D) Cell-cycle distribution of each stage. (E) Heat map displaying the average expression of selected genes in clusters identified in panel A.
Figure 5.
Figure 5.
Pseudotemporal analysis of prePB and PB subpopulations. (A) UMAP representation of proliferative prePB and PB. (B) UMAP projection colored by normalized pseudotime analysis. (C) Clusters identified using the Monocle 3 package and used to define trajectories. (D) Temporal gene expression patterns from prePB to PB. (E) Proportion of genes coding TFs, epigenetic enzymes (EEs) and proteins involved in ligand/receptor interactions deregulated along the trajectory according to the expression patterns defined in panel D. (F) Plots of the expression of top differentially expressed genes coding for TFs, EEs, ligands and receptors in function of pseudotime.
Figure 6.
Figure 6.
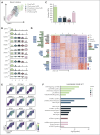
Identification of new subpopulations of prePB and PB stages. (A) Seurat k-nearest neighbors clustering identified 5 clusters, including 4 clusters for prePB and 1 cluster for PB. (B) Violin plots representing the expression of top marker genes identified using the pseudotime analysis for each cluster. (C) Number of positive differentially expressed genes identified in the 5 clusters using pairwise comparisons (one cluster vs all other cells). (D) The heat map showed the top 50 genes upregulated in each cluster. Keys genes coding TFs, EEs, ligands, and receptors were indicated and colored in gray, red, green, and blue, respectively. (E) Expression levels of TFs identified in panel D. High and low expression were represented in dark blue and in yellow, respectively. (F) Gene set enrichment analysis of the whole genes upregulated in each cluster.
Figure 7.
Figure 7.
Dual activation of UPR during prePB and PB stages. (A-B) Volcano plots showing differentially expressed genes between the cluster 2 (C2) vs clusters 1, 3 et 4 (C1-3-4) and cluster 5 (C5) vs cluster 4 (C4), respectively. Genes identified as significantly differentially expressed were colored in blue (P value <.05 and log2(fold change) >0.25). (C) Venn diagram representing genes involved in UPR and upregulated in C2 and/or C5. (D) Venn diagram of genes upregulated in C2 and/or C5. Common genes were potentially involved in UPR. (E-F) Gene set enrichment analysis showing both pathways enriched in upregulated and downregulated genes in C2 and C5 compared with C1-3-4 and C4, respectively. (G) Heat map displaying the expression of genes involved in UPR and upregulated in C2 and/or C5 for each cluster of proliferating prePB and PB, as well as quiescent MBC, PB, and PC. (H) Visualization of cells simultaneously coexpressing HSPA5 (in green) and ERN1, EIF2AK3, or ATF6 (in red) genes. Yellow dots correspond to the coexpression of the 2 genes. (I) Boxplots representing the log2 ratio of IGL and IGH read counts per cell in each cluster. (J) Plots of HSPA5 and XBP1 mRNA expression in function of pseudotime. (K) Violin plots of the main immunoglobulin genes expressed in PCs for each cluster of proliferating prePB and PB, as well as quiescent MBC, PB, and PC.

Comment in

References

    1. Shapiro-Shelef M, Calame K. Regulation of plasma-cell development. Nat Rev Immunol. 2005;5(3):230–242. - PubMed
    1. Kassambara A, Herviou L, Ovejero S, et al. RNA-sequencing data-driven dissection of human plasma cell differentiation reveals new potential transcription regulators. Leukemia. 2021;35(5):1451–1462. - PMC - PubMed
    1. Kassambara A, Jourdan M, Bruyer A, et al. Global miRNA expression analysis identifies novel key regulators of plasma cell differentiation and malignant plasma cell. Nucleic Acids Res. 2017;45(10):5639–5652. - PMC - PubMed
    1. Caron G, Hussein M, Kulis M, et al. Cell-Cycle-Dependent Reconfiguration of the DNA Methylome during Terminal Differentiation of Human B Cells into Plasma Cells. Cell Rep. 2015;13(5):1059–1071. - PubMed
    1. Nutt SL, Hodgkin PD, Tarlinton DM, Corcoran LM. The generation of antibody-secreting plasma cells. Nat Rev Immunol. 2015;15(3):160–171. - PubMed

Publication types