. 2024 Jul;271(7):4310-4325.
doi: 10.1007/s00415-024-12348-7. Epub 2024 Apr 21.

Amyotrophic lateral sclerosis stratification: unveiling patterns with virome, inflammation, and metabolism molecules

Affiliations

Amyotrophic lateral sclerosis stratification: unveiling patterns with virome, inflammation, and metabolism molecules

Elena Niccolai et al. J Neurol. 2024 Jul.

Abstract

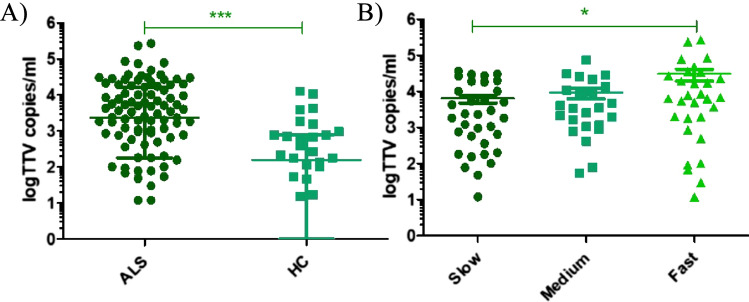
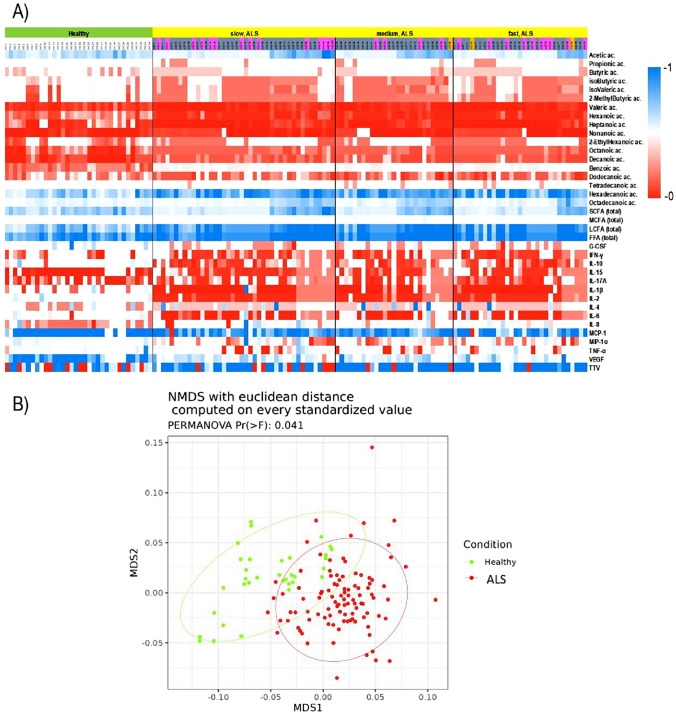
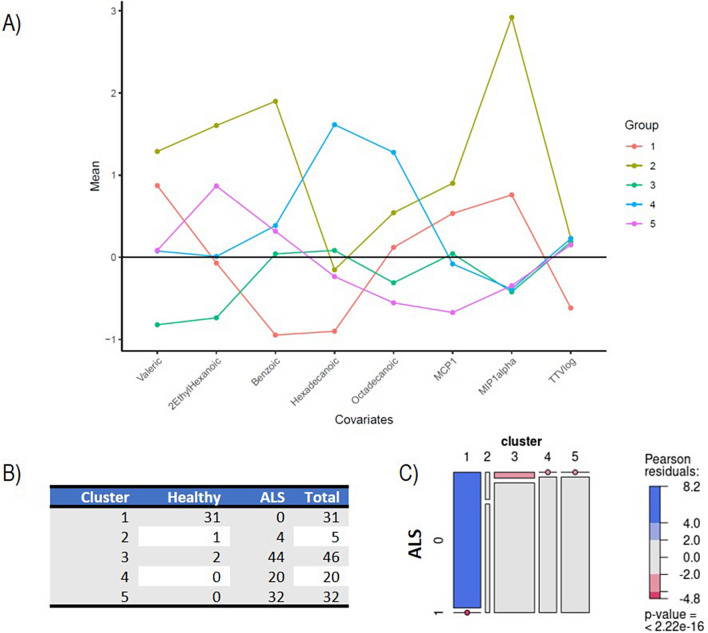
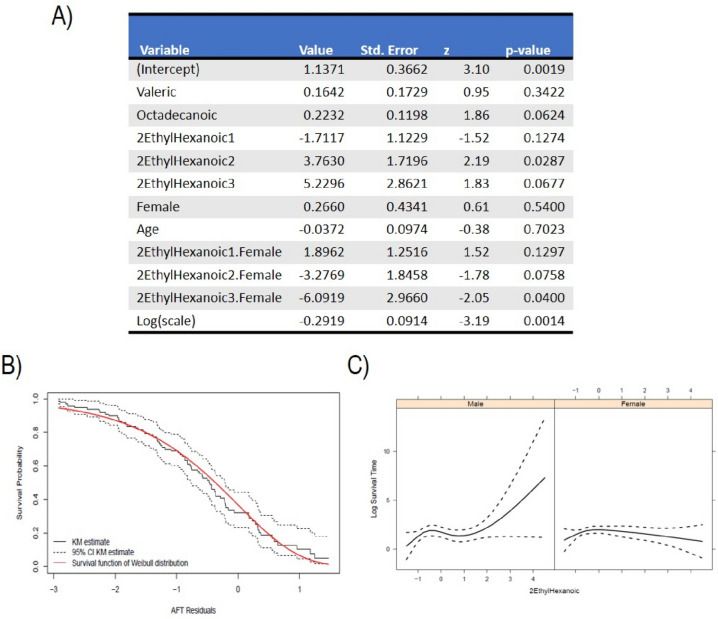
Amyotrophic lateral sclerosis (ALS) is an untreatable and clinically heterogeneous condition primarily affecting motor neurons. The ongoing quest for reliable biomarkers that mirror the disease status and progression has led to investigations that extend beyond motor neurons' pathology, encompassing broader systemic factors such as metabolism, immunity, and the microbiome. Our study contributes to this effort by examining the potential role of microbiome-related components, including viral elements, such as torque tenovirus (TTV), and various inflammatory factors, in ALS. In our analysis of serum samples from 100 ALS patients and 34 healthy controls (HC), we evaluated 14 cytokines, TTV DNA load, and 18 free fatty acids (FFA). We found that the evaluated variables are effective in differentiating ALS patients from healthy controls. In addition, our research identifies four unique patient clusters, each characterized by distinct biological profiles. Intriguingly, no correlations were found with site of onset, sex, progression rate, phenotype, or C9ORF72 expansion. A remarkable aspect of our findings is the discovery of a gender-specific relationship between levels of 2-ethylhexanoic acid and patient survival. In addition to contributing to the growing body of evidence suggesting altered peripheral immune responses in ALS, our exploratory research underscores metabolic diversity challenging conventional clinical classifications. If our exploratory findings are validated by further research, they could significantly impact disease understanding and patient care customization. Identifying groups based on biological profiles might aid in clustering patients with varying responses to treatments.

Keywords: Amyotrophic lateral sclerosis; Cytokines; Metabolism; Microbiome; Short chain fatty acids; TTV; Virome.


Conflict of interest statement

On behalf of all authors, the corresponding author states that there is no conflict of interest.

Figures

Fig. 1
Fig. 1
Torque teno virus abundance (copies/ml) in A ALS patients compared to HC; B ALS patients with different progression rate. ***p-value < 0.001*p-value < 0.05
Fig. 2
Fig. 2
A Heatmap visualization based on cytokines, free fatty acids, and TTV distribution. Rows: biological variables; columns: patients. Green: HC; yellow: ALS patients; pink = bulbar onset; gray = spinal onset; orange = respiratory onset. Color key indicates metabolite expression value: blue: lowest; red: highest. B The sample distances among ALS patients and healthy controls have been represented through a NMDS plot with Euclidean distance on standardized values and the estimated 95% confidence interval of group centroids has been tracked as ellipses
Fig. 3
Fig. 3
Cluster analysis A Mean expression levels of biological markers within the five identified clusters, after normalization to ensure zero mean and unit variance across the dataset. This normalization process allows for a straightforward comparison of biological marker expressions among clusters, using the (normalized) average expression level (represented by a horizontal black line) as a reference point. The colorful lines depict the unique “biological profile” of each cluster. B and C Contingency table and cluster membership with graphical representation of the χ2 test. Panel B shows considerable differences in the proportion of patients and healthy subjects across clusters, with a strong prevalence of healthy patients in Cluster 1. The mosaic plot represents the statistical association between cluster membership and ALS prognosis. The horizontal axis displays the distribution of cluster membership, with each segment’s width indicating the relative frequency of clusters. Vertically, within each cluster, the distribution of ALS presence is shown. The areas of rectangles represent the relative frequency of ALS patients and healthy controls in each cluster. A dot over a segment signifies no subjects with that combination of prognosis and cluster membership. Rectangles with similar heights across clusters suggest independence between prognosis and cluster membership (i.e., no association), while significantly different heights indicate an association. Colored cases indicate the strength of association, with red indicating observed frequencies smaller than expected (under the null hypothesis of independence) and blue indicating larger frequencies
Fig. 4
Fig. 4
A Summary of the fitted survival regression model. The table reports estimated values for each predictor variable in the model, including the intercept and the log of the scale parameter. “Std. Error” is the standard deviation of the sampling distribution of the coefficient estimates, indicating the precision of the estimates. “z” is the z-statistic for each coefficient, used to test the significance of each parameter. “p-value” is the p-value associated with the z-value, indicating the significance of each predictor variable in the model; B The validity of the assumed Weibull distribution for the survival times can be assessed using residuals that account for censoring. This is done by computing the fitted model residuals and creating a Kaplan–Meier estimate. The estimated residuals and the assumed Weibull distribution are then plotted and compared to assess their fit. A good fit to the data indicates that the Weibull distribution is a suitable model for the survival times. The solid black line represents the Kaplan–Meier estimator of the residuals, with the black dotted lines representing the upper and lower 95%CI. The solid red line represents the survival probability estimated with the fitted AFT model. C Graphical representation of the effect of 2-ethylhexanoic acid on log survival time, considering its interaction with sex. The left panel shows the effect of 2-ethylhexanoic acid on log survival for male patients and the right panel for females. Since we modeled the effect of 2-ethylhexanoic using nonlinear terms (cubic splines), it is not constant for different expression levels. Since the biological features have been standardized, the value “0” for 2-ethylhexanoic denotes the average expression of 2-ethylhexanoic acid

References

    1. Appel SH, Beers DR, Zhao W. Amyotrophic lateral sclerosis is a systemic disease: peripheral contributions to inflammation-mediated neurodegeneration. Curr Opin Neurol. 2021;34:765–772. - PubMed
    1. Area-Gomez E, Larrea D, Yun T, Xu Y, Hupf J, Zandkarimi F, Chan RB, Mitsumoto H. Lipidomics study of plasma from patients suggest that ALS and PLS are part of a continuum of motor neuron disorders. Sci Rep. 2021;11:13562. - PMC - PubMed
    1. Baldi S, Menicatti M, Nannini G, Niccolai E, Russo E, Ricci F, Pallecchi M, Romano F, Pedone M, Poli G, Renzi D, Taddei A, Calabrò AS, Stingo FC, Bartolucci G, Amedei A. Free fatty acids signature in human intestinal disorders: significant association between butyric acid and celiac disease. Nutrients. 2021;13:742. - PMC - PubMed
    1. Banfield JD, Raftery AE. Model-based Gaussian and non-Gaussian clustering. Biometrics. 1993;49:803–821.
    1. Beers DR, Appel SH. Immune dysregulation in amyotrophic lateral sclerosis: mechanisms and emerging therapies. Lancet Neurol. 2019;18:211–220. - PubMed

LinkOut - more resources