. 2024 Apr 22;9(1):94.
doi: 10.1038/s41392-024-01804-5.

PBX/Knotted 1 homeobox-2 (PKNOX2) is a novel regulator of myocardial fibrosis

Affiliations

PBX/Knotted 1 homeobox-2 (PKNOX2) is a novel regulator of myocardial fibrosis

Liang Chen et al. Signal Transduct Target Ther. .

Abstract

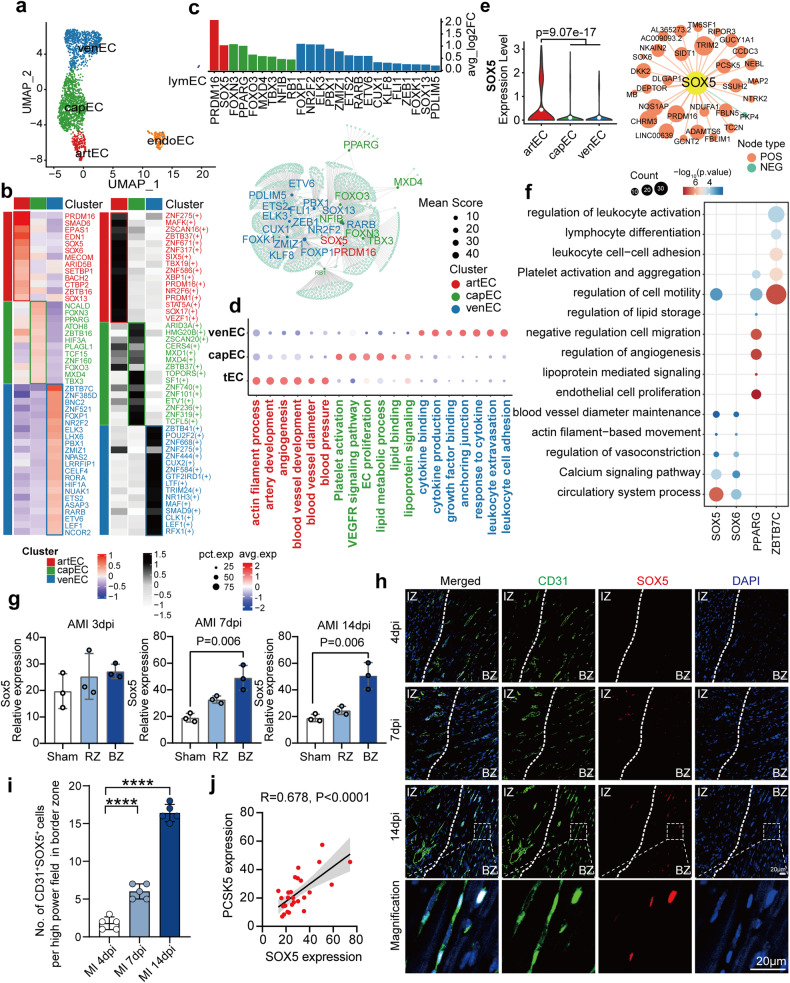
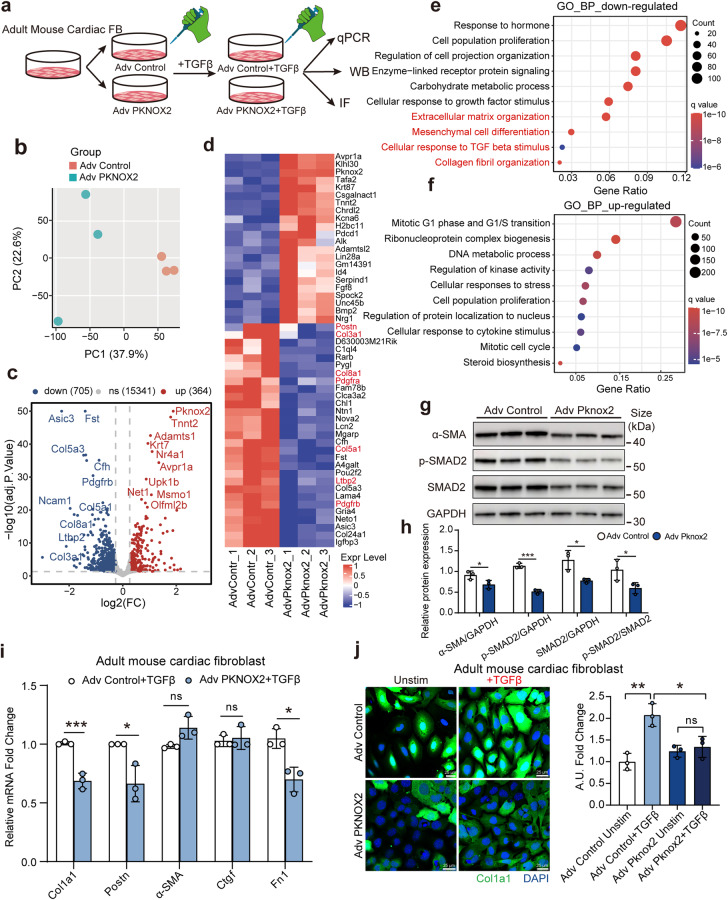
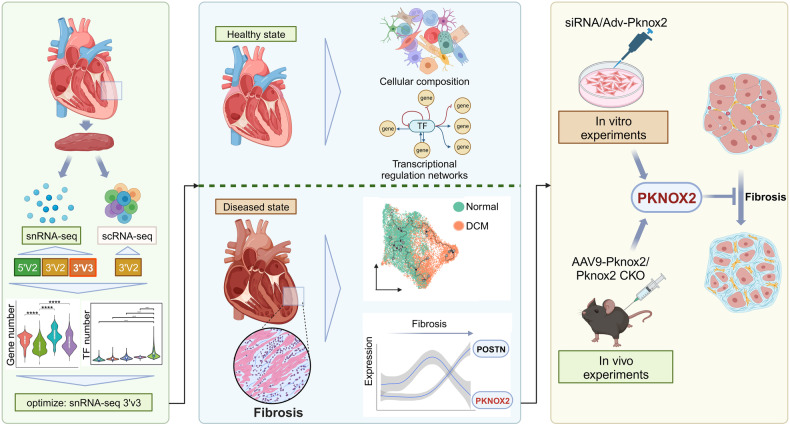
Much effort has been made to uncover the cellular heterogeneities of human hearts by single-nucleus RNA sequencing. However, the cardiac transcriptional regulation networks have not been systematically described because of the limitations in detecting transcription factors. In this study, we optimized a pipeline for isolating nuclei and conducting single-nucleus RNA sequencing targeted to detect a higher number of cell signal genes and an optimal number of transcription factors. With this unbiased protocol, we characterized the cellular composition of healthy human hearts and investigated the transcriptional regulation networks involved in determining the cellular identities and functions of the main cardiac cell subtypes. Particularly in fibroblasts, a novel regulator, PKNOX2, was identified as being associated with physiological fibroblast activation in healthy hearts. To validate the roles of these transcription factors in maintaining homeostasis, we used single-nucleus RNA-sequencing analysis of transplanted failing hearts focusing on fibroblast remodelling. The trajectory analysis suggested that PKNOX2 was abnormally decreased from fibroblast activation to pathological myofibroblast formation. Both gain- and loss-of-function in vitro experiments demonstrated the inhibitory role of PKNOX2 in pathological fibrosis remodelling. Moreover, fibroblast-specific overexpression and knockout of PKNOX2 in a heart failure mouse model induced by transverse aortic constriction surgery significantly improved and aggravated myocardial fibrosis, respectively. In summary, this study established a high-quality pipeline for single-nucleus RNA-sequencing analysis of heart muscle. With this optimized protocol, we described the transcriptional regulation networks of the main cardiac cell subtypes and identified PKNOX2 as a novel regulator in suppressing fibrosis and a potential therapeutic target for future translational studies.


Conflict of interest statement

The authors declare no competing interests.

Figures

Fig. 1
Fig. 1
Unbiased characterization of human cardiac cellular composition. a snRNA-seq workflow using the 10X Genomic platform with five human donor hearts (n = 5, donor #2–#6 shown in Table S1, male, age 29–50). bTSNE plot showing the distribution of cell types for snRNA-seq and scRNA-seq. c Composition of cell culsters and subclusters of immune cell and EC.d The proportion of cardiomyocyte nuclei in human left ventricular myocardium was verified by immunostaining and flow cytometry, and both PCM1 and DAPI positive were cardiomyocyte nuclei (n = 5, two independent runs from each donor, and the same 5 donors enrolled shown in Table S1). The left panel: immunostaining representative figure of cardiac nuclei, blue, DAPI; green, PCM1. The middle panel, quantitative analysis of the proportions of PCM1+ (cardiomyocyte) and PCM1- (non-cardiomyocyte) nuclei. The right panel, flow cytometry representative figure shows PCM1+ nuclei percentage (e) Cell-type-specific marker gene assessment, DCN for FB, PECAM1 for EC, MYH11 for SMC and PDGFRβ for pericyte. f The expression ratios of five major non-cardiomyocyte marker genes in different cells. g Fluorescence immunohistochemistry staining to validate the proportions of major heart cell populations: PCM1+ cardiomyocytes; DCN+ FBs; PECAM+ECs; PDGFRB+ pericytes; CD45+ immune cells; and MYH11+ SMCs. h Quantitative analysis of the proportions of cells expressing marker genes by automatic imaging segmentation and quantitation. Ten sections from the ventricles of five hearts (two sections from each heart, 5 donors enrolled shown in Table S1) were measured. CM, cardiomyocyte; FB, fibroblast; Peri, pericyte; EC, endothelial cell; Neu, neurone; SMC, smooth muscle cell; endoEC, endocardial endothelial cell; DAPI, 4’,6-diamidino-2-phenylindole
Fig. 2
Fig. 2
Endothelial cell subpopulations and gene regulation analysis. a UMAP plot showing the five subclusters of ECs, including vascular ECs, endoECs, lymECs. Vascular ECs consist of artECs, capECs, and venECs. b Top TF and regulons expression in each vascular EC. Left panel: heatmap shows the relative expression of the top TF genes in each vascular EC subtype; right panel: heatmap shows the normalized activity of the top TF regulons in each vascular EC subtype predicted by pySCENIC. c The overlapping TFs in terms of the expression and predicted activity analysis in (b). Upper panel: Bar graph showing the top differentially expressed TFs in each vascular EC subtype; lower panel: Network representation of selected differentially expressed TFs among vascular EC subtypes, as analyzed by pySCENIC. d Enriched pathways associated with vascular EC subtype-specific TFs. These pathways indicate that subtype-specific TFs govern genes responsible for vascular functions. e The expression levels and target gene networks of representative novel TFs in artEC subtype (SOX5). f Enriched pathways of the targeted genes of these representative TFs (SOX5, SOX6, PPARG, ZBTB7C). g Validation of SOX5 expression in the bulk transcriptome dataset (GSE110209) of AMI murine model which includes remote zone and border zone at 3, 7, 14 dpi. h Immunostaining illustrates SOX5 (red) expression increased in endothelial cells (CD31, green) of border zone after acute myocardial infarction (AMI) in wild-type mice at 4, 7, 14 dpi. Scale bars, 20 μm. i Number of both SOX5 and CD31 positive cells in one high power field of border zone at 4, 7, 14 dpi. j Pearson correlation of SOX5 and the arteriole marker gene PCSK5 in the same dataset. EC, endothelial cell; endoEC, endocardial endothelial cell; lymEC, lymphatic endothelial cell; artEC, arteriole endothelial cell; capEC, capillary endothelial cell; venEC, venule endothelial cell; TF, transcription factor; AMI, acute myocardial infarction; dpi, day post-infarction; RZ, remote zone; BZ, border zone. Data are presented as mean ± SD
Fig. 3
Fig. 3
Smooth muscle cells and pericyte subpopulations and gene regulation analysis. a UMAP plot showing the three subclusters of SMC. b Top TF and regulons expression in each subcluster of SMC. Left panel: heatmap shows the relative expression of the top TF genes in each SMC subtype; right panel: heatmap shows the normalized activity of the top TF regulons in each SMC subtype predicted by pySCENIC. cd The overlap TFs (c) and their regulatory networks (d) in each SMC subtype. (e) UMAP plot showing the two subclusters of pericytes. (f) Top TF and regulons expression in each subcluster of pericyte. Left panel: heatmap shows the relative expression of the top TF genes in each pericyte subtype; right panel: heatmap shows the normalized activity of the top TF regulons in each pericyte subtype predicted by pySCENIC. g The overlap TFs and their regulatory networks in each pericyte subtype. h, i Targeted genes of the TF GLIS3 (h) and the enriched pathways of those target genes (i). j Validation of GLIS3 expression in the transcriptome dataset of acute myocardial infarction murine model (GSE110209) which includes remote zone and border zone bulk RNA-seq data at 3, 7,14 dpi. k Immunostaining illustrates GLIS3 (red) expression increased in pericytes (ABCC9, green) after AMI in wild type mice at 7 dpi and 14 dpi (left panel); number of both SOX5 and CD31 positive cells in one high power field of border zone at 4, 7, 14 dpi (right panel). Scale bars, 20 μm. SMC, smooth muscle cell; avg_log2FC, average log2 fold change; TF, transcription factor; artPeri, arteriole pericyte; capPeri, capillary pericyte; AMI, acute myocardial infarction; dpi, day post-infarction; RZ, remote zone; BZ, border zone. Data are presented as mean ± SD
Fig. 4
Fig. 4
Defining fibroblasts populations and cell transformation within the human heart. a UMAP plot showing the six subclusters of fibroblasts. b Dot plot showing the representative marker genes of each subtype of fibroblasts. c Left panel: heatmap shows the relative expression of the top transcription factor (TF) genes in each fibroblast subtype; right panel: heatmap shows the normalized activity of the top TF regulons in each fibroblast subtype predicted by pySCENIC. d, e Pseudotime analysis of fibroblasts (d) and analysis coloured by fibroblast subtypes (e). f Heatmap showing the gene expression pattern along two different trajectories (from MSC-like FB to adventitial FBs and from MSC-like FB to activated FBs), accompanied by representative TF and non-TF genes and enriched pathways in different modules. g Gene expression patterns of MEOX1 and PKNOX2 along trajectories associated with fibrogenesis (high expression in activated FBs). h Targeted genes of the TFs MEOX1 and PKNOX2 predicted by SCENIC. The degree of correlations of TF and targeted genes are represented by the size of the circle, red means positive correlation and green means negative correlation. i Enriched pathways of genes related to representative TFs in the activated FB subpopulation. j Expression levels of MEOX1 and PKNOX2 in explanted human hearts with heart failure (HF, n = 52) and controls (n = 15) (data from GSE145154). FB, fibroblast; MSC, mesenchymal stem cell; TF, transcription factor; HF, heart failure; ns: not significant. Data are presented as mean ± SD
Fig. 5
Fig. 5
Alterative expression of PKNOX2 during fibroblasts remodelling trajectory within the failing human heart. a snRNA-seq workflow of healthy (n = 3) and transplanted human hearts (n = 3) with dilated cardiomyopathy (DCM) using the 10X Genomic platform. b UMAP plot showing the 8 subclusters of fibroblasts. c Pseudo-time analysis of fibroblasts by monocole 3. d The trajectories of fibroblasts were mainly divided into two branches. e The average expression levels of gene involved in collagen fibril organization indicated branch 1 as a representative fibrosis formation path. f The gene expression of POSTN, PKNOX2, and MEOX1 along the trajectory branch 1 of fibroblasts from basal state to fibroblast activation then to fibrosis. g MEOX1 and PKNOX2 expression correlation with selected fibrosis marker genes, MEOX1 was linearly correlated with fibrotic genes, while PKNOX2 was nonlinearly correlated with fibrotic genes. h Immunofluorescence of PKNOX2 expression in left ventricle from healthy hearts, right ventricular (RV) and left ventricular (LV) of DCM hearts. Yellow arrows indicate PKNOX2 expressed in fibroblast which identified by mesenchymal marker Vimentin. i Co-localization of PKNOX2 and POSTN in left ventricle from healthy n = 5, RV of DCM (n = 5), and LV of DCM hearts (n = 4). Yellow arrows indicate PKNOX2 positive. The below figures are ×10 magnification of the region of interest in the above figures. j Average fluorescence intensity of POSTN in these three groups (left panel). Number of both PKNOX2 and POSTN positive cells in one high power field among three groups (right panel). A.U.: Arbitrary Unit. DCM, dilated cardiomyopathy; RV, right ventricular; LV, left ventricular; DAPI, 4’,6-diamidino-2-phenylindole. Data are represented as mean ± SD. ****P < 0.0001
Fig. 6
Fig. 6
In vitro knockdown of Pknox2 promotes the activation of adult mouse cardiac fibroblasts. a Schematic diagram showing the experimental procedure of Pknox2 knockdown and TGFβ stimulation in adult mouse cardiac fibroblast (AMCF). Three independent experiments were performed for each group. Adult mouse ventricular cardiac fibroblasts with SV40 were used. b Principal component analysis of expression profile of AMCF with Pknox2-siRNA and scrambled siRNA (n = 3 per group). (c-d) Volcano plot of differential expressed genes (DEGs) (c) and heatmap of top DEGs (d) from AMCF with Pknox2-siRNA versus scrambled siRNA. e Dot plot showing the functional enrichment of the up-regulated genes in Pknox2-siRNA versus scrambled siRNA. The enrichment significant threshold was set to an adjusted P-value < 0.05. f, g Representative western blots (f) and statistical analysis (g) of PKNOX2, α-SMA, p-SMAD2, and SMAD2 protein expression in AMCFs isolated from wild-type adult mice with siPknox2 and control siRNA transfected (n = 3). h Knockdown of Pknox2 in AMCF and stimulated by rmTGF-β, the genes related to fibrosis were detected by RT-qPCR (n = 3 per group). i, j Knockdown of Pknox2 in adult mouse cardiac fibroblast (i) and knockdown of PKNOX2 in human cardiac fibroblast (j) and then stimulated by rmTGF-β, α-SMA expression was detected by immunofluorescence (green, α-SMA; blue, DAPI). TGFβ, transforming growth factor-beta; rmTGFβ, recombinant mouse transforming growth factor-beta; qPCR, quantitative Polymerase Chain Reaction; IF, immunofluorescence; PC, principal component; Unstim, un-stimulate; ns, not significant; A.U., Arbitrary Unit; DAPI, 4′,6-diamidino-2-phenylindole. Data are represented as mean ± SD. **P < 0.01, ***P < 0.001
Fig. 7
Fig. 7
In vitro overexpression of Pknox2 inhibits adult mouse cardiac fibroblasts activation. a Schematic diagram showing the experimental procedure of Pknox2 overexpression and TGFβ stimulation in adult mouse cardiac fibroblast (AMCF). (n = 3 for each group). b Principal component analysis of expression profile of AMCF with Pknox2-siRNA and scrambled siRNA (n = 3 per group). c, d Volcano plot of DEGs (c) and heatmap of top DEGs (d) from AMCF with Adv-Pknox2 versus Adv-Control. e, f Dot plot showing the functional enrichment of the down-regulated genes (e) and up-regulated genes (f) in Adv-Pknox2 versus Adv-Control. The enrichment significant threshold was set to an adjusted P-value < 0.05. g, h Representative western blots (g) and statistical analysis (h) of, α-SMA, p-SMAD2 and SMAD2 protein expression in AMCFs isolated from wild-type adult mice with Adv-Pknox2 versus Adv-Control (n = 3). i Overexpression of Pknox2 in AMCF and then stimulated by TGF-β, the genes related to fibrosis were detected by RT-qPCR (n = 3 per group). j Overexpression of Pknox2 in AMCF then stimulated by TGF-β, Col1a1 expression was detected by immunofluorescence (green, Col1a1; blue, DAPI). TGFβ, transforming growth factor-beta; rmTGFβ, recombinant mouse transforming growth factor-beta; qPCR, quantitative Polymerase Chain Reaction; IF, immunofluorescence; PC, principal component; Unstim, un-stimulate; ns: not significant, A.U.: Arbitrary Unit, DAPI, 4′,6-diamidino-2-phenylindole. Data are represented as mean ± SD. *P < 0.05, **P < 0.01, ***P < 0.001
Fig. 8
Fig. 8
Pknox2 knockout exacerbates transverse aortic constriction (TAC)–induced cardiac fibrosis in mouse hearts. a Experiment design. b PKNOX2 expression level in the heart of WT and PKNOX2-CKO (n = 4 per group) mice is measured by real-time qPCR. c Heart weight (HW)/body weight (BW) ratios in WT TAC and PKNOX2-CKO mice at 4 weeks after TAC surgery (n = 7 per group). d, e Assessments of echocardiographic parameters of left ventricular ejection fraction (LVEF%), fraction shortening (FS%), cardiac output (CO ml/min), left ventricular end-systolic internal diameter (LVID;s), and left ventricular end-diastolic internal diameter (LVID;d) in PKNOX2-CKO and WT mice at 4 weeks after TAC surgery (n = 6 per group). f Representative images of Masson staining of LV cross-sections in the hearts of PKNOX2-CKO and WT mice at 4 weeks after 4 surgery (n = 5 per group). Scale bar, 100 μm. Quantitative results of LV interstitial collagen volume from the indicated groups (n = 5 per group). g Representative western blots and statistical analysis of α-SMA protein expression in the hearts of PKNOX2-CKO and WT mice at 4 weeks after TAC surgery (n = 3 per group). h, i Relative mRNA levels of fibrosis and heart failure marker genes in heart tissues from the indicated mice (n = 4 per group). All data are presented as mean ± SD. For statistics, one-way ANOVA with Bonferroni post hoc analysis was used. **P < 0.01, ***P < 0.001, ****P < 0.0001
Fig. 9
Fig. 9
Specific overexpression of Pknox2 inhibits transverse aortic constriction (TAC)–induced cardiac fibrosis in mouse hearts. a The timeline of the experimental procedure in adult mice. b Heart weight (HW)/body weight (BW) ratios in adeno-associated virus serotype 9 (AAV9)-GFP (green fluorescent protein) and AAV9-Pknox2 mice at 4 weeks after sham or TAC surgery (n = 16, 10, 12). cg Assessments of echocardiographic parameters of ejection fraction (EF%), fraction shortening (FS%), left ventricular end-systolic internal diameter (LVIDs), and left ventricular end-diastolic internal diameter (LVIDd) in AAV9-Periostin-GFP and AAV9-Postn-Pknox2-GFP mice at 8 weeks after sham or TAC surgery (n = 16, 10, 12). h Representative images of Masson staining of LV cross-sections in the hearts of AAV9-Periostin-GFP and AAV9-Postn-Pknox2-GFP mice at 8 weeks after sham or TAC surgery (n = 6 per group). Scale bar, 200 μm. i Quantitative results of LV interstitial collagen volume from the indicated groups (n = 6 per group). j Relative mRNA levels of fibrosis and heart failure marker genes in heart tissues from the indicated mice (n = 4). All data are presented as mean ± SD. For statistics, one-way ANOVA with Bonferroni post hoc analysis was used. **P < 0.01, ***P < 0.001, ****P < 0.0001
Fig. 10
Fig. 10
Research scheme. The workflow of the whole study. We developed a new tissue processing and single-nucleus transcriptomic profiling pipeline that improved the detection of more TFs and genes in single-nucleus RNA sequencing. With this optimized protocol, we compared the cellular composition and transcriptional regulation networks of healthy hearts and failing heart, in which we identified PKNOX2 as an essential inhibitory regulator in myocardial fibrosis remodelling. In vitro and in vivo experiments further confirm our conclusion. sn, single nucleus; sc, single cell; TF, transcription factor; DCM, dilated cardiomyopathy; Adv, adenovirus. This figure was created with BioRender.com

References

    1. Murray CJ, Lopez AD. Measuring the global burden of disease. N. Engl. J. Med. 2013;369:448–457. doi: 10.1056/NEJMra1201534. - DOI - PubMed
    1. GBD 2016 Causes of Death Collaborators. Global, regional, and national age-sex specific mortality for 264 causes of death, 1980-2016: a systematic analysis for the Global Burden of Disease Study 2016. Lancet. 2017;390:1151–1210. doi: 10.1016/S0140-6736(17)32152-9. - DOI - PMC - PubMed
    1. Roth GA, et al. Demographic and epidemiologic drivers of global cardiovascular mortality. N. Engl. J. Med. 2015;372:1333–1341. doi: 10.1056/NEJMoa1406656. - DOI - PMC - PubMed
    1. Pinto AR, et al. Revisiting cardiac cellular composition. Circ. Res. 2016;118:400–409. doi: 10.1161/CIRCRESAHA.115.307778. - DOI - PMC - PubMed
    1. Litvinukova M, et al. Cells of the adult human heart. Nature. 2020;588:466–472. doi: 10.1038/s41586-020-2797-4. - DOI - PMC - PubMed

Publication types