. 2024 Sep;48(5):901-914.
doi: 10.4093/dmj.2023.0368. Epub 2024 Apr 22.

DGAT2 Plays a Crucial Role to Control ESRRA-PROX1 Transcriptional Network to Maintain Hepatic Mitochondrial Sustainability

Affiliations

DGAT2 Plays a Crucial Role to Control ESRRA-PROX1 Transcriptional Network to Maintain Hepatic Mitochondrial Sustainability

Yoseob Lee et al. Diabetes Metab J. 2024 Sep.

Abstract

Backgruound: Diacylglycerol O-acyltransferase 2 (DGAT2) synthesizes triacylglycerol (TG) from diacylglycerol; therefore, DGAT2 is considered as a therapeutic target for steatosis. However, the consequence of inhibiting DGAT2 is not fully investigated due to side effects including lethality and lipotoxicity. In this article, we observed the role of DGAT2 in hepatocarcinoma.

Methods: The role of DGAT2 is analyzed via loss-of-function assay. DGAT2 knockdown (KD) and inhibitor treatment on HepG2 cell line was analyzed. Cumulative analysis of cell metabolism with bioinformatic data were assessed, and further compared with different cohorts of liver cancer patients and non-alcoholic fatty liver disease (NAFLD) patients to elucidate how DGAT2 is regulating cancer metabolism.

Results: Mitochondrial function is suppressed in DGAT2 KD HepG2 cell along with the decreased lipid droplets. In the aspect of the cancer, DGAT2 KD upregulates cell proliferation. Analyzing transcriptome of NAFLD and hepatocellular carcinoma (HCC) patients highlights negatively correlating expression patterns of 73 lipid-associated genes including DGAT2. Cancer patients with the lower DGAT2 expression face lower survival rate. DGAT2 KD cell and patients' transcriptome show downregulation in estrogen- related receptor alpha (ESRRA) via integrated system for motif activity response analysis (ISMARA), with increased dimerization with corepressor prospero homeobox 1 (PROX1).

Conclusion: DGAT2 sustains the stability of mitochondria in hepatoma via suppressing ESRRA-PROX1 transcriptional network and hinders HCC from shifting towards glycolytic metabolism, which lowers cell proliferation.

Keywords: Carcinoma, hepatocellular; Diacylglycerol O-acyltransferase; Mitochondria; Non-alcoholic fatty liver disease.


Conflict of interest statement

CONFLICTS OF INTEREST

No potential conflict of interest relevant to this article was reported.

Figures

Fig. 1.
Fig. 1.
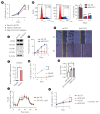
Downregulation of diacylglycerol O-acyltransferase 2 (DGAT2) in HepG2 mitigates mitochondrial function. (A) Oleic acid and palmitic acids are treated for 200 μM each, 4 hours incubated in HepG2 models. (B) Intensity of BODIPY 493/503 staining of lipid droplets, normalized with 4΄,6-diamidino-2-phenylindole (DAPI), exhibits suppressed lipid synthesis via DGAT2 inhibition. (C) Mitochondrial transmission electron microscopy photo (×10,000) and mitotracker staining for mitochondrial morphology detection. (D) Quantified mitochondrial area based on a cytosol area. (E) Distribution of mitochondrial length across the cytosol. (F) Tetramethylrhodamine, ethyl ester (TMRE) intensity indicates the membrane potential of mitochondria. (G) Mitochondrial DNA relative to the reference DNA indicates decreased in DGAT2 knockdown HepG2. (H) Western blot data of fission- related proteins. (I) Oxygen consumption rate (OCR) rate of HepG2 cell line after DGAT2 suppression. (J) OCR changes after carnitine palmitoyl transferase I (CPT1) inhibition via etomoxir. (K) Cellular adenosine triphosphate level. Data represent mean±standard deviation. OAPA, oleic acid and palimatic acid; shDGAT2, DGAT2 shRNA; shCTR, control shRNA; FIS1, fission, mitochondrial 1; pDRP S637, phosphorylayion status of Ser-637 of dynamin-related protein 1; MFN1, mitofusin 1; NS, not significant. aP<0.05, bP<0.01, cP<0.001, dP<0.0001; two-tailed Student’s t-test.
Fig. 2.
Fig. 2.
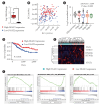
Lipid accumulation drops dramatically in hepatocellular carcinoma (HCC) compares to non-alcoholic fatty liver disease (NAFLD) including downregulation of diacylglycerol O-acyltransferase 2 (DGAT2). (A) Vann diagram of differentially expressed genes (DEGs) of NAFLD and HCC patients compare to the normal. Highlights four groups of DEGs. (B) Enrichment scores based on Kyoto Encyclopedia of Genes and Genomes (KEGG) gene set were calculated based on false discovery rate. Lipid-related pathways were only present in the group 0f 805 genes, which upregulated in NAFLD patients and downregulated in HCC patients. (C) Lipid-related genes categorizes HCC patients in to three groups according to the spearman correlation. (D) Principal component analysis distinctly divides group 1 and group 3. (E) Overall survival rate is drawn via Kaplan-Meier plot. Group 3 exhibits lower survival rate than that of group 1. (F) Normalized expression level of DGAT2 is assessed from spatial data of steatosis and HCC patients, which increases in steatosis but decreases in HCC patients. (G) Spatial data compares expression of DGAT2 to liver histology images. Arrows indicate that DGAT2 expression is increased in ectopic fat regions. (H) Expression level of DGAT2 increases in NAFLD while decreases in HCC, and further decreases in group 3. (I) Downregulated DEGs from DGAT2 suppression models correlates with the downregulated pathways in HCC patients only when DEGs are related with mitochondria. Data represent mean±standard deviation. P value for Kaplan-Meier plot is calculated via log rank test. TCGA, The Cancer Genome Atlas; LIHC, Liver Hepatocellular Carcinoma; FA, fatty acid; PC, principle component; NS, not significant; shDGAT2, DGAT2 shRNA. aP<0.05, bP<0.001, cP<0.0001; two-tailed Mann-Whitney U test.
Fig. 3.
Fig. 3.
Diacylglycerol O-acyltransferase 2 (DGAT2) low expressing patients has lower survival rates with mitochondrial dysfunctions. (A) DGAT2 expression level of high DGAT2 expressing group (n=100) and low DGAT2 expressing group (n=100). (B) DGAT2 expression level according to the stage of hepatocellular carcinoma (HCC) patients with non-parametric one-way analysis of variance (ANOVA) test. (C) Principal component analysis of high and low DGAT2 expressing group. (D) Overall survival rate of high and low DGAT2 expressing group. (E) Heatmap of mitochondrial dynamic related genes. (F) Gene set enrichment of HCC patients, high DGAT2 expressing patients versus low DGAT2 expressing patients. Data represent mean±standard deviation. P value for Kaplan-Meier plot is calculated via log rank test. Significance of Gene Set Enrichment Analysis (GSEA) data is analyzed with false discovery rate calculations. PC, principle component; VAT1, vesicle amine transporter 1; COX10, cytochrome c oxidase assembly factor heme A:farnesyltransferase COX10; DNM1L, dynamin 1 like; HUWE1, HECT, UBA and WWE domain containing E3 ubiquitin protein ligase 1; STAT2, signal transducer and activator of transcription 2; KEGG, Kyoto Encyclopedia of Genes and Genomes. aP<0.0001; two-tailed Mann-Whitney U test.
Fig. 4.
Fig. 4.
Mitochondrial dysfunction and upregulated glycolysis promote cell proliferation. (A) HepG2 cell proliferation after diacylglycerol O-acyltransferase 2 (DGAT2) suppression. (B) Cell cycle of DGAT2 knockdown (KD) cell. (C) Western blot data of cell cycle regulating proteins. (D) Graph of HepG2 wound closure shows migration ability of DGAT2 KD HepG2 cell line. (E) Microscopic image of HepG2 wound healing assay. (F) Cellular lactate level after DGAT2 inhibition. (G) Extracellular acidification rate (ECAR) after DGAT2 inhibitor treatments. (H) DGAT2 expression level of different hepatocellular carcinoma cell lines; HepG3; Hep3B. (I) Cell proliferation rate of Hep3B and HepG2. (J) Glycolysis inhibition inhibits cell proliferation of DGAT2 KD HepG2 cell only. Data represent mean±standard deviation. shCTR, control shRNA; shDGAT2, DGAT2 shRNA; PI_A, propidium iodide_area; CDK2, cyclin-dependent kinase 2; CCNA2, cyclin A2; CCNB1, cyclin B1; CCNE1, cyclin E1; 2-DG, 2-deoxy-D-glucose. aP<0.05, bP<0.01, cP<0.05, dP<0.0001; two-tailed Student’s t-test.
Fig. 5.
Fig. 5.
Estrogen-related receptor alpha (ESRRA) activity is decreases as diacylglycerol O-acyltransferase 2 (DGAT2) expression suppressed. (A) Top three motifs with similar activity trends with DGAT2 expression level. (B) ESRRA motif activity after DGAT2 suppression. (C) Luciferase activity of estrogen-related receptor response element (ERRE) firefly luciferase. (D) Cellular cholesterol level of DGAT2 knockdown (KD) HepG2. (E) Number of peaks on a transcription start site of genes with ERRE motifs. (F) Heatmap of genes with ERRE motifs. (G) Subcellular localization of proteins after DGAT2 KD. (H) Immunoprecipitation of anti-ESRRA. Data represent mean±standard deviation. PLAGL1, PLAG1 like zinc finger 1; NAFL, non-alcoholic fatty liver; NASH, nonalcoholic steatohepatitis; KLF16, KLF transcription factor 16; SP2, Sp2 transcription factor; shCTR, control shRNA; shDGAT2, DGAT2 shRNA; RLU, relative light unit; NS, not significant; PROX1, prospero homeobox 1; IgG, immunoglobulin G. aP<0.0001; two-tailed Student’s t-test.
Fig. 6.
Fig. 6.
Overexpression of estrogen-related receptor alpha (ESRRA) rescues mitochondria dysfunction. (A) Transmission electron microscopy of rescued HepG2 exhibits mitochondrial recovery. (B) Relative mitochondrial area after diacylglycerol O-acyltransferase 2 (DGAT2) and ESRRA overexpression. (C) Mitochondrial length after gene overexpression. (D) Tetramethyl rhodamine ethyl ester (TMRE) intensity of HepG2 recovers after ESRRA overexpression. (E) Oxygen consumption rate (OCR) of ESRRA overexpressed HepG2. (F) Cell proliferation is suppressed after ESRRA overexpression. Data represent mean±standard deviation. shCTR, control shRNA; shDGAT2, DGAT2 shRNA; OE, overexpression; NS, not significant. aP<0.04, bP<0.01, cP<0.001, dP< 0.0001; two-tailed Student’s t-test.
None

Similar articles

References

    1. Jin Y, McFie PJ, Banman SL, Brandt C, Stone SJ. Diacylglycerol acyltransferase-2 (DGAT2) and monoacylglycerol acyltransferase-2 (MGAT2) interact to promote triacylglycerol synthesis. J Biol Chem. 2014;289:28237–48. - PMC - PubMed
    1. Yenilmez B, Wetoska N, Kelly M, Echeverria D, Min K, Lifshitz L, et al. An RNAi therapeutic targeting hepatic DGAT2 in a genetically obese mouse model of nonalcoholic steatohepatitis. Mol Ther. 2022;30:1329–42. - PMC - PubMed
    1. Chitraju C, Walther TC, Farese RV., Jr The triglyceride synthesis enzymes DGAT1 and DGAT2 have distinct and overlapping functions in adipocytes. J Lipid Res. 2019;60:1112–20. - PMC - PubMed
    1. Calle RA, Amin NB, Carvajal-Gonzalez S, Ross TT, Bergman A, Aggarwal S, et al. ACC inhibitor alone or co-administered with a DGAT2 inhibitor in patients with non-alcoholic fatty liver disease: two parallel, placebo-controlled, randomized phase 2a trials. Nat Med. 2021;27:1836–48. - PubMed
    1. Singal AG, El-Serag HB. Rational HCC screening approaches for patients with NAFLD. J Hepatol. 2022;76:195–201. - PMC - PubMed

MeSH terms

Substances