. 2024 Mar 8;4(2):136-145.
doi: 10.1021/acsnanoscienceau.3c00060. eCollection 2024 Apr 17.

Single-Molecule Investigation of the Binding Interface Stability of SARS-CoV-2 Variants with ACE2

Affiliations

Single-Molecule Investigation of the Binding Interface Stability of SARS-CoV-2 Variants with ACE2

Ankita Ray et al. ACS Nanosci Au. .

Abstract

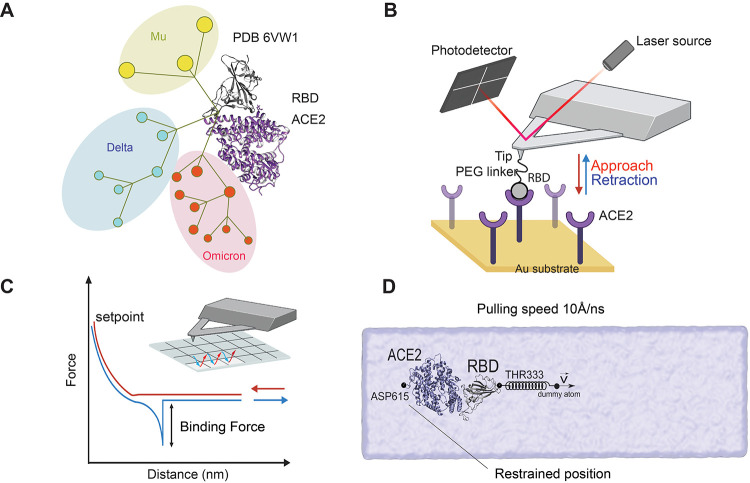
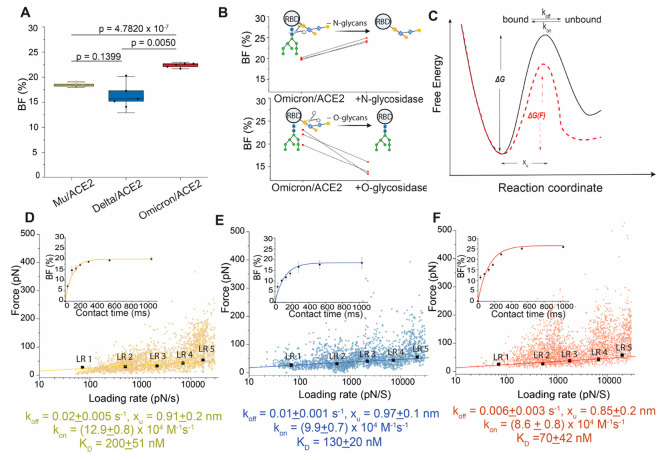
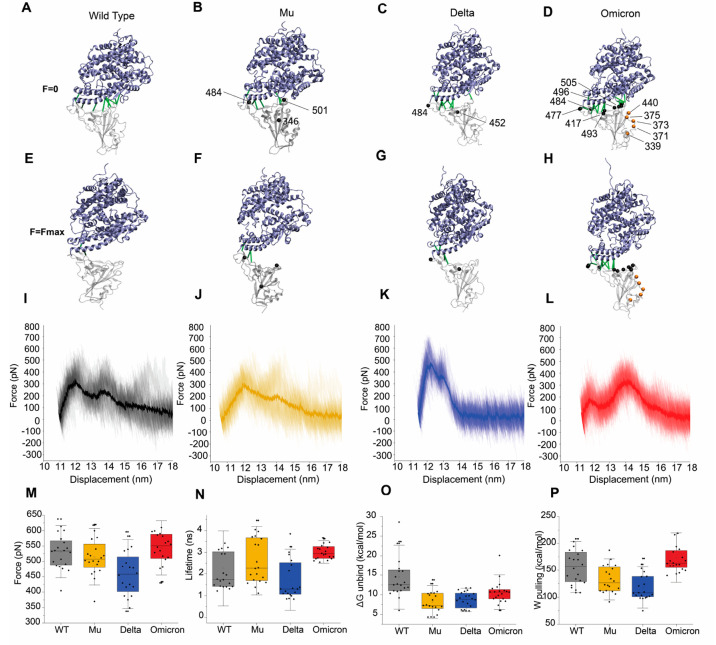
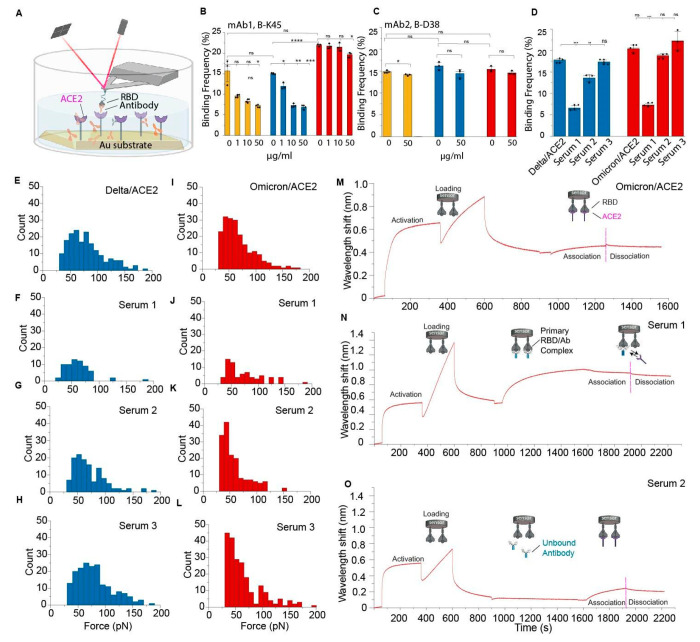
The SARS-CoV-2 pandemic spurred numerous research endeavors to comprehend the virus and mitigate its global severity. Understanding the binding interface between the virus and human receptors is pivotal to these efforts and paramount to curbing infection and transmission. Here we employ atomic force microscopy and steered molecular dynamics simulation to explore SARS-CoV-2 receptor binding domain (RBD) variants and angiotensin-converting enzyme 2 (ACE2), examining the impact of mutations at key residues upon binding affinity. Our results show that the Omicron and Delta variants possess strengthened binding affinity in comparison to the Mu variant. Further, using sera from individuals either vaccinated or with acquired immunity following Delta strain infection, we assess the impact of immunity upon variant RBD/ACE2 complex formation. Single-molecule force spectroscopy analysis suggests that vaccination before infection may provide stronger protection across variants. These results underscore the need to monitor antigenic changes in order to continue developing innovative and effective SARS-CoV-2 abrogation strategies.


Conflict of interest statement

The authors declare no competing financial interest.

Figures

Figure 1
Figure 1
Single-molecule investigation of SARS-CoV-2 variants using AFM and SMD simulation. (A) Phylogenetic tree of SARS-CoV-2 showing the emergence of the variants of concern (VoCs) Omicron, Delta, and Mu. (B) Probing of RBD mutants binding to ACE2 receptors using atomic force microscopy (AFM). (C) AFM tip probes the interaction during the pixel-by-pixel scanning of the sample and extracts from each pixel a force–distance (FD) curve obtained by making cycles of approach and retraction. (D) All-atom steered molecular dynamics (SMD) simulation with the tethered ACE2 protein showing the effect of force pulling on the RBD protein. The complex is placed in a cubic solvent box containing 0.15 mol L–1 of NaCl molecules.
Figure 2
Figure 2
Probing the binding free-energy landscape of the RBD/ACE2 complexes by AFM. (A) Box-whiskers plot of the binding frequencies (BF) measured by AFM between the functionalized tip (RBD mutants) and the grafted ACE2 model surface. Each data point corresponds to a map of 1024 FD curves measured at an approach and retract speed of 1 μm/s and a dwell time of 250 ms. (B) Before-after plots of specific BFs showing the effect of deglycosylation after enzymatic treatment of the functionalized cantilever with N-glycosidase (top) and O-glycosidase (bottom), respectively. One data point belongs to the BF from one map acquired at 1 μm/s retraction speed. (C) Bell–Evans (BE) model describing a ligand–receptor bond as a simple two-state model. The bound state is separated from the unbound state by a single energy barrier located at distance xu. The rupture force required to break a noncovalent bond follows a probabilistic distribution related to the energy landscape of the bond, describing how the probability of bond rupture increases exponentially with applied force. Experimentally, koff can be estimated by probing the binding strength of a molecular complex under increasingly applied loads Lowering of the activation energy upon application of an external force (F > 0) is shown as red dotted lines. koff and kon represent the dissociation and association rate, respectively. (D–F) Dynamic force spectroscopy (DFS) plot showing the force extracted from individual FD curves (colored dots) as well as the mean rupture forces, determined at various loading rate (LR) ranges measured either between ACE2 receptor and Mu-RBD (D, N = 2785 data points), Delta-RBD (E, N = 2411 data points), and Omicron-RBD (F, N = 2698 data points). Data corresponding to single interactions were fitted with the BE model (straight line), providing average koff and xu values. Plots in the inset: BF (expressed in percentage) plotted as a function of the contact time.
Figure 3
Figure 3
SMD simulation of the RBD/ACE2 complex for WT and three main SARS-CoV-2 variants. Panels showing the ribbon-like representation of the protein complex for WT (A), Mu (B), Delta (C), and Omicron (D). For each variant, the position of the mutated residue is indicated by a solid line. In the case of Omicron, the mutations at the RBD/ACE2 interface are highlighted by black beads and the remaining mutations, which are associated with immune evasion, are shown by orange beads. In addition, we display the interface contacts (green solid line) which are responsible for the mechanical stability and offer a resistance to the detachment of the RBD from the tethered ACE2. (E–H) Snapshots at Fmax in SMD simulations for the WT (E) and the three variants (F–H). Solid green lines represent those contacts still present 50 ps after reaching Fmax. (I–L) Cumulative force–displacement graphs for all 20 trajectories of WT, Mu, Delta, and Omicron, respectively. The bold line represents the statistical mean of 20 trajectories. The initial distance value corresponds to the distance between ASP615 and THR333 in ACE2 and RBD, respectively, after the MD equilibration step. (M) External forces (pN) required for the mechanical dissociation of the RBD/ACE2 interface. (N) Lifetime shows the duration of time (in ns) the protein complex remains bound before reaching Fmax. (O) The unbinding free energy (ΔGunbind) is computed by the Jarzynski equality for each system. (P) Work done (Wpulling) in pulling apart the VoCs from the ACE2 receptor. Data is representative of 20 trajectories and shown as box-whisker plots, wherein each data point belongs to a single trajectory. The square in the box represents the mean, the min/max of the box the 25th and 75th percentiles, respectively, and the whiskers represent the s.d. of the mean value. Middle panels display the RMSD for all cases.
Figure 4
Figure 4
Blocking by monoclonal antibodies (mAbs) and sera from convalescent patients to probe neutralization potential. (A) AFM setup to measure BF of the interaction between ACE2 and the RBD mutants. (B, C) Graph showing blocking potential of mAb 1 and 2 against RBD. Binding frequencies were estimated before and after incubation with mAbs at increasing concentration (1–50 μg mL–1 in PBS). Data are representative of at least 3 independent experiments (tips and sample) per mAb concentration. P-values were determined by two-sample t test in Origin. The error bars indicate SD of the mean value. (D) Graph showing blocking in the presence of Sera 1–2 obtained from convalescent patients and Sera 3 obtained from nonvaccinated and noninfected individual. (E–L) Histogram showing distribution of rupture forces for Delta/ACE2 (in blue) and Omicron/ACE2 (in red) interaction in the presence of Sera 1–3. (N = 1024 data points were used to construct each histogram). (M–O) Complete biolayer interferometry (BLI) sensograms highlighting the association and dissociation regime of the Omicron/ACE2 complex in the absence of any sera (M) in the presence of Serum 1 (N) and Serum 2 (O). Experiments in the presence of Sera 1 and 2 were performed after diluting them 1:1000 v/v with 0.1% BSA in PBS.

Similar articles

Cited by

References

    1. Shang J.; Ye G.; Shi K.; Wan Y.; Luo C.; Aihara H.; Geng Q.; Auerbach A.; Li F. Structural Basis of Receptor Recognition by SARS-CoV-2. Nature 2020, 581 (7807), 221–224. 10.1038/s41586-020-2179-y. - DOI - PMC - PubMed
    1. Callaway E. The Coronavirus Is Mutating - Does It Matter?. Nature 2020, 585 (7824), 174–177. 10.1038/d41586-020-02544-6. - DOI - PubMed
    1. Ray D.; Quijano R. N.; Andricioaei I. Point Mutations in SARS-CoV-2 Variants Induce Long-Range Dynamical Perturbations in Neutralizing Antibodies. Chem. Sci. 2022, 13 (24), 7224–7239. 10.1039/D2SC00534D. - DOI - PMC - PubMed
    1. Lan J.; Ge J.; Yu J.; Shan S.; Zhou H.; Fan S.; Zhang Q.; Shi X.; Wang Q.; Zhang L.; Wang X. Structure of the SARS-CoV-2 Spike Receptor-Binding Domain Bound to the ACE2 Receptor. Nature 2020, 581 (7807), 215–220. 10.1038/s41586-020-2180-5. - DOI - PubMed
    1. Harvey W. T.; Carabelli A. M.; Jackson B.; Gupta R. K.; Thomson E. C.; Harrison E. M.; Ludden C.; Reeve R.; Rambaut A.; Peacock S. J.; Robertson D. L. SARS-CoV-2 Variants, Spike Mutations and Immune Escape. Nat. Rev. Microbiol. 2021, 19 (7), 409–424. 10.1038/s41579-021-00573-0. - DOI - PMC - PubMed