. 2024 Mar 26;8(5):ziae041.
doi: 10.1093/jbmrpl/ziae041. eCollection 2024 May.

Estradiol induces bone osteolysis in triple-negative breast cancer via its membrane-associated receptor ERα36

Affiliations

Estradiol induces bone osteolysis in triple-negative breast cancer via its membrane-associated receptor ERα36

D Joshua Cohen et al. JBMR Plus. .

Abstract

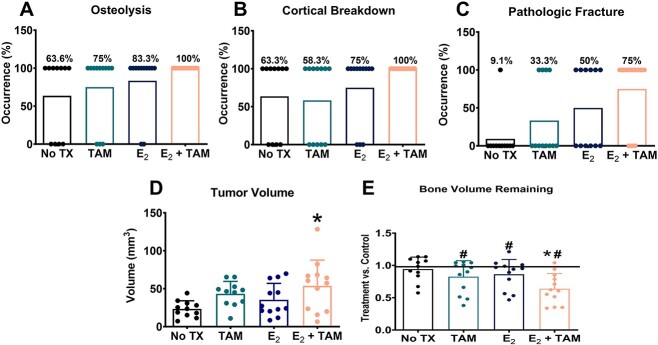
Triple-negative breast cancer (TNBC) is thought to be an estradiol-independent, hormone therapy-resistant cancer because of lack of estrogen receptor alpha 66 (ERα66). We identified a membrane-bound splice variant, ERα36, in TNBC cells that responds to estrogen (E2) and may contribute to bone osteolysis. We demonstrated that the MDA-MB-231 TNBC cell line, which expresses ERα36 similarly to MCF7 cells, is responsive to E2, forming osteolytic tumors in vivo. MDA-MB-231 cells activate osteoclasts in a paracrine manner. Conditioned media (CM) from MDA-MB-231 cells treated with bovine serum albumin-bound E2 (E2-BSA) increased activation of human osteoclast precursor cells; this was blocked by addition of anti-ERα36 antibody to the MDA-MB-231 cultures. Osteoclast activation and bone resorption genes were elevated in RAW 264.7 murine macrophages following treatment with E2-BSA-stimulated MDA-MB-231 CM. E2 and E2-BSA increased phospholipase C (PLC) and protein kinase C (PKC) activity in MDA-MB-231 cells. To examine the role of ERα36 signaling in bone osteolysis in TNBC, we used our bone-cancer interface mouse model in female athymic homozygous Foxn1nu mice. Mice with MDA-MB-231 tumors and treated with tamoxifen (TAM), E2, or TAM/E2 exhibited increased osteolysis, cortical bone breakdown, pathologic fracture, and tumor volume; the combined E2/TAM group also had reduced bone volume. These results suggest that E2 increased osteolytic lesions in TNBC through a membrane-mediated PLC/PKC pathway involving ERα36, which was enhanced by TAM, demonstrating the role of ERα36 and its membrane-associated signaling pathway in bone tumors. This work suggests that ERα36 may be a potential therapeutic target in patients with TNBC.

Keywords: ERα36; SERMs; bone resorption; bone–tumor interface; cross-talk; estrogen; osteoclasts; osteolysis; tumor–induced bone disease.


Conflict of interest statement

None declared.

Figures

Graphical Abstract
Graphical Abstract
Figure 1
Figure 1
The expression and protein levels of ERs of MCF7 and MDA-MB-231. Baseline protein levels of ERα66, ERα46, and ERα36 in MDA-MB-231 cells assessed by western blot using GAPDH as the loading control (A). RNA expression levels of ERα66, ERα66/46, and ERα36 were measured by qPCR (B). Primers for ERα66 amplified exon 1 of the ESR1 gene, whereas the ERα66/46 and ERα36 primers amplified exons 7/8 and 9, respectively. Gene expression was normalized to GAPDH expression. Western blot analysis of ERβ and G–protein–coupled receptor 30 (GPR30) relative to GAPDH (C). Gene expression analysis of ESR2 (ERβ) and GPR30 (D). Data are presented as the mean ± standard deviation of n = 6 per cell type. Western blot image is a representative image of n = 3 per cell type. Groups labeled with and asterisk are statistically different compared with MCF7 receptor expression with P values ≤ .05 considered significant by one–way ANOVA with a Bonferroni posttest or a Student’s t-test. Data shown are representative of two independent studies.
Figure 2
Figure 2
The effects of estrogen in ovariectomized mice. Representative 3D microCT (A) and 3D microCT (B) images of femurs from sham ovariectomized mice (n = 7) implanted with MDA-MB-231 cells into the bone marrow cavity. Representative 3D microCT (C) and 2D microCT (D) images of femurs from ovariectomized mice (n = 8) implanted with MDA-MB-231 cells. Representative 3D microCT (E) and 2D (F) images of femurs from ovariectomized mice exposed to estradiol treatment (n = 8). Representative hematoxylin and eosin–stained image of a femur from an ovariectomized mouse. Circle indicates osteolytic tumor resorbing cortical bone (G). Scale bar indicates 1 mm.
Figure 3
Figure 3
MicroCT analysis in ovariectomized and sham mice. Percent occurrence of osteolysis (A), breakdown of cortical bone (B), and pathological fracture (C) observed in sham (n = 7), OVX (n = 8), and OVX+ E2 (n = 8). Tumor volume comparing sham, ovariectomized, and ovariectomized mice exposed to estradiol (D). Groups not sharing a letter are statistically significant by one–way ANOVA with P values ≤ .05 considered significant. Bone volume remaining of treatment leg versus contralateral/control leg (E). Groups labeled with “#” are statistically significant compared with their respective control leg by Wilcoxon paired t-test with P values ≤ .05 considered significant. Groups labeled with an “@” are statistically significant by one–way ANOVA with a Bonferroni posttest and P values ≤ .05 considered significant.
Figure 4
Figure 4
Estrogen increased cancer cell–induced osteoclast activation. Measurement of osteoclast activation assessed as collagen degradation by human osteoclast precursor cells after treatment with ERα36 antibody and E2 conjugated to BSA. Groups labeled with an asterisk are statistically significant compared with no treatment control at P < .05 by one–way ANOVA, whereas groups labeled with “#” are statistically significant compared with their respective E2-BSA treatment (A). RAW264.7 cell mRNA expression of CLCN7, CTSK, and TRAP (B) and NFATc1 (C) after treatment with MDA-MB-231 cell CM for 48 h. Groups labeled with “$” are statistically significant compared with control with P values ≤ .05 considered significant by Student’s t-test. Protein levels of OPG, RANKL, OPG/RANKL ratio (D), and IL-6 (E) secreted by MDA-MB-231 cells after E2-BSA. Groups labeled with an asterisk are statistically significant with P values ≤ .05 considered significant compared with control by one–way ANOVA with a Bonferroni posttest. Groups labeled with a “&” are statistically significant with P values ≤ .05 considered significant compared with the 10-8 M group by one–way ANOVA with a Bonferroni posttest data shown are representative of two independent studies.
Figure 5
Figure 5
Estrogen regulates cancer cell proliferation and apoptosis involving PLC and PKC signaling pathways. MDA-MB-231 cells treated with vehicle, 10-8 M E2, or 10-7 M E2 and evaluated for proliferation via EdU assay (A), and apoptosis via p53 (B) or TUNEL (C). PLC activity (D) and PKC activity (E) after treatment with E2. PLC activity (F) and PKC activity (G) after treatment with E2-BSA. Groups labeled with an asterisk are statistically significant compared with vehicle with P values ≤ .05 considered significant by one–way ANOVA with a Bonferroni posttest. Groups labeled with a “&” are statistically significant compared with the 10-8 M group with P values ≤ .05 considered significant by one–way ANOVA with a Bonferroni posttest. Data shown are representative of two independent studies.
Figure 6
Figure 6
The effect of TAM and estrogen on osteolysis. Representative 3D (left) microCT images, 2D (right) microCT images, and hematoxylin and eosin stain image of femurs from non–treated mice (n = 11) (A). Representative 3D (left) microCT images, 2D (right) microCT images, and hematoxylin and eosin stain image of femurs from TAM treated mice (n = 12) (B). Representative 3D (left) microCT images, 2D (right) microCT images, and hematoxylin and eosin stain image of femurs from estrogen treated mice (n = 12) (C). Representative 3D (left) microCT images, 2D (right) microCT images, and hematoxylin and eosin stain image of femurs from the combine estrogen and TAM treated mice (n = 12) (D). Scale bar indicates 1 mm.
Figure 7
Figure 7
TAM combined with estrogen increase osteolysis. MicroCT analysis. Percent occurrence of osteolysis (A), breakdown of cortical bone (B), and pathological fracture (C) observed in no treatment (n = 11), TAM (n = 12), estradiol (E2) (n = 12), and the combination of estradiol and TAM (E2 + TAM). Tumor volume comparing no treatment, TAM, estradiol, and the combination of estradiol and TAM (D). Groups not sharing a letter are statistically significant by one–way ANOVA with P values ≤ .05 considered significant. Bone volume remaining of treatment leg versus contralateral/control leg (E). Groups labeled with “#” are statistically significant compared with their respective control leg by Wilcoxon paired t-test with P values ≤ .05 considered significant. Groups labeled with an asterisk are statistically significant compared with No treatment by one–way ANOVA with P values ≤ .05 considered significant.

References

    1. Siegel RL, Miller KD, Fuchs HE, Jemal A. Cancer statistics, 2022. CA Cancer J Clin. 2022;72(1):7–33. 10.3322/caac.21708 - DOI - PubMed
    1. Howard FM, Olopade OI. Epidemiology of triple-negative breast cancer: a review. Cancer J. 2021;27(1):8–16. 10.1097/PPO.0000000000000500 - DOI - PubMed
    1. Pulido C, Vendrell I, Ferreira AR, et al. . Bone metastasis risk factors in breast cancer. Ecancermedicalscience. 2017;11:715. 10.3332/ecancer.2017.715 - DOI - PMC - PubMed
    1. Coleman RE, Smith P, Rubens RD. Clinical course and prognostic factors following bone recurrence from breast cancer. Br J Cancer. 1998;77(2):336–340. 10.1038/bjc.1998.52 - DOI - PMC - PubMed
    1. Cetin K, Christiansen CF, Sværke C, Jacobsen JB, Sørensen HT. Survival in patients with breast cancer with bone metastasis: a Danish population-based cohort study on the prognostic impact of initial stage of disease at breast cancer diagnosis and length of the bone metastasis-free interval. BMJ Open. 2015;5(4):e007702. 10.1136/bmjopen-2015-007702 - DOI - PMC - PubMed