[Preprint]. 2024 Apr 15:2024.04.05.588143.
doi: 10.1101/2024.04.05.588143.

Disruption of Cholinergic Retinal Waves Alters Visual Cortex Development and Function

Affiliations

Disruption of Cholinergic Retinal Waves Alters Visual Cortex Development and Function

Timothy J Burbridge et al. bioRxiv. .

Abstract

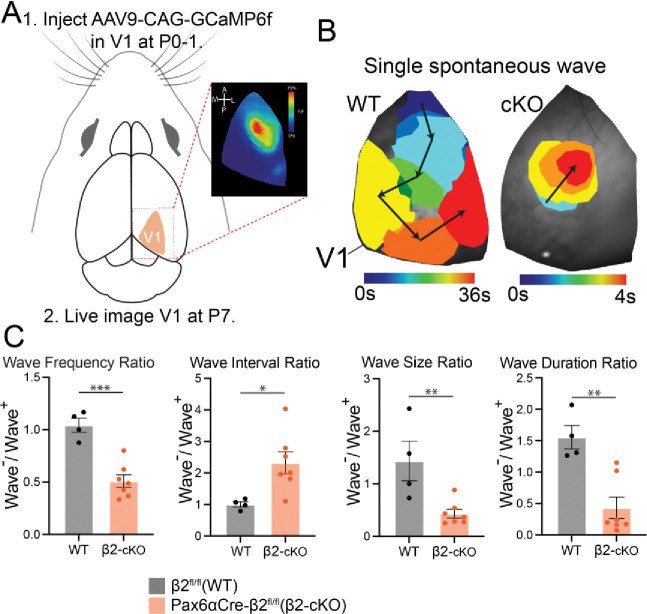
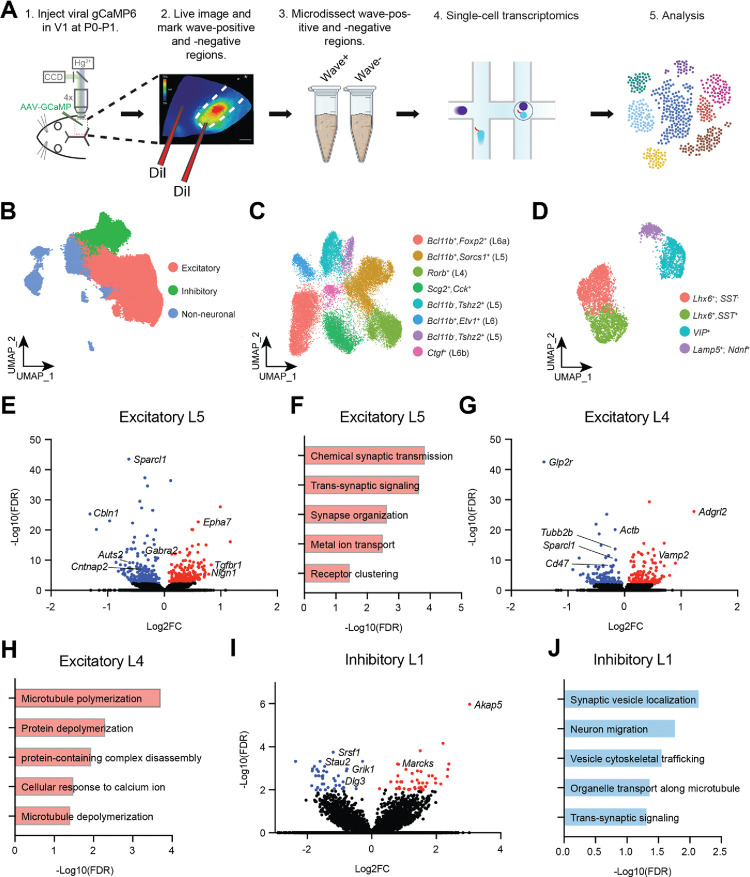
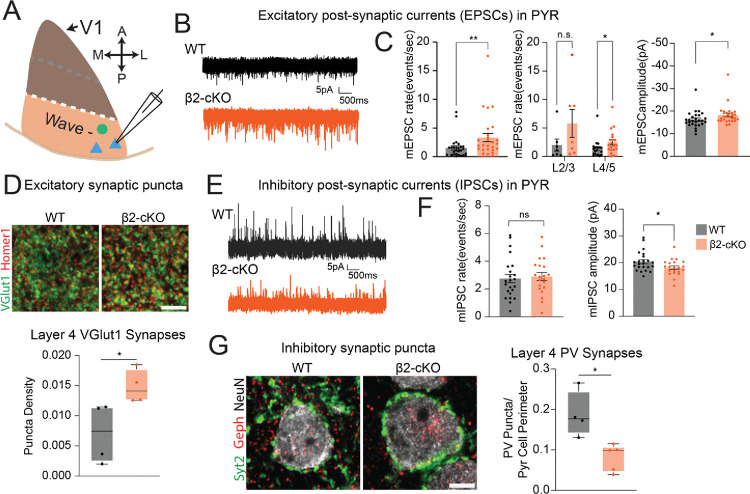
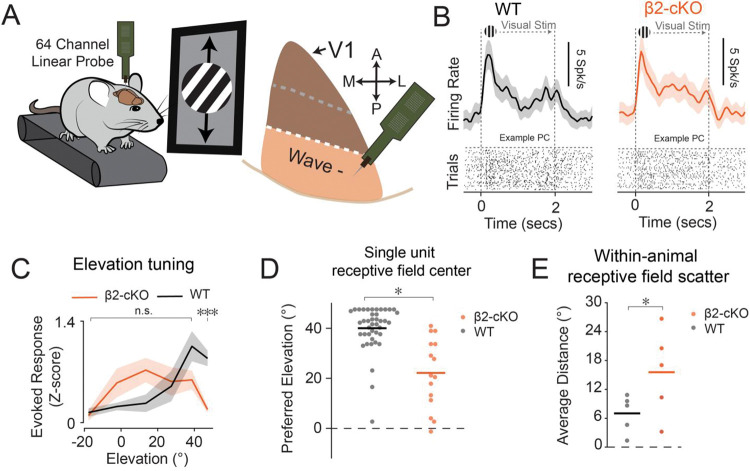
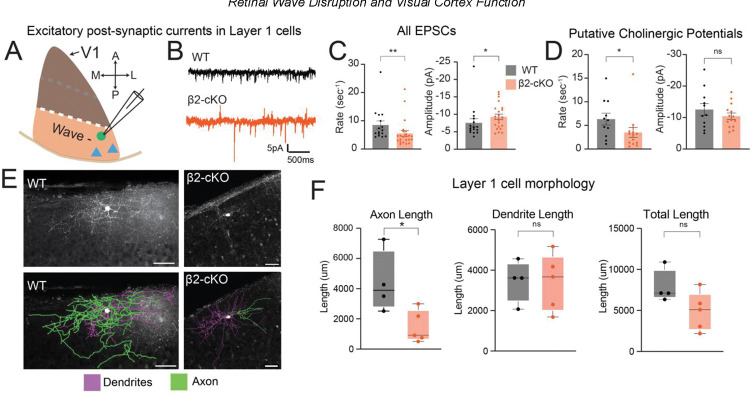
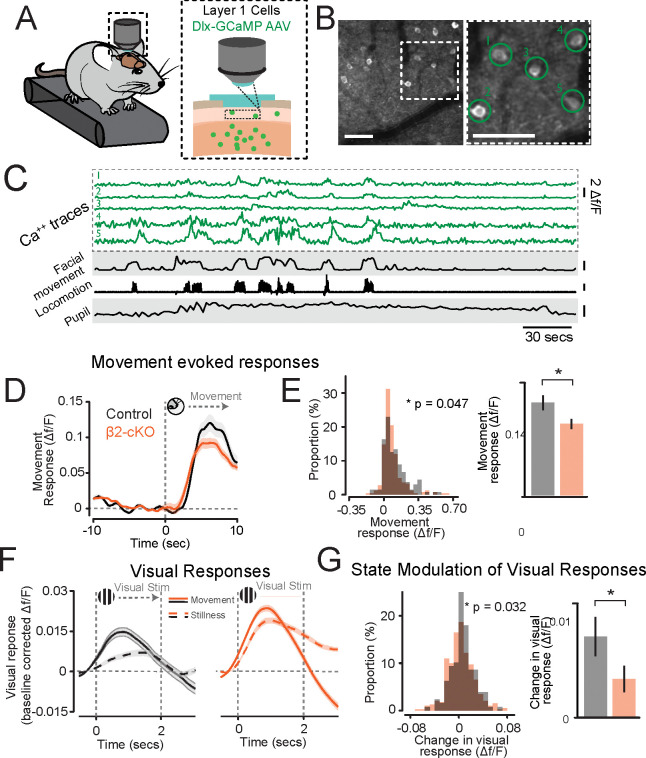
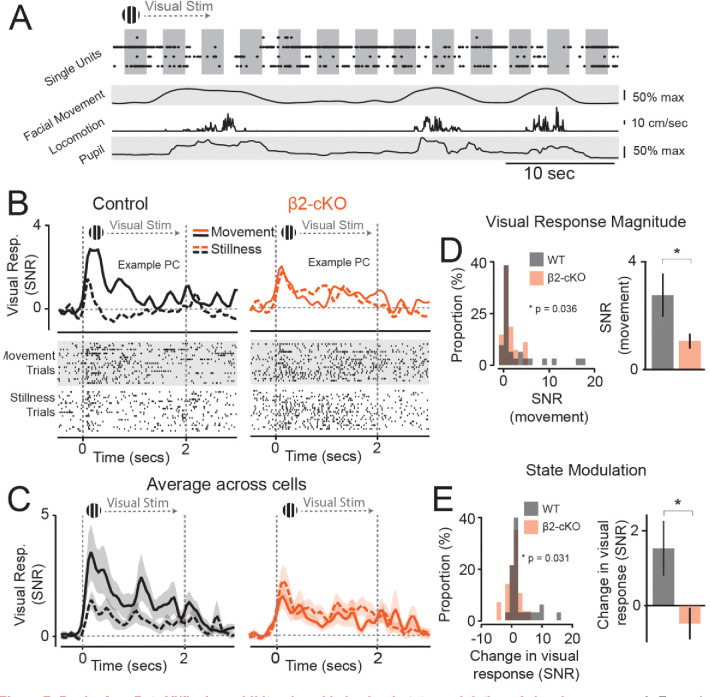
Retinal waves represent an early form of patterned spontaneous neural activity in the visual system. These waves originate in the retina before eye-opening and propagate throughout the visual system, influencing the assembly and maturation of subcortical visual brain regions. However, because it is technically challenging to ablate retina-derived cortical waves without inducing compensatory activity, the role these waves play in the development of the visual cortex remains unclear. To address this question, we used targeted conditional genetics to disrupt cholinergic retinal waves and their propagation to select regions of primary visual cortex, which largely prevented compensatory patterned activity. We find that loss of cholinergic retinal waves without compensation impaired the molecular and synaptic maturation of excitatory neurons located in the input layers of visual cortex, as well as layer 1 interneurons. These perinatal molecular and synaptic deficits also relate to functional changes observed at later ages. We find that the loss of perinatal cholinergic retinal waves causes abnormal visual cortex retinotopy, mirroring changes in the retinotopic organization of gene expression, and additionally impairs the processing of visual information. We further show that retinal waves are necessary for higher order processing of sensory information by impacting the state-dependent activity of layer 1 interneurons, a neuronal type that shapes neocortical state-modulation, as well as for state-dependent gain modulation of visual responses of excitatory neurons. Together, these results demonstrate that a brief targeted perinatal disruption of patterned spontaneous activity alters early cortical gene expression as well as synaptic and physiological development, and compromises both fundamental and, notably, higher-order functions of visual cortex after eye-opening.


Figures

Figure 1:
Figure 1:. β2-cKO mutant mice have disrupted retinal waves in the visual cortex.
A. Experimental setup. AAV9-CAG-GCaMP6f is injected at P0–1 and large-scale calcium imaging is done at P7 in V1 to characterize cortical spontaneous activity. Inset box shows an example of calcium wave activity in V1. B. Single spontaneous wave in cortex from WT (left) and β2-cKO (right) V1. WT waves generally last longer in duration and cover a larger percentage of V1 surface area than β2-cKO waves. C. Quantification of spatiotemporal properties of WT and β2-cKO V1 wave activity by region. Wave frequency (waves/minute) is lower in β2-cKO wave− region than in medial wave+ region with a corresponding increase in time between waves (Interwave Interval). Wave size (mm2) and duration (s) are smaller in β2-cKO wave− region. N=4 WT, 7 β2-cKO. *** p<0.001, ** p<0.01, * p<0.05.
Figure 2.
Figure 2.. Wave disruption modifies the transcriptomic profiles of developing cortical cells.
(A) Schematic describing the identification, isolation, and sequencing of wave+ (medial) and wave− (posterior) regions of V1 in β2-cKO mice. (B) Two-dimensional UMAP (Uniform Manifold Approximation and Projection for Dimension Reduction) representation of all cell types in the dataset by general cell class. (C) UMAP of excitatory cell types in deep cortical layers (L4 – L6). (D) UMAP of inhibitory cell types across all layers. (E),(G),(I) Volcano plots demonstrating transcripts that are more highly (red) or more lowly (blue) expressed in layer 5 excitatory neurons (E), layer 4 excitatory Rorb+ neurons (G), and layer 1 Ndnf+ inhibitory neurons (I) in wave+ versus wave− V1 of β2-cKO mice. (F),(H),(J) Gene ontology categories enriched among genes that are more highly expressed in wave+ versus wave− V1: L5 excitatory neurons (F), L4 excitatory neurons (H), and L1 inhibitory neurons (J).
Figure 3:
Figure 3:. V1 pyramidal cells (PYR) in β2-cKO mutant mice have increased excitatory inputs and reduced inhibitory inputs.
A. Schematic of experimental approach. PYR were randomly patched in posterior wave− regions of the V1 to record mEPSCs and mIPSCs in control and mutant animals. B. Representative traces of excitatory post-synaptic currents onto pyramidal cells. C. Average frequency of mEPSCs in control and β2-cKO pyramidal cells across all cortical layers, in superficial and deep layers, and average amplitude of mEPSCs in control and β2-cKO pyramidal cells across all cortical layers. D. Top, representative images of excitatory synaptic puncta in layer 4 of P21 animals. Bottom, quantification of puncta density. E. Representative traces of inhibitory post-synaptic currents onto pyramidal cells. F. Average frequency and amplitude of mIPSCs in control and β2-cKO pyramidal cells across all cortical layers. G. Left, representative images of inhibitory synaptic puncta in layer 4 of P21 animals. Right, quantification of puncta density. N=6 control and mutants for physiology, N=4–5 control and mutants for synapse analysis.
Figure 4:
Figure 4:. β2-cKO mutant mice have compromised retinotopy in the visual cortex.
A. Experimental schematic showing head fixed mice with electrophysiological recording during visual stimulation and target area in wave negative posterior visual cortex. B. Example units from both control (Pax6α-Cre; black) and Pax6α:β2-cKO (Beta2fl/fl::Pax6α-Cre; red) animals. Top: mean firing rate for visual response to preferred stimulus. Bottom: Raster plots of spiking activity for stimulus from above. C. Animal grand average z-scored spiking response to varied elevation of visual stimulation (Two-sample t-test, p < 0.001). D Preferred elevation of individual units determined as peak of gaussian tuning curve fit, bar representing mean (p < 0.001, Mann Whitney U test). N=5 controls and 5 mutants, n = 41 and 15 units, respectively. E. Average pairwise distance of receptive field centers within mice p = 0.03, one-tailed Student’s t-test. N=5 controls and 5 mutants.
Figure 5:
Figure 5:. Layer 1 interneurons in β2-cKO mutant mice have altered excitatory inputs.
A. Schematic of experimental approach. Cells in layer 1 were patched in posterior, wave-negative V1. B. EPSCs onto layer 1 cells in control and β2-cKO mutant mice. C. have mEPSCs have increased amplitude but a decreased rate (n = 16 WT and 23 cKO, p = 0.004 rate, p = 0.034 amplitude, Mann-Whitney). D. Putative cholinergic potentials exhibit a decreased rate but no change in amplitude (n = 11 WT and 14 cKO p = 0.038 rate, p = 0.467 amplitude, insert stats, Mann-Whitney). E. Filled layer 1 neurons were traced to determine gross morphology. Scale = 50 m F. Total length of axons plus dendrites and dendrite length alone is not significantly different between groups, but axon length is significantly shorter in mutants. N=4 control and 3 mutants (5 mutants for morphology). * p<0.05; **p<0.01
Figure 6:
Figure 6:. Layer 1 interneurons in β2-cKO mice exhibit reduced modulation by behavioral state.
A. Schematic of the imaging scheme from layer 1 INs. B. Example field of view from imaging experiments. (Scale bar 100um) C. Example traces showing simultaneous recordings of Ca signals from Layer 1 interneurons with measurements of state including facial movement, treadmill locomotion, and pupillometry. Scale bars represent 50% of maximum value for facial movement and pupil and 10 cm/s for locomotion. D. Peri-movement average of cell activity locked to the beginning of facial movement bouts. E. ß2-cKO mice exhibit decreased movement responses (p = 0.047, Mann-Whitney U test) Left: histogram of all cells. Right: population mean and s.e.m. F. Peristimulus average of cell activity locked to visual presentation and normalized to prestimulus activity level (df/FSTIM – df/FITI) divided by state and by genotype. Left: WT, right: Pax6α:β2-cKO. G. ß2-cKO mice exhibit decreased difference across state in average visually evoked df/F values in each cell recorded. (p = 0.032, Mann-Whitney test) Left: histogram of all cells. Right: population mean and s.e.m. N = 8 animals, n = 385 cells.
Figure 7:
Figure 7:. Pax6α-Cre::Beta2fl/fl mice exhibit reduced behavioral-state modulation of visual responses.
A. Example data showing simultaneous recording of spiking activity and LFPs with measure of behavioral state (locomotion, facial movement, and pupil diameter). Scale: 50% max facial movement and pupil, 10cm/s locomotion. B. SNRs in example regular spiking cells (RS) from control (Pax6α-Cre; black) and mutant (Beta2fl/fl::Pax6α-Cre; red) animals across behavioral states (stillness vs. movement). Note reduced modulation of behavioral state in the mutant. Top: mean SNR for visual response to preferred stimulus. Bottom: Raster plots of spiking activity for stimulus from above. C. Population signal to noise ratio (SNR) for visual responses during movement and stillness calculated across units for control (black, n=31) and mutant (red, n=27) animals. D. ß2-cKO mutants exhibit decreased average SNR during first 500ms of stimulation. (p = 0.036, Welch’s t-test). Left: histogram of all units. Right: population mean and s.e.m. E. ß2-cKO mutants exhibit decreased change in SNR from stillness to movement (p=0.03 Welch’s t-test) Left: histogram of all units. Right: population mean and s.e.m. N=5 controls and 5 mutants.

Similar articles

References

    1. Abs E, Poorthuis RB, Apelblat D, Muhammad K, Pardi MB, et al. 2018. Learning-Related Plasticity in Dendrite-Targeting Layer 1 Interneurons. Neuron 100: 684–99 e6 - PMC - PubMed
    1. Ackman JB, Burbridge TJ, Crair MC. 2012. Retinal waves coordinate patterned activity throughout the developing visual system. Nature 490: 219–25 - PMC - PubMed
    1. Allene C, Cossart R. 2010. Early NMDA receptor-driven waves of activity in the developing neocortex: physiological or pathological network oscillations? J Physiol 588: 83–91 - PMC - PubMed
    1. Antonini A, Fagiolini M, Stryker MP. 1999. Anatomical correlates of functional plasticity in mouse visual cortex. J Neurosci 19: 4388–406 - PMC - PubMed
    1. Antonini A, Stryker MP. 1996. Plasticity of geniculocortical afferents following brief or prolonged monocular occlusion in the cat. J Comp Neurol 369: 64–82 - PubMed

Publication types