[Preprint]. 2024 Apr 3:rs.3.rs-4114038.
doi: 10.21203/rs.3.rs-4114038/v1.

Phosphorylation-Driven Epichaperome Assembly: A Critical Regulator of Cellular Adaptability and Proliferation

Affiliations

Phosphorylation-Driven Epichaperome Assembly: A Critical Regulator of Cellular Adaptability and Proliferation

Seth W McNutt et al. Res Sq. .

Update in

  • Phosphorylation-driven epichaperome assembly is a regulator of cellular adaptability and proliferation.
    Roychowdhury T, McNutt SW, Pasala C, Nguyen HT, Thornton DT, Sharma S, Botticelli L, Digwal CS, Joshi S, Yang N, Panchal P, Chakrabarty S, Bay S, Markov V, Kwong C, Lisanti J, Chung SY, Ginsberg SD, Yan P, De Stanchina E, Corben A, Modi S, Alpaugh ML, Colombo G, Erdjument-Bromage H, Neubert TA, Chalkley RJ, Baker PR, Burlingame AL, Rodina A, Chiosis G, Chu F. Roychowdhury T, et al. Nat Commun. 2024 Oct 16;15(1):8912. doi: 10.1038/s41467-024-53178-5. Nat Commun. 2024. PMID: 39414766 Free PMC article.

Abstract

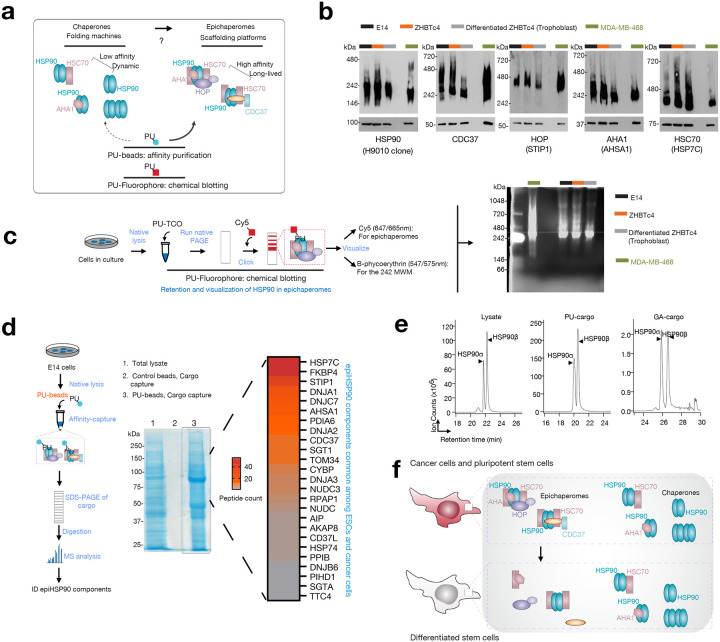
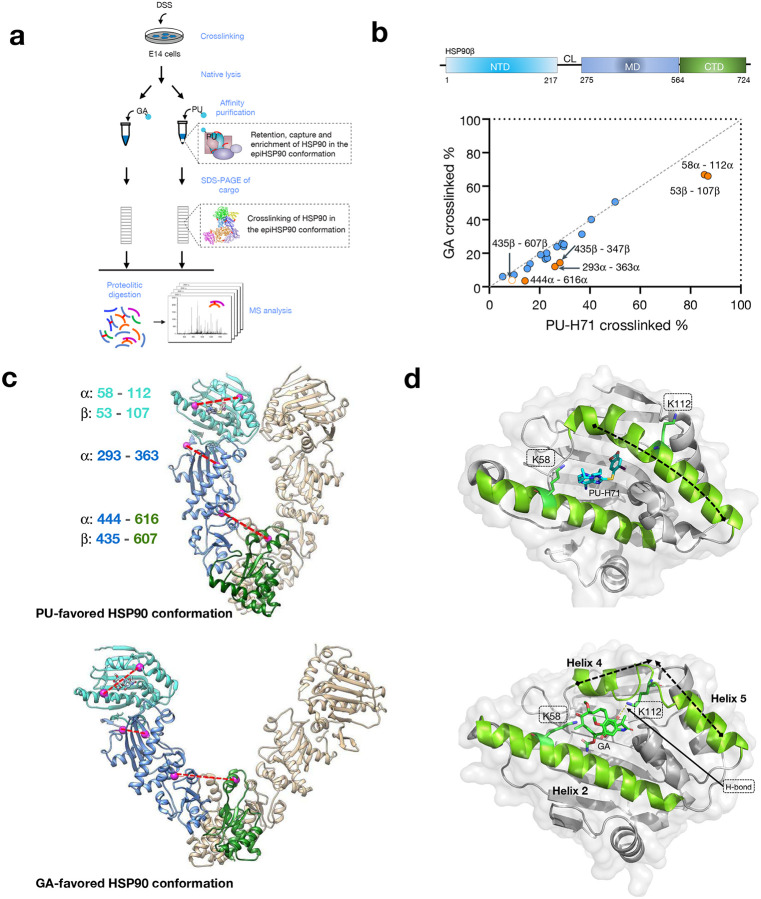
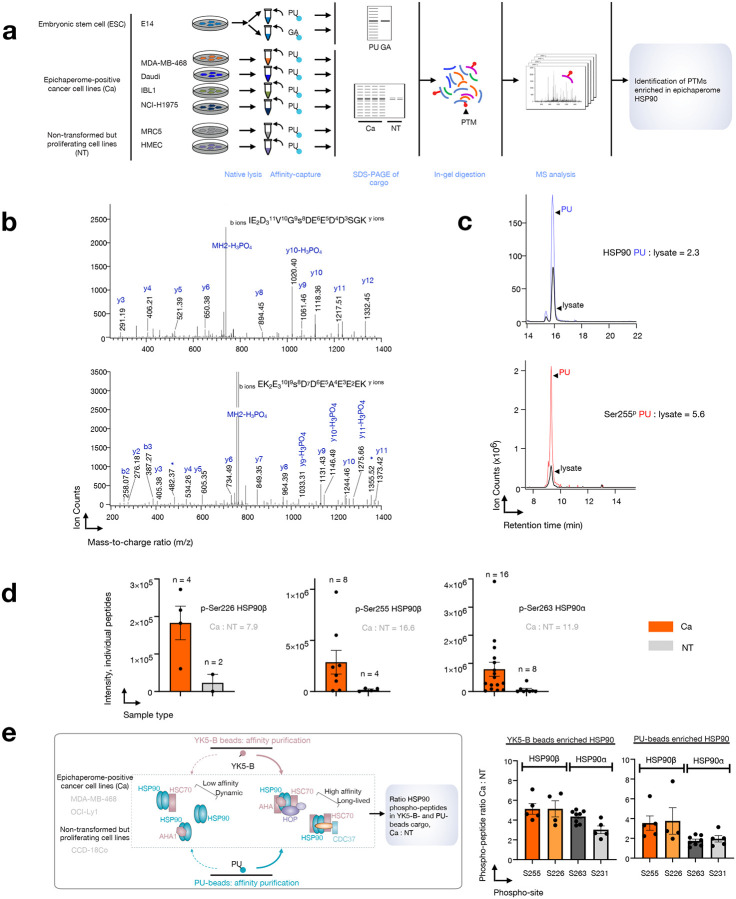
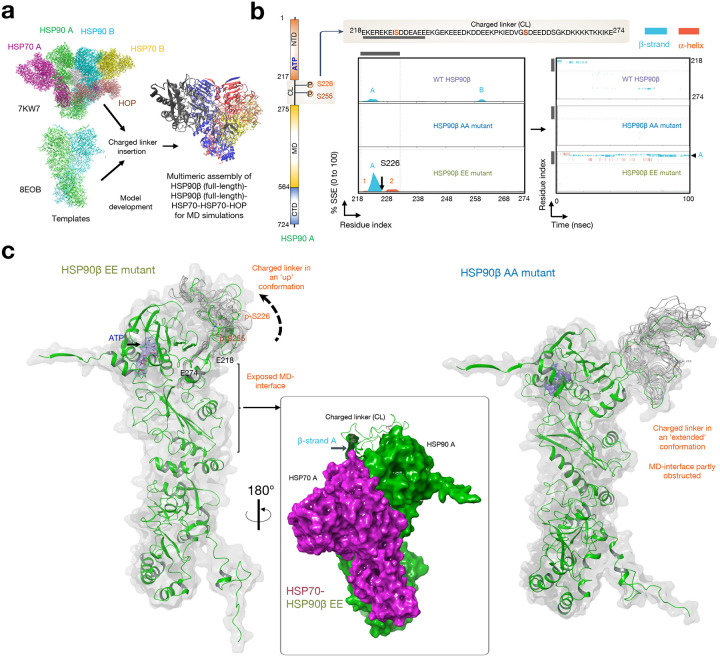
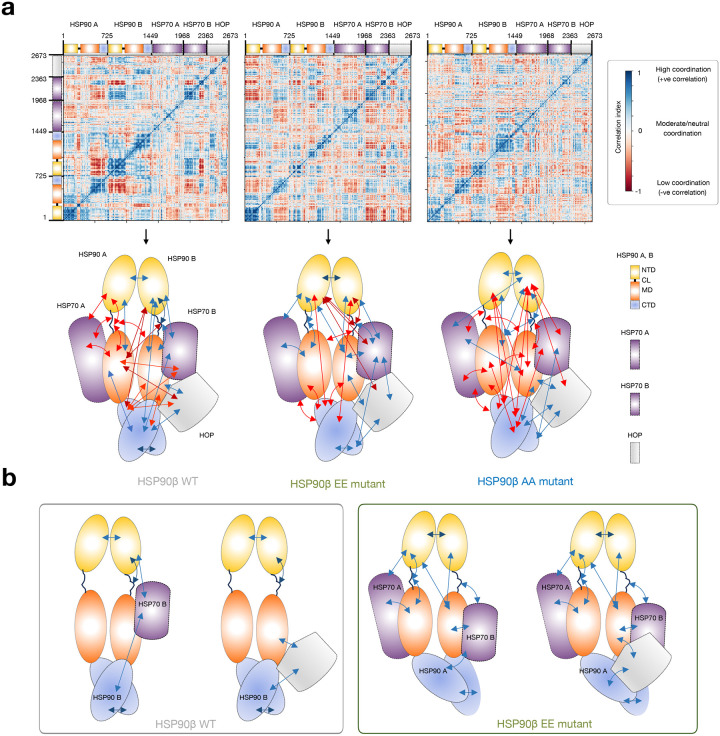
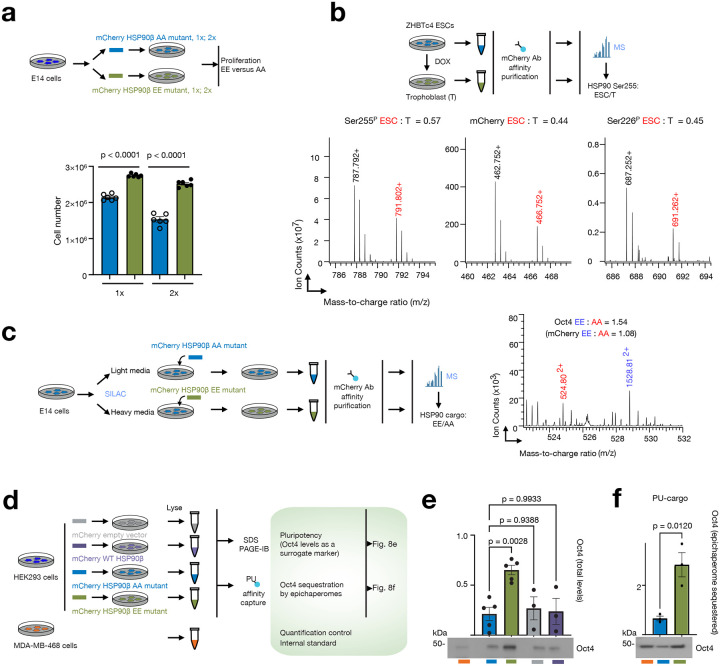
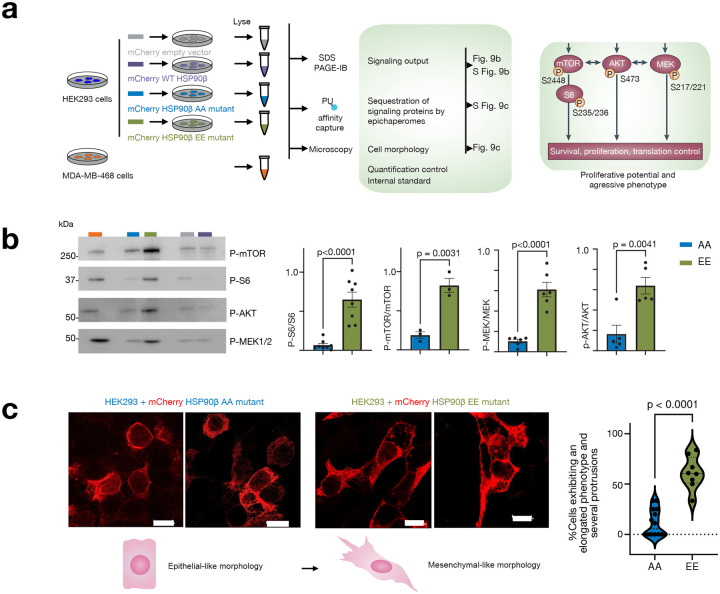
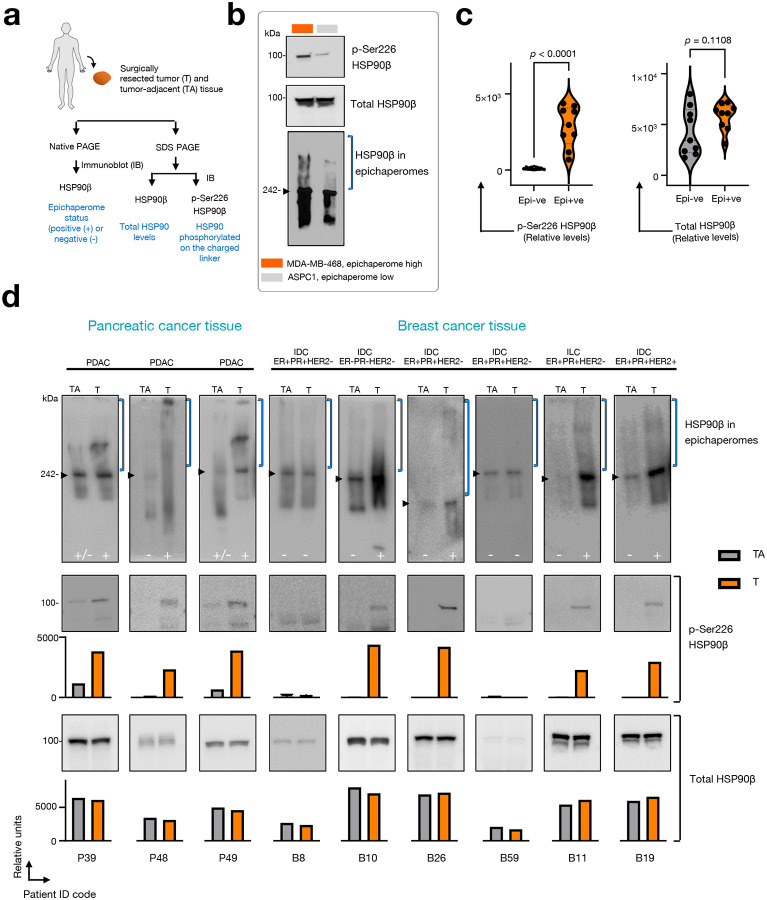
The intricate protein-chaperone network is vital for cellular function. Recent discoveries have unveiled the existence of specialized chaperone complexes called epichaperomes, protein assemblies orchestrating the reconfiguration of protein-protein interaction networks, enhancing cellular adaptability and proliferation. This study delves into the structural and regulatory aspects of epichaperomes, with a particular emphasis on the significance of post-translational modifications in shaping their formation and function. A central finding of this investigation is the identification of specific PTMs on HSP90, particularly at residues Ser226 and Ser255 situated within an intrinsically disordered region, as critical determinants in epichaperome assembly. Our data demonstrate that the phosphorylation of these serine residues enhances HSP90's interaction with other chaperones and co-chaperones, creating a microenvironment conducive to epichaperome formation. Furthermore, this study establishes a direct link between epichaperome function and cellular physiology, especially in contexts where robust proliferation and adaptive behavior are essential, such as cancer and stem cell maintenance. These findings not only provide mechanistic insights but also hold promise for the development of novel therapeutic strategies targeting chaperone complexes in diseases characterized by epichaperome dysregulation, bridging the gap between fundamental research and precision medicine.


Conflict of interest statement

COMPETING INTERESTS Memorial Sloan Kettering Cancer Center holds the intellectual rights to the epichaperome portfolio. G.C., A.R. and S.S. are inventors on the licensed intellectual property. All other authors declare no competing interests.

Figures

Figure 1.
Figure 1.. Embryonic stem cells and cancer cells share compositionally similar epichaperomes.
a Schematic illustrating the biochemical and functional distinctions between epichaperomes, defined as long-lasting heterooligomeric assemblies composed of tightly associated chaperones and co-chaperones, and traditional chaperones. Unlike chaperones, which assist in protein folding or assembly, epichaperomes sequester proteins, reshaping protein-protein interactions, and consequently altering cellular phenotypes. The schematic also outlines key principles for the use of PU-probes in epichaperome analysis. b Detection of epichaperome components (chaperones and co-chaperones) through SDS-PAGE (bottom, total protein levels) and native-PAGE (top), followed by immunoblotting. See also Supplementary Fig. 1. c Visualization of HSP90 in epichaperomes using the PU-TCO click probe. See also Supplementary Fig. 2. Gel images are representative of three independent experiments. d Epichaperome constituent chaperones and co-chaperones identified through mass spectrometry analyses of PU-beads cargo. Representative data of two independent experiments. See Supplementary Fig. 3 for the GA-cargo. e Illustration of an isobaric, discriminant peptide pair from ESC lysate samples and HSP90 captured by PU- and GA-beads. Representative data of two independent experiments. f Schematic summary. Both cancer cells and pluripotent stem cells harbor epichaperomes. These epichaperomes undergo disassembly during differentiation processes. Source data are provided in Supplementary Data 1 and in Source data file.
Figure 2.
Figure 2.. An enrichment of the closed-like conformation of HSP90 favors epichaperomes formation.
a Experiment outline. b Plot comparing cross-linking propensity of Lys residues in HSP90 bound to PU-H71 or GA. Average cross-linking percentage of PU-H71 (x-axis) and GA (y-axis) bound HSP90 cross-linked pairs are shown. Blue circles represent pairs with similar cross-linking propensity (dotted line with a slope of 1). Orange points indicate outlier cross-linked peptides, with cross-linked Lys residues 8 amino acids away and the cross-linking percentage difference ≥ 1.5 standard deviation of replicates. Solid orange circles represent p ≤ 0.05, n = 3 replicate measurements. c Homology model illustrating the HSP90 dimer in the open conformation (template PDB: 2IOQ), favored by geldanamycin (GA), and the closed conformation (template PDB: 2CG9), favored by PU-H71. One HSP90 protomer is colored to indicate the N-terminal domain (NTD, light blue), the middle domain (MD, dark blue), and the C-terminal domain (CTD, green). Cross-linked residues are labeled by pink dots and connected by red dashed lines. d NTD structures of PU-H71 (top, PDB: 2FWZ) and GA (bottom, PDB: 1YET)-bound HSP90. Source data are provided as Supplementary Data 2.
Figure 3.
Figure 3.. Phosphorylation of key residues located in the charged linker supports HSP90 incorporation into epichaperomes.
a Experiment outline and expected outcomes. b Tandem MS spectra of HSP90 Ser226 (bottom) and Ser255 (top) phosphorylated peptides are presented, supporting the sequence and phosphorylation site identification. c Comparison of the extracted ion chromatogram of HSP90 Ser255 phosphopeptide in the PU-bead cargo (red trace, left panel) and ESC lysate (black trace, left panel) with a representative unmodified tryptic peptide in the PU-bead cargo (blue trace, right panel) and ESC lysate (black trace, right panel). d Ion intensity values of all phosphopeptides and the ratio of mean peptide intensity for each phosphosite in the samples described in panel a (n = 4 Ca and n = 2, NT). e Ratio of individual peptide intensity for each phosphosite in the samples described in the schematic (S255 n = 5; S226 n = 4; S263 n = 8; S231 n = 5). Source data are provided as Source Data file and as Supplementary Data 3,6.
Figure 4.
Figure 4.. Phosphorylation of key residues located in the charged linker of HSP90 leads to a conformational shift in the linker, exposing the middle domain of the protein.
a Model of the HSP90-HSP90-HSP70-HSP70-HOP assembly used for the molecular dynamics simulations. A and B, protomers A and B, respectively. b Protein secondary structure elements (SSE) like alpha-helices and beta-strands of the charged linker of protomer A of ATP-bound HSP90 monitored throughout the MD simulation. WT (HSP90 S226/S255), phosphomimetic (HSP90 S226E/S255E) and non-phosphorylatable (HSP90 S226A/S255A) mutants were analyzed. The plot on the left reports SSE distribution by residue index throughout the charged linker and the plot on the right monitors each residue and its SSE assignment over time. Schematic illustrating the primary structure of the full-length HSP90 with color-coded domains is also shown: NTD, N-terminal domain; MD, middle domain and CTD, C-terminal domain. The charged linker (CL) and the location of the two key serine residues are also shown (top inset). The gray bar indicates the CL segment encompassing residues 218 to 232. c Cartoon representation of ATP-bound HSP90 protomer A in assemblies containing the phosphomimetic (HSP90 S226E/S255E) or the non-phosphorylatable (HSP90 S226A/S255A) mutants is shown. Green, reference trajectory; gray, representative trajectories of n = 1,000. The inset illustrates the surfaces available for the interaction between HSP90 A and HSP70 A when the CL is in the ‘up’ conformation. A blue arrow indicates the location of the key beta-strand in the charged linker. See also Supplementary Figs. 5 and 6.
Figure 5.
Figure 5.. Phosphorylation of key residues located in the charged linker of HSP90 facilitates assembly motions conducive to epichaperome core formation.
a Calculated dynamic cross-correlation matrix of Cα atoms around their mean positions for 100 ns molecular dynamics simulations. ATP-bound WT (HSP90 S226/S255), phosphomimetic (HSP90 S226E/S255E) and non-phosphorylatable (HSP90 S226A/S255A) mutant-containing HSP90-HSP90-HSP70-HSP70-HOP assemblies were analyzed. The cartoon below captures the key motions among the different domains of the individual assembly components. Extents of correlated motions and anti-correlated motions are color-coded from blue to red, which represent positive and negative correlations, respectively. The assembly contains two full-length HSP90beta proteins (protomer A and protomer B). The two HSP70 proteins (HSP70 A and HSP70 B) and the HOP protein are of sizes reported, and as per the constructs used in 7KW7. b Cartoon showing assemblies that are preferentially formed when the HSP90 charged linker is either phosphorylated (as in the EE mutant) or not phosphorylated (as in the WT protein).
Figure 6.
Figure 6.. Immunopurification reveals increased presence of epichaperome-specific co-chaperones in phosphomimetic HSP90 complexes compared to non-phosphorylatable complexes.
a Experiment outline and outcomes. b Representative spectra (n = 3 independent experiment) of proteins co-purified with the phosphomimetic HSP90S226E,S255E (EE, blue) and non-phosphorylatable HSP90S226A,S255A (AA, red) mutants. c Heatmap showing the identity of chaperone and co-chaperones identified as epichaperome components in cancer cells (as per Rodina et al. Nature 2016) and enriched in the affinity purified HSP90S226E,S255E mutant. Scale bar, log2 average SILAC values EE/AA (n = 3). Source data are provided as a Source Data file and as Supplementary Data 4.
Figure 7.
Figure 7.. Phosphorylation of key residues located in the charged linker supports HSP90 incorporation into epichaperomes.
a Overview of the experimental design and expected outcomes. b Analysis of transfection efficacy in cells transfected with HSP90β mutants, as indicated in panel a. c Detection of epichaperome components (chaperones and co-chaperones) through SDS-PAGE (bottom, total protein levels) and native-PAGE (top), followed by immunoblotting. Blue brackets indicate the approximate position of epichaperome-incorporated chaperones. Data are presented as mean ± s.e.m., n = 3, one-way ANOVA with Sidak’s post-hoc, EE vs AA. d Visualization of HSP90 in epichaperomes using the PU-TCO probe clicked to Cy5 (left) and the mCherry tag (middle). Right, merged images. MWM, molecular weight marker. e Detection and quantification of epichaperome components through PU-beads capture as indicated in panel a. Protein amount loaded for ‘Input’ represents 2% of the protein amount incubated with the beads. Data are presented as mean ± s.e.m., n = 3, unpaired two-tailed t-test. Gel images are representative of three independent experiments. Source data are provided as Source data file.
Figure 8.
Figure 8.. Phosphorylation of key residues located in the HSP90 charged linker favors ESC proliferation and self-renewal potential.
a ESC proliferation at 60 h post-transfection in E14 cells transfected with either the phosphomimetic HSP90βS226E,S255E (EE) or the nonphosphorylatable HSP90S226A,S255A (AA) mutant. Medium (1x) or high (2x) plasmid concentrations were employed. Data are presented as mean ± s.e.m., n = 6, one-way ANOVA with Sidak’s post-hoc, EE vs AA. b Representative spectra (n = 3 independent experiments) of phosphopeptides, S255P (left) and S226P (right), and a representative unmodified tryptic peptide (middle) in mCherry-tagged WT HSP90β affinity-purified from ESC (red) or differentiated trophoblast (black) cells. c Representative spectra (n = 3 independent experiments) of a tryptic peptide from Oct4 protein co-purified from ESCs labeled with heavy or light isotope lysine and arginine expressing either the phosphomimetic (EE) or the non-phosphorylatable (AA) HSP90 mutant. Quantitative analysis via mass spectrometry (MS) to determine protein abundance is shown. d Overview of the experimental design and expected outcomes (panels e,f). e,f Detection and quantification of Oct4 protein expressed in cells transfected with the indicated HSP90 mutants or vector control (panel e) and sequestered into the epichaperome platforms (identified through PU-beads capture, panel f). (e) Data are presented as mean ± s.e.m., n = 5 AA, n = 5 EE, n = 3 WT, n = 3 empty vector, one-way ANOVA with Dunnett’s post-hoc, EE vs AA, WT vs AA, empty vector vs AA. (f) Data are presented as mean ± s.e.m., n = 3, unpaired two-tailed t-test. Source data are provided as Source Data file and Supplementary Data 5.
Figure 9.
Figure 9.. Regulation of epichaperome processes in ESC and cancer cells hinges on the specific phosphorylation events occurring at key residues within HSP90’s charged linker.
a Overview of the experimental design and expected outcomes. b Detection and quantification of proteins involved in transducing signaling events that lead to cell proliferation, survival, and protein synthesis control. See Supplementary Fig. 9 for total protein levels and levels sequestered into epichaperomes. Data are presented as mean ± s.e.m., p-S6 n = 8; p-mTOR n = 3; p-MEK1/2 n = 6; p-AKT n = 5, unpaired two-tailed t-test. c Confocal microscopy shows morphological differences between the cells transfected with either the AA or the EE HSP90 mutant. Micrographs are representative of 96 cells for EE and 62 cells for AA. Scale bar, 10 μm. Data are presented as mean ± s.e.m., n = 8 wells for EE, n = 14 wells for AA, unpaired two-tailed t-test. Source data are provided as Source data file.
Figure 10.
Figure 10.. Human tissues positive for epichaperomes exhibit p-Ser226 HSP90β positivity, and conversely, those negative for epichaperomes show no or negligible p-Ser226 signal within HSP90’s charged linker.
a Cartoon illustrating the processing of human tissue for biochemical analyses. Both tumor (T) and tumor adjacent (TA) tissues, determined by gross pathological evaluation to be potentially non-cancerous, were harvested and analyzed. b MDA-MB-468 breast cancer cells (epichaperome-high) and ASPC1 pancreatic cancer cells (epichaperome-low) served as controls for assessing p-Ser226 HSP90 levels. c The graph presents the relationship between epichaperome positivity and HSP90 Ser226 phosphorylation for tissues described in panel a. Data represent mean ± s.e.m., with n = 9 tumor (T) and n = 9 paired tumor-adjacent (TA) tissues classified based on epichaperome positivity or negativity, as determined by Native PAGE (see panel d); unpaired two-tailed t-test. d Detection of epichaperomes through native-PAGE (top), and of p-Ser226 HSP90 (middle) and total HSP90 (bottom) by SDS-PAGE, followed by immunoblotting, in tissues from the indicated patient specimens, as in panel a. Blue brackets indicate the approximate position of epichaperome-incorporated HSP90. Note: Obtaining genuinely “normal” tissue adjacent to tumors presents challenges, especially in the case of pancreatic tissue. The relatively small size of the organ and the nature of surgical procedures for pancreatic cancer often lead to the collection of normal samples in close proximity to the tumor. It’s crucial to acknowledge that, due to these challenges, we designate potentially normal tissue as tumor-adjacent tissue, recognizing that it may not entirely reflect a truly normal tissue state. PDAC, Pancreatic Ductal Adenocarcinoma; IDC, Invasive Ductal Carcinoma; ILC, Invasive Lobular Carcinoma; ER, Estrogen Receptor; PR, Progesterone Receptor. Source data are provided as Source data file.

References

    1. Bludau I. & Aebersold R. Proteomic and interactomic insights into the molecular basis of cell functional diversity. Nat. Rev. Mol. Cell Biol. 21, 327–340 (2020). - PubMed
    1. Nussinov R., Tsai C. J. & Jang H. Protein ensembles link genotype to phenotype. PLoS Comput. Biol. 15, e1006648 (2019). - PMC - PubMed
    1. Chiosis G., Digwal C. S., Trepel J. B. & Neckers L. Structural and functional complexity of HSP90 in cellular homeostasis and disease. Nat. Rev. Mol. Cell Biol. 24, 797–815 (2023). - PMC - PubMed
    1. Schopf F. H., Biebl M. M. & Buchner J. The HSP90 chaperone machinery. Nat. Rev. Mol. Cell Biol. 18, 345–360 (2017). - PubMed
    1. Krukenberg K. A., Street T. O., Lavery L. A. & Agard D. A. Conformational dynamics of the molecular chaperone Hsp90. Q. Rev. Biophys. 44, 229–255 (2011). - PMC - PubMed

Publication types

LinkOut - more resources