[Preprint]. 2024 Apr 12:2024.04.09.588340.
doi: 10.1101/2024.04.09.588340.

Single Cell Analysis of Treatment-Resistant Prostate Cancer: Implications of Cell State Changes for Cell Surface Antigen Targeted Therapies

Affiliations

Single Cell Analysis of Treatment-Resistant Prostate Cancer: Implications of Cell State Changes for Cell Surface Antigen Targeted Therapies

Samir Zaidi et al. bioRxiv. .

Update in

Abstract

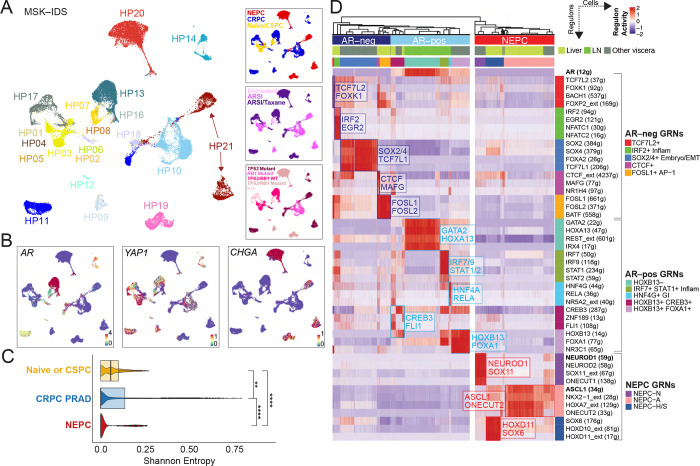
Targeting cell surface molecules using radioligand and antibody-based therapies has yielded considerable success across cancers. However, it remains unclear how the expression of putative lineage markers, particularly cell surface molecules, varies in the process of lineage plasticity, wherein tumor cells alter their identity and acquire new oncogenic properties. A notable example of lineage plasticity is the transformation of prostate adenocarcinoma (PRAD) to neuroendocrine prostate cancer (NEPC)--a growing resistance mechanism that results in the loss of responsiveness to androgen blockade and portends dismal patient survival. To understand how lineage markers vary across the evolution of lineage plasticity in prostate cancer, we applied single cell analyses to 21 human prostate tumor biopsies and two genetically engineered mouse models, together with tissue microarray analysis (TMA) on 131 tumor samples. Not only did we observe a higher degree of phenotypic heterogeneity in castrate-resistant PRAD and NEPC than previously anticipated, but also found that the expression of molecules targeted therapeutically, namely PSMA, STEAP1, STEAP2, TROP2, CEACAM5, and DLL3, varied within a subset of gene-regulatory networks (GRNs). We also noted that NEPC and small cell lung cancer (SCLC) subtypes shared a set of GRNs, indicative of conserved biologic pathways that may be exploited therapeutically across tumor types. While this extreme level of transcriptional heterogeneity, particularly in cell surface marker expression, may mitigate the durability of clinical responses to novel antigen-directed therapies, its delineation may yield signatures for patient selection in clinical trials, potentially across distinct cancer types.


Conflict of interest statement

Competing Interests: P.S.N. has received consulting fees from Janssen, Merck and Bristol Myers Squibb and research support from Janssen for work unrelated to the present studies. S.Z. has received consulting fees from Guidepoint and GLG consulting. M.C.H served as a paid consultant/received honoraria from Pfizer and has received research funding from Merck, Novartis, Genentech, Promicell and Bristol Myers Squibb. C.L.S is on the board of directors of Novartis, is a co-founder of ORIC Pharmaceuticals, and is a co-inventor of the prostate cancer drugs enzalutamide and apalutamide, covered by U.S. patents 7,709,517, 8,183,274, 9,126,941, 8,445,507, 8,802,689, and 9,388,159 filed by the University of California. C.L.S. is on the scientific advisory boards of the following biotechnology companies: Beigene, Blueprint, Cellcarta, Column Group, Foghorn, Housey Pharma, Nextech, PMV.

Figures

Figure 1.
Figure 1.. Tissue Microarray of Lineage and Cell Surface Markers in Human CRPC–adenocarcinoma and NEPC.
(A) Heatmap of human CRPC tissue microarray–based immunohistochemical expression studies of patients from the rapid autopsy program at University of Washington. H-scores (immunohistochemical score, scale 0 to 200, and red gradient) are shown for select markers, namely luminal or basal (AR, NKX3.1, CK8, and P63), neuroendocrine prostate cancer (NEPC) (SYP, INSM1, ASCL1, NEUROD1, FOXA2), other single cell RNA–sequencing candidates from GEMMs (YAP1, POU2F3, CMYC, SOX2, EZH2, and TFF3), cell surface markers (CSM) (TROP2 and DLL3), and proliferative score (KI67, scale 0 to 100, and black gradient). Corresponding de–identified patient IDs (top row), site (bone, yellow; liver/lung, light purple; prostate, dark purple; lymph node, purple; other viscera, green), and histology (PRAD or prostate adenocarcinoma, light blue; HGC or high–grade carcinoma, orange; and NEPC or high–grade neuroendocrine, red) are labeled. Dark gray boxes are substituted in place of H–score for tumors with no immunohistochemical information. (B–D) Boxplot of H–scores of NKX3.1, YAP1, and ASCL1 grouped by histology (PRAD, HGC, and NEPC). Significance of H–score distribution was assessed by Wilcoxon signed–ranked test. (E) Scatter plot of H–scores of EZH2 (y–axis) and proliferative index of Ki67 (x–axis). Linear fit was calculated between two markers; the corresponding Pearson’s correlation is noted. (F–G) INSM1 or SYP (y–axis) and ASCL1 (x–axis) are shown with the color of the dot representing histology (PRAD, HGC, and NEPC) with corresponding Lin’s concordance correlation coefficient noted (95% confidence intervals). (H–I) Boxplot of H–scores of cell surface markers, TROP2 and DLL3 grouped by histology (PRAD, HGC, and NEPC). Of note, TROP2 and DLL3 expression has been assessed in a larger TMA (inclusive of these data) separated by categories: AR+/NE−, AR−/NE+, AR+/NE+, and AR−/NE− by our groups in Ajkunic et al. PMID 38296594. Significance of H–score distribution was assessed by Wilcoxon signed–ranked test. Abbreviations include: not significant (ns), * (<0.05), **(<0.01), ***(<0.001), ****(1×10⁻⁴).
Figure 2.
Figure 2.. Diverse Gene–Regulatory Networks in Castration–Resistant Prostate Cancer.
(A) UMAP of tumor cells (N=35,696 cells), colored by patient ID (large panel on left), category (top right panel), treatments (middle right panel; categories include untreated, androgen–receptor signaling inhibitor/ARSI, and ARSI plus taxane–based chemotherapy) or TP53/RB1 genomic status (bottom right panel). Also detailed in Supplementary Table 3. (B) UMAPs showing expression [log(X +1)] of lineage genes, namely AR, YAP1, and CHGA. (C) Boxplot of inter–patient heterogeneity measured by Shannon entropy based of patient frequencies. To control for cell sampling, 100 cells were subsampled from each Phenograph cluster (k=30) within tumor compartments 100 times with replacement (Wilcoxon signed–rank test, Methods). Immune and mesenchymal inclusion shown in Supplementary Figure 3H. Abbreviations: * (<0.05), ****(1×10⁻⁴). (D) Heatmap of CRPC–adenocarcinoma and NEPC cells (x–axis) and per cell scaled regulon activity scores (z–score: −2 to 2) is shown for select TFs (paratheses denotes number of genes within regulon, extended heatmap in Supplementary Figure 4). A dendrogram cutoff of 15 based on adjusted Rand index was used to unbiasedly define the number of gene–regulatory networks (GRNs), yielding 10 and 3 CRPC–adeno and NEPC GRNs, respectively. Regulons were assigned to GRNs based on regulon specificity score (RSS) and ranked by significance (Supplementary Table 6). Adenocarcinoma GRNs were labeled based on AR activity (light blue on top panel of heatmap; bracketed by AR–positive GRNs) and without or having low AR activity (dark blue on top panel of heatmap; bracketed by AR–negative GRNs). NEPC regulons are shown (red on top panel of heatmap; bracketed by NEPC GRNs). AR(12g), NEUROD1(59g), and ASCL1(34g) regulons are bolded for reference.
Figure 3.
Figure 3.. GEMM GRNs and NEPC and SCLC Overlap.
(A) Heatmap of GEMM tumor cells (N=21,499) (x–axis) and and per cell scaled regulon activity scores (z–score: −2 to 2) is shown for select TFs (paratheses denotes number of genes within regulon). A dendrogram cutoff of 12 based on adjusted Rand index yielded 9 GRNs with regulons assigned to GRNs based on regulon specificity score (RSS) and ranked by significance (Methods, Supplementary Table 9). Ar–extended (14g) and Ascl1 (150g) are shown in the top, bolded, and boxed in red for reference. (B) UMAP of GEMMs mutant Gfp–positive cells are colored by annotated GRN (color scheme corresponds to in Figure 3A), or by regulon activity (z–score) of Ar_extended (14g), Ascl1 (150g), Twist1 (164g), Pou2f3 (471g), Tff3 (62g), Trp63 (131g), and Stat2 (94g). (C) NEPC–N vs. NEPC–A (shown on x–axis) or SCLC–N vs. SCLC–A (shown on y–axis) were compared using MAST and the log2FC for each gene is shown on the scatter plot. Genes with log2FC > 0.4 (and padj<0.05) are labeled with TFs noted in red or purple for being enriched in both NEPC and SCLC ASCL1 and NEUROD1 subsets, respectively. (D) Venn diagram shows the overlap of top DEGs (average log2FC > 0.4, adjusted p–value < 0.05) shared between NEPC–A and SCLC–A (red) or NEPC–N and SCLC–N (purple). A Fisher’s exact test was used for significance of overlap.
Figure 4.
Figure 4.. Expression of Cell Surface Markers in CRPC and NEPC GRNs.
(A) Scatter plot with scaled FOLH1/PSMA expression (y–axis) and AR module score (x–axis) (Methods) for each GRN as colored in Figure 2D (Lin’s concordance correlation coefficient = 0.71). (B) Heatmap of top 10 differentially active regulons in ARhighFOLH1/PSMAhigh, ARhighFOLH1/PSMAlow (from MSK–HP13), ARlowFOLH1/PSMAlow, and NEPC/FOLH1/PSMAlow. Per cell regulon activity scores are shown (scale: −2 to 2) (Methods). (C) UMAP of AR and FOLH1/PSMA expression in tumor cells of MSK–HP13. Dotted circles denote region of FOLH2–positivity in otherwise largely FOLH1–negative MSK–HP13 biopsy. Heatmap of scaled expression (scale 0 to 1) is shown below with a blue box marking FOLH1/PSMA–positive cell population. (D) Scatter plots are shown of scaled expression of respective cell surface antigen (STEAP1, STEAP2, CEACAM5, and TACSTD2/TROP2, y–axis) and AR module score (x–axis) with each dot representing a GRN. Colors of GRNs correspond to GRN annotation on right separated by AR–positive, AR–negative and NEPC groups. Linear fit was calculated between two markers for only CRPC–adeno GRNs; the corresponding Pearson’s correlation is noted only for CRPC–adenocarcinoma GRNs or AR–positive and AR–negative GRNs alone. (E) A boxplot for DLL3 imputed expression (MAGIC, k=20, t=1) is shown for NEPC–A, NEPC–H/S and NEPC–N regulons. Significance was assessed by Wilcoxon–signed rank test. Abbreviations: ****(P<1×10⁻⁴). (F) Immunohistochemistry of a liver with multiple metastases (PMID 3459916) shows distinct ASCL1–dominant (green dotted line) and NEUROD1–dominant (pink dotted line) foci prospectively stained for DLL3 expression. Zoomed images of two regions with DLL3+ and DLL3–negative foci are shown for DLL3, ASCL1, and NEUROD1 expression. Scale bar is 50 μM. (G) Dot plot of DLL3 expression [non–imputed, log(X+1)] in CRPC tumor biopsies in single cell human RNA–sequencing data. This analysis suggests that a subset of CRPC adenocarcinoma cells are DLL3 expressors. On the right, representative immunohistochemistry is shown of a biopsy with interspersed ASCL1/DLL3 cells among AR positive cells (Patient 4). Scale bar is 50 μM.

References

    1. Sartor O. et al., Lutetium-177-PSMA-617 for Metastatic Castration-Resistant Prostate Cancer. N Engl J Med 385, 1091–1103 (2021). - PMC - PubMed
    1. Hoimes C. J. et al., Enfortumab Vedotin Plus Pembrolizumab in Previously Untreated Advanced Urothelial Cancer. J Clin Oncol 41, 22–31 (2023). - PMC - PubMed
    1. Modi S. et al., Trastuzumab Deruxtecan in Previously Treated HER2-Low Advanced Breast Cancer. N Engl J Med 387, 9–20 (2022). - PMC - PubMed
    1. Kelly W. K. et al., Xaluritamig, a STEAP1 x CD3 XmAb 2+1 Immune Therapy for Metastatic Castration-Resistant Prostate Cancer: Results from Dose Exploration in a First-in-Human Study. Cancer Discov, OF1–OF14 (2023). - PMC - PubMed
    1. Mailankody S., Brentjens R. J., Smith E. L., GPRC5D-Targeted CAR T Cells for Myeloma. Reply. N Engl J Med 387, 2296 (2022). - PubMed

Publication types