[Preprint]. 2024 Apr 11:2024.04.10.588959.
doi: 10.1101/2024.04.10.588959.

Muscle-Specific Pyruvate Kinase Isoforms, Pkm1 and Pkm2, Regulate Mammalian SWI/SNF Proteins and Histone 3 Phosphorylation During Myoblast Differentiation

Affiliations

Muscle-Specific Pyruvate Kinase Isoforms, Pkm1 and Pkm2, Regulate Mammalian SWI/SNF Proteins and Histone 3 Phosphorylation During Myoblast Differentiation

Monserrat Olea-Flores et al. bioRxiv. .

Update in

Abstract

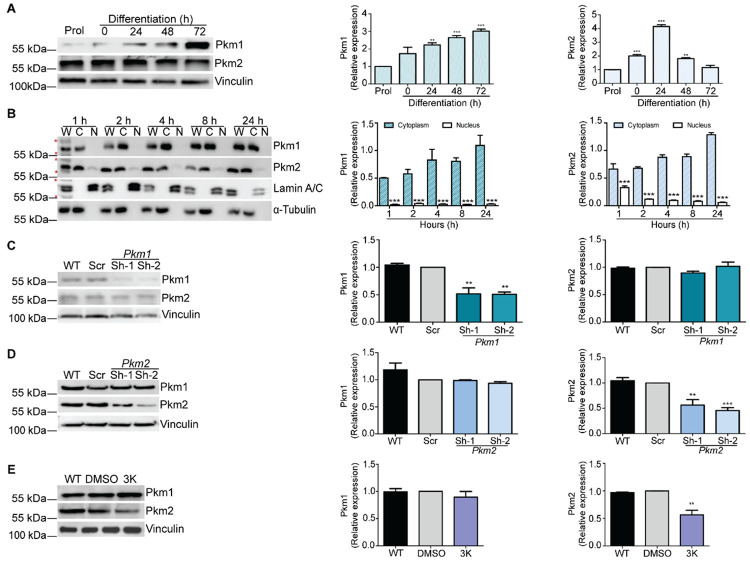
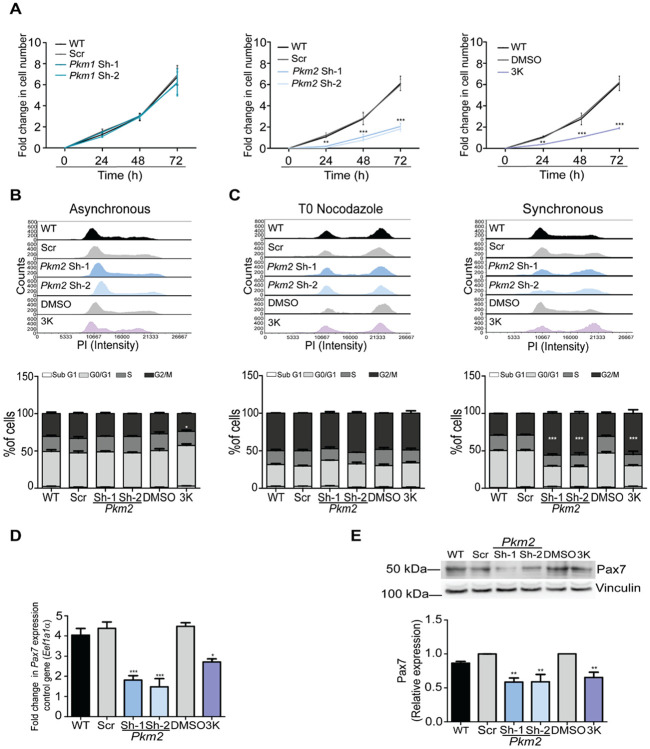
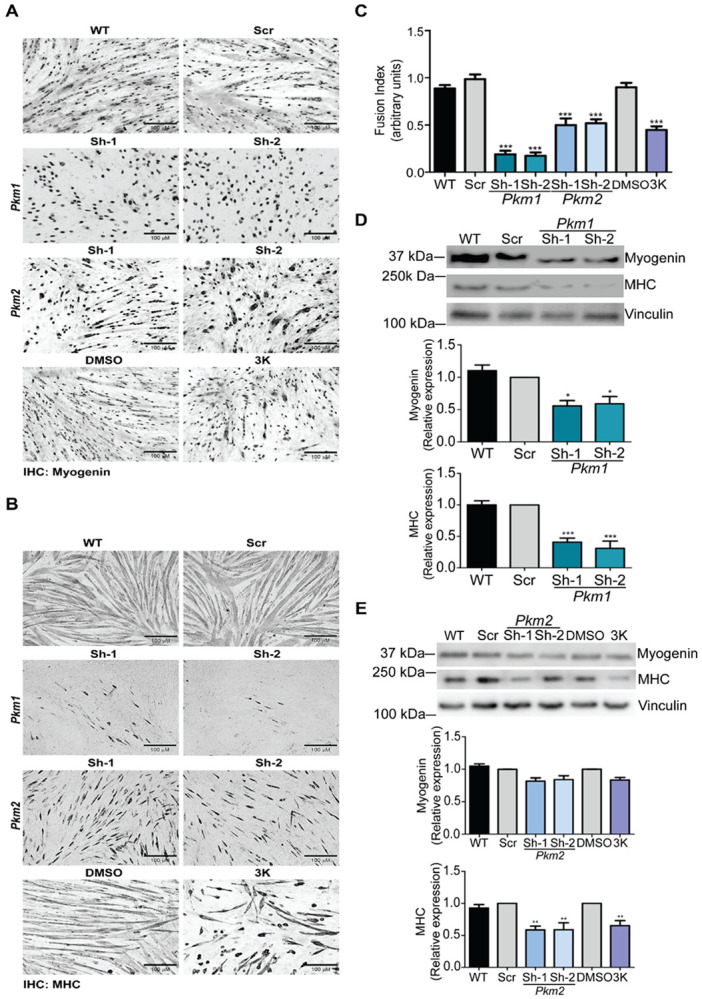
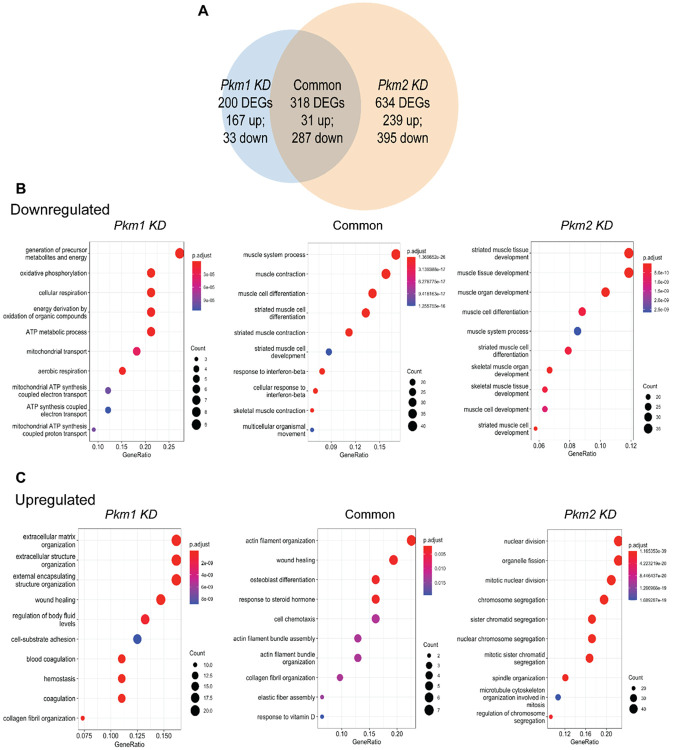
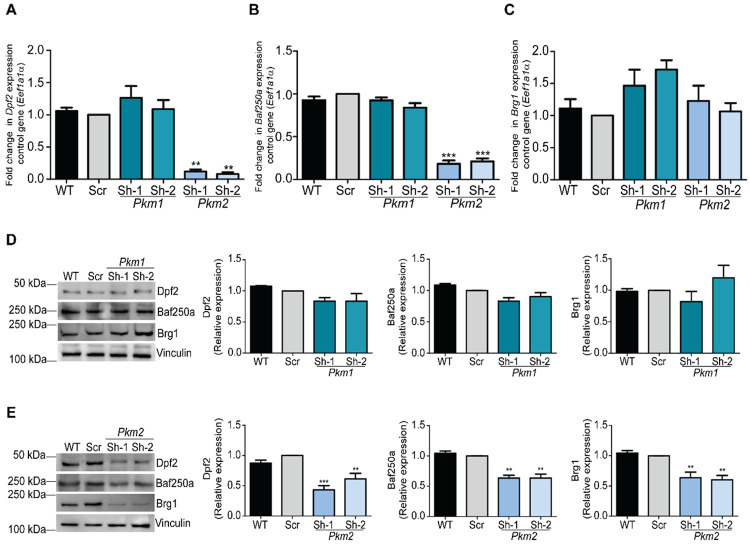
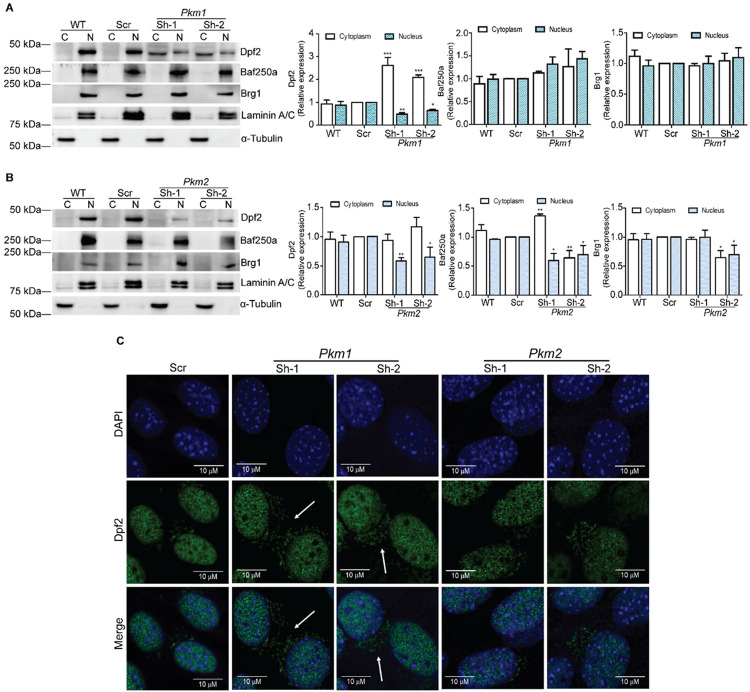
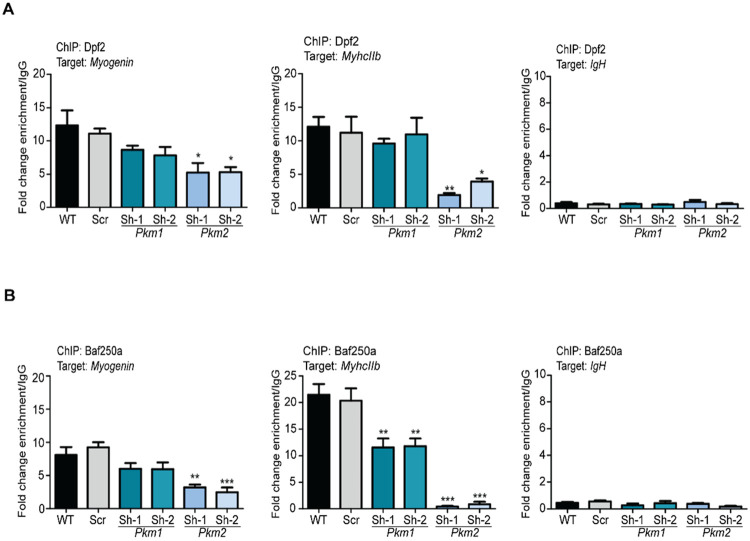
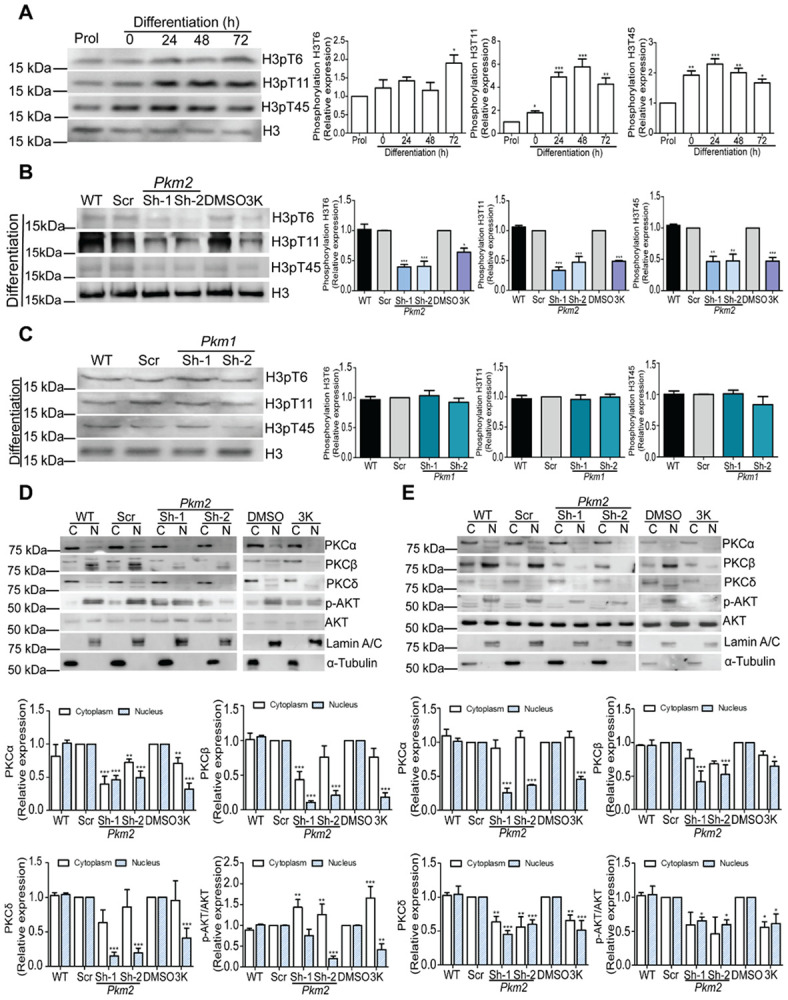
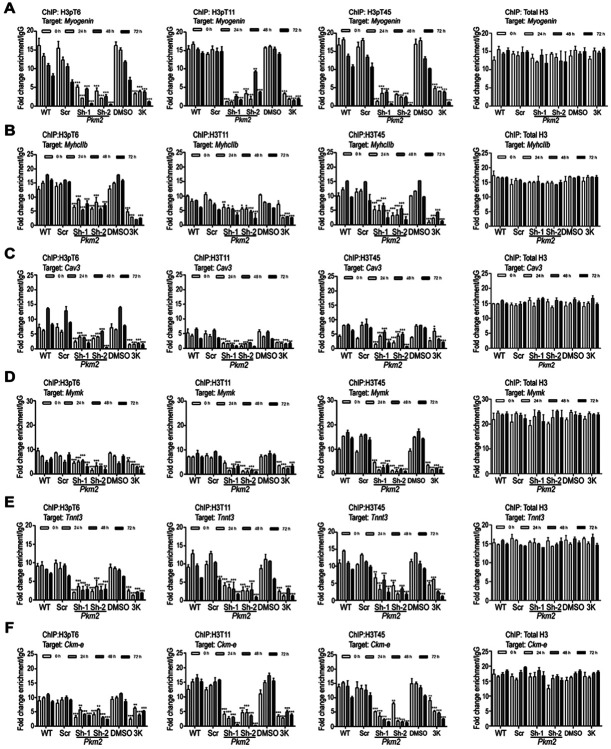
Pyruvate kinase is a glycolytic enzyme that converts phosphoenolpyruvate and ADP into pyruvate and ATP. There are two genes that encode pyruvate kinase in vertebrates; Pkm and Pkl encode muscle- and liver/erythrocyte-specific forms, respectively. Each gene encodes two isoenzymes due to alternative splicing. Both muscle-specific enzymes, Pkm1 and Pkm2, function in glycolysis, but Pkm2 also has been implicated in gene regulation due to its ability to phosphorylate histone 3 threonine 11 (H3T11) in cancer cells. Here, we examined the roles of Pkm1 and Pkm2 during myoblast differentiation. RNA-seq analysis revealed that Pkm2 promotes the expression of Dpf2/Baf45d and Baf250a/Arid1A. Dpf2 and Baf250a are subunits that identify a specific sub-family of the mammalian SWI/SNF (mSWI/SNF) of chromatin remodeling enzymes that is required for activation of myogenic gene expression during differentiation. Pkm2 also mediated the incorporation of Dpf2 and Baf250a into the regulatory sequences controlling myogenic gene expression. Pkm1 did not affect expression but was required for nuclear localization of Dpf2. Additionally, Pkm2 was required not only for the incorporation of phosphorylated H3T11 in myogenic promoters, but also for the incorporation of phosphorylated H3T6 and H3T45 at myogenic promoters via regulation of AKT and protein kinase C isoforms that phosphorylate those amino acids. Our results identify multiple unique roles for Pkm2 and a novel function for Pkm1 in gene expression and chromatin regulation during myoblast differentiation.

Keywords: H3 phosphorylation; Pyruvate kinase; SWI/SNF; chromatin remodeling enzymes; gene regulation; myoblast differentiation.


Conflict of interest statement

CONFLICT OF INTEREST STATEMENT The authors declare no conflicts of interest.

Figures

Figure 1.
Figure 1.. Expression of Pkm1 and Pkm2 during myoblast differentiation.
(A) Representative western blots (left) and quantification of three independent experiments (right) show Pkm1 and Pkm2 expression in proliferating and differentiating myoblasts. Western blots against vinculin were used as loading controls. (B) Subcellular fractionation of differentiating myoblasts was performed to compare Pkm1 and Pkm2 levels in whole cell extract (W) to cytosolic (C) and nuclear (N) fractions. Representative immunoblots (left) and quantification (right) are shown. Immunoblots against Lamin A/C and α-Tubulin were used as controls to show the purity of the fractions. Red asterisks represent molecular-weight size markers. (C-E) Representative Western blots (left) and quantification (right) of Pkm1 and Pkm2 levels in Pkm1 (C), and Pkm2 (D) knockdown samples and 3K inhibitor treated samples (E). Western blots against vinculin were used as loading controls. The samples were compared with the corresponding scrambled and DMSO samples, respectively. For all samples, data are the mean ± SE of three independent biological replicates. **P < 0.01; ***P < 0.001. WT, wild type, Scr, scrambled sequence shRNA.
Figure 2.
Figure 2.. Pkm2 KD impairs myoblast proliferation by dysregulating cell cycle progression and Pax7.
(A) Cell counting assay of proliferating wild type (WT) myoblasts, Scr (scrambled shrRNA), Pkm2 or Pkm1 knockdown or 3K inhibitor-treated samples. (B) Representative histograms of cell cycle progression and the percentage of cells in each cell cycle phase for asynchronously proliferating myoblasts. (C) Representative histograms of cell cycle progression and the percentage of cells in each cell cycle phase in cells arrested in mitosis with nocodazole at the time of release (T0), and 24 h post-release. (D) Steady state mRNA levels of Pax7 in proliferating C2C12 myoblasts determined by qRT-PCR. (E) Representative western blots (top) and quantification (bottom) showing Pax7 expression in Pkm2 KD myoblasts and in myoblasts grown in the presence of the 3K inhibitor. For all samples, data are the mean ± SE of three independent biological replicates. *P < 0.05; **P < 0.01; ***P < 0.001. WT, wild type; Scr; scrambled sequence shRNA.
Figure 3.
Figure 3.. Pkm1 or Pkm2 KD or Pkm2 inhibition impairs myoblast differentiation.
Representative light micrographs of 48 h differentiating myoblasts (WT, Scr, Pkm1 or Pkm2 KD or cultured with the 3k inhibitor), immunostained against (A) myogenin or (B) MHC. (C) The fusion index was calculated from the MHC stained samples. (D-E) Representative immunoblots and quantification of myogenin and MHC levels in Pkm1 knockdown samples (D), and Pkm2 knockdown or Pkm2 inhibited samples (E). For all samples, data are the mean ± SE of three independent biological replicates. *P < 0.05; **P < 0.01; ***P < 0.001. WT, wild-type; Scr; scrambled sequence shRNA.
Figure 4.
Figure 4.. Differential gene expression resulting from Pkm1 or Pkm2 KD during myoblast differentiation.
(A) Venn diagram showing the unique and overlapping differentially expressed genes (DEGs) between differentiating myoblasts KD for Pkm1 and Pkm2 using Scr shRNA samples as control. GO term analysis for downregulated (B) and upregulated (C) genes. Analysis of differentially expressed genes in differentiating C2C12 cells Pkm1 KD (left panel) or Pkm2 KD (right panel) or overlapping common genes (central panel). Cut-off was set at 2.0 of the −log (adjusted p value). See Supp. Table 4 for the complete list of genes.
Figure 5.
Figure 5.. Pkm2 KD downregulates Baf250a and Dpf2 expression in differentiating C2C12 cells.
Steady state mRNA levels of (A) Dpf2, (B) Baf250a, and (C) Brg1, determined by qRT-PCR from 48 h differentiating C2C12 myoblasts. (D) Representative immunoblot (left) and quantification (right) of Dpf2, Baf250a, and Brg1 protein levels in differentiating control cells and Pkm1 KD myoblasts. Immunoblots against vinculin were used as loading controls. (E) As in (D) except Pkm2 KD cells were analyzed, 48 h after inducing myoblast differentiation. The data represent three independent biological experiments. Bar graphs show the mean ± SE. *P < 0.05, **P < 0.01, and ***P < 0.001. WT, wild-type; Scr; scrambled sequence shRNA.
Figure 6.
Figure 6.. Pkm1 regulates the sub-cellular localization of Dpf2 in differentiating C2C12 cells.
Subcellular fractionation of myoblasts differentiated for 48h was performed to compare cytosolic (C), and nuclear (N) fractions. (A-B) Representative immunoblots (left) and quantification (right) of Dpf2, Baf250a, and Brg1 levels in WT and Scr controls as well as in Pkm1 KD (A), and Pkm2 KD cells (B). Immunoblots against Laminin A and α-Tubulin were used as controls to show the purity of the fractions. The data represent three independent biological experiments. Bar graphs show the mean ± SE. *P < 0.05, **P < 0.01 or ***P < 0.001. (C) Confocal images of differentiated C2C12 myoblasts (48 h) immunostained with a specific anti-rabbit antibody against Dpf2 (green). Nuclei stained with DAPI (blue). Scale bar: 10 μm. WT, wild-type; Scr; scrambled sequence shRNA.
Figure 7.
Figure 7.. Pkm1 and Pkm2 differentially regulate the binding of Dpf2 and Baf250a at the Myogenin and MyhcIIb promoters.
ChIP-qPCR showing the binding of (A) Dpf2 or (B) Baf250a to the Myogenin and MyhIIb promoters in differentiating myoblasts. The IgH promoter was used as negative control target for binding. The data was normalized using IgG as a negative control for the ChIP. The data are presented as the mean ± SE from three independent biological experiments. *P < 0.05; **P < 0.01; ***P < 0.001. WT, wild-type; Scr; scrambled sequence shRNA.
Figure 8.
Figure 8.. Pkm2 KD or Pkm2 inhibition decreases both bulk levels of phosphorylated histones H3T6, H3T11, and H3T45 and regulates the kinases that promote the phosphorylation of H3T6 and H3T45.
(A) Representative western blots (left) and quantification (right) show H3T6, H3T11, and H3T45 phosphorylation in proliferating myoblasts and in myoblasts at different stages of differentiation. (B-C) Representative western blots (left) and quantification (right) show H3T6, H3T11, and H3T45 phosphorylation in Pkm2 KD myoblasts or in the presence of the 3K inhibitor (B) or Pkm1 KD (C) in 48 h differentiating myoblasts. Immunoblots against total H3 were used as loading controls. (D-E) Representative western blots (top) and quantification (bottom) show PKCα, PKCβ, PKCδ and p-ATK expression in nuclear (N) and cytoplasmic (C) fractions in proliferating (D) or differentiating (E) myoblasts upon Pkm2 KD or in the presence of the 3K inhibitor. Samples were compared to the corresponding Scr or DMSO sample. The data represent three independent biological experiments. Bar graphs show the mean ± SE. *P < 0.05; **P < 0.01; ***P < 0.001. Prol.; proliferating cells, WT, wild-type; Scr; scrambled sequence shRNA.
Figure 9.
Figure 9.. Pkm2 KD and Pkm2 inhibition decrease the incorporation of phosphorylated histones H3T6, H3T11, and H3T45 at myogenic promoters.
ChIP-qPCR showing binding of phosphorylated H3T6, H3T11, H3T45 or total H3 to the (A) Myogenin, (B) MyHCIIb, (C) Cav3, (D) Mymk, and (E) Tnnt3 promoters and (F) the Ckm enhancer (Ckm-e) in differentiating myoblasts at the indicated times. The ChIP data were normalized using IgG as a control for the ChIP. The data for all experiments represent the mean ± SE of three independent biological experiments. *P < 0.05; **P < 0.01; ***P < 0.001. WT, wild type, Scr, scrambled shRNA.

Similar articles

References

    1. Bentzinger C. F., Wang Y. X., and Rudnicki M. A. (2012) Building muscle: molecular regulation of myogenesis. Cold Spring Harb Perspect Biol 4 - PMC - PubMed
    1. Buckingham M., Bajard L., Chang T., Daubas P., Hadchouel J., Meilhac S., Montarras D., Rocancourt D., and Relaix F. (2003) The formation of skeletal muscle: from somite to limb. J Anat 202, 59–68 - PMC - PubMed
    1. Chal J., and Pourquie O. (2017) Making muscle: skeletal myogenesis in vivo and in vitro. Development 144, 2104–2122 - PubMed
    1. Stern H. M., Brown A. M., and Hauschka S. D. (1995) Myogenesis in paraxial mesoderm: preferential induction by dorsal neural tube and by cells expressing Wnt-1. Development 121, 3675–3686 - PubMed
    1. Tajbakhsh S., Borello U., Vivarelli E., Kelly R., Papkoff J., Duprez D., Buckingham M., and Cossu G. (1998) Differential activation of Myf5 and MyoD by different Wnts in explants of mouse paraxial mesoderm and the later activation of myogenesis in the absence of Myf5. Development 125, 4155–4162 - PubMed

Publication types