[Preprint]. 2024 Apr 9:2024.04.07.588166.
doi: 10.1101/2024.04.07.588166.

Classification and functional characterization of regulators of intracellular STING trafficking identified by genome-wide optical pooled screening

Affiliations

Classification and functional characterization of regulators of intracellular STING trafficking identified by genome-wide optical pooled screening

Matteo Gentili et al. bioRxiv. .

Update in

Abstract

STING is an innate immune sensor that traffics across many cellular compartments to carry out its function of detecting cyclic di-nucleotides and triggering defense processes. Mutations in factors that regulate this process are often linked to STING-dependent human inflammatory disorders. To systematically identify factors involved in STING trafficking, we performed a genome-wide optical pooled screen and examined the impact of genetic perturbations on intracellular STING localization. Based on subcellular imaging of STING protein and trafficking markers in 45 million cells perturbed with sgRNAs, we defined 464 clusters of gene perturbations with similar cellular phenotypes. A higher-dimensional focused optical pooled screen on 262 perturbed genes which assayed 11 imaging channels identified 73 finer phenotypic clusters. In a cluster containing USE1, a protein that mediates Golgi to ER transport, we found a gene of unknown function, C19orf25. Consistent with the known role of USE1, loss of C19orf25 enhanced STING signaling. Other clusters contained subunits of the HOPS, GARP and RIC1-RGP1 complexes. We show that HOPS deficiency delayed STING degradation and consequently increased signaling. Similarly, GARP/RIC1-RGP1 loss increased STING signaling by delaying STING exit from the Golgi. Our findings demonstrate that genome-wide genotype-phenotype maps based on high-content cell imaging outperform other screening approaches, and provide a community resource for mining for factors that impact STING trafficking as well as other cellular processes observable in our dataset.


Conflict of interest statement

Competing Interests P.C.B. is a consultant to or holds equity in 10X Genomics, General Automation Lab Technologies/Isolation Bio, Celsius Therapeutics, Next Gen Diagnostics, Cache DNA, Concerto Biosciences, Stately, Ramona Optics, Bifrost Biosystems, and Amber Bio. His laboratory has received research funding from Calico Life Sciences, Merck, and Genentech for work related to genetic screening. N.H. holds equity in and advises Danger Bio/Related Sciences, is on the scientific advisory board of Repertoire Immune Medicines and CytoReason, owns equity and has licensed patents to BioNtech, and receives research funding from Bristol Myers Squibb and Calico Life Sciences. The Broad Institute and MIT may seek to commercialize aspects of this work, and related applications for intellectual property have been filed. R.J.C. is an employee of Flagship Pioneering.

Figures

Figure 1.
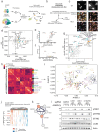
Figure 1.. A genome-wide optical pooled screen identifies genes regulating STING trafficking.
(A) Genome-wide optical pooled screening workflow for high-throughput STING screens. (B) Example fields of view of HeLa cells from the optical pooled screen either unstimulated (top) or stimulated (bottom) with cGAMP for 4 hours. Scale bar 20 μm. (C) Schematic of single-cell support vector machine (SVM) classifiers used to call hits from the genome-wide optical pooled screen using features from the p62 and STING channels. 4hrs indicates cGAMP-stimulated cells that received the genome-wide KO library. 5hrs refers to control cells with non-targeting sgRNAs stimulated with cGAMP for 5 hours. (D-F) Volcano plot of hits from the perturbed vs unperturbed classifier (D), unstimulated classifier (E), increased stimulation classifier (F). Black dots indicate individual non-targeting sgRNAs. (G) Venn diagram showing overlap of top 500 significant hits from each classifier. (H) Genome-wide fitness and flow cytometry screening outlines and mass spectrometry STING interaction screen. (I) Chord diagram showing Pearson correlation between MAIC scores for the top 500 significant hits from each of the STING datasets. Same experimental batch performed on the same day highlighted by the same color in the outer ring. (J) Weighting score for each of the STING datasets provided by the MAIC algorithm. The weighting score given to a dataset is proportional to the average score of the genes belonging to this dataset and genes appearing in multiple datasets score more highly. (K) Scores for each of the top 40 genes in each screening condition.
Figure 2.
Figure 2.. Unsupervised clustering identifies groups of genes that similarly affect STING trafficking.
(A) PHATE plot highlighting top clusters significantly enriched for genes that are less stimulated because they are either more similar to unstimulated non-targeting control cells (clusters 1, 18 - unstimulated classifier) or significantly more similar to non-targeting control cells at 4 hours than at 5 hours (cluster 239). (B) PHATE plot highlighting clusters significantly enriched for genes that have a high or low number of differentially expressed genes in the genome-scale Perturb-seq dataset. (C) PHATE plot highlighting top clusters significantly enriched for genes that are more stimulated than non-targeting control cells (increased stimulation classifier). (D) Autophagy diagram highlighting genes identified in cluster 13 (orange) or 5 (purple). (E) Hierarchically clustered heatmap (clustered using seaborn clustermap with method=‘average’, metric=‘euclidean’), showing features differentiating genes from the two autophagy clusters in (D). (F) Single-cell images of STING and p62 channels randomly selected from non-targeting controls and KO of selected autophagy factors from the genome-wide OPS. (G) Immunoblot of the indicated proteins in control (ntgRNA) or EI24 KO BJ1 fibroblasts stimulated with 1μM diABZI for the indicated times. One representative blot of n=3 independent experiments.
Figure 3.
Figure 3.. Secondary screens with additional dimensions further characterize genes regulating STING trafficking.
(A) Workflow for targeted follow-up STING screens. (B) HeLa secondary screen is high-dimensional along multiple axes. (C) Selected fields of view from secondary screens for BJ1 cells and HeLa cells with or without background subtraction. Scale bar 20 μm. (D) Scatterplot of per-gene mean STING maximum (per cell) in HeLa cells compared to pSTING maximum per cell in BJ1 fibroblasts; black dot at the center of the dashed lines indicates non-targeting controls. Each point represents the average of measurements for each of the 262 targeted genes. (E) Volcano plot of mean STING maximum (per cell) in HeLa cells (deviation from ntgRNAs) and (F) pSTING maximum (per cell) in BJ1 fibroblasts (deviation from ntgRNAs); yellow dots indicate non-targeting control sgRNAs. Each point represents the average of measurements for the STING intensities on the x axis and the Stouffer aggregated p-values on the y axis each of the 262 targeted genes. (G) Correlation between phenotype (calculated as PHATE distance relative to NT sgRNAs) for each perturbed gene in the unstimulated vs 4 hour cGAMP-stimulated condition. (H) Hierarchical clustering based on Euclidean distance of HeLa screen features into 20 distinct modules. Clusters containing at least 40% of features related to a given channel are annotated. (I) PHATE dimensionality reduction and Leiden clustering of genes using as input mean per-gene scores across the 20 modules identified in (G). (J) Cluster 3521 and significant gene ontology (GO) terms as previously described. X axis indicates distinct cell lines. C19orf25 and USE1 are manually highlighted. (K) STRING v11.5 physical subnetwork potential interactions (minimum score = 0.4) with C19orf25; USE1 and C19orf25 are manually highlighted. (L). Immunoblot of the indicated proteins in control (ntgRNA) or USE1 or C19orf25 KO BJ1 fibroblasts stimulated with 1μM diABZI for the indicated times. One representative blot of n=3 experiments.
Figure 4.
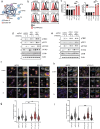
Figure 4.. The HOPS complex subunits VPS11 and VPS33A are required for STING degradation.
(A) STRING network of interaction of the indicated proteins found in Cluster 9 of the dimensionality reduced data shown in Figure 2. (B) mNG levels in 293 T STING-mNG cell lines KO for the indicated genes stimulated with 4μg/ml 2′3′-cGAMP(pS)2 (in medium) for 6h. One representative plot of n=3 independent experiments with n=2 technical replicates per experiment. (C) Percentage of STING-mNG positive cells in cells stimulated as in b. (D) Immunoblot of the indicated proteins in BJ1 fibroblasts transduced with a control guide (ntgRNA) or with VPS11 or VPS33A sgRNAs and stimulated with 0.5μg/ml cGAMP (in perm buffer) for the indicated times. (E) qPCR for IFNβ (left) and IL6 (right) in BJ1 fibroblasts KO for VPS11 (red) or VPS33A (blue) stimulated with 0.5 μg/ml cGAMP (in perm buffer) for 6h. n=3 independent experiments. 2−ΔCt Fold Change calculated as ratio 2−ΔCt sgRNA/2−ΔCt ntgRNA for cells stimulated with cGAMP. One-way ANOVA on log-transformed data with Dunnet multiple comparison test. In all panels, bar plots show mean and error bars standard deviation. Marker unit for Western blots is KDa. *p <0.05,**p <0.01, ***p <0.001,****p < 0.0001, ns not significant.
Figure 5.
Figure 5.. The RAB6 GEF RIC1 and the GARP complex subunit VPS52 regulate STING Golgi exit.
(A) STRING network of interaction of the indicated proteins found in Cluster 9 of the dimensionality reduced data shown in Figure 2. (B) mNG levels in 293 T STING-mNG cell lines KO for the indicated genes stimulated with 4μg/ml 2′3′-cGAMP(pS)2 (in medium) for 6h. One representative plot of n=3 independent experiments with n=2 technical replicates per experiment. (C) Percentage of STING-mNG positive cells in cells stimulated as in B/ (D) Immunoblot of the indicated proteins in BJ1 fibroblasts transduced with a control guide (ntgRNA) or with RIC1 sgRNAs and stimulated with 1μM diABZI for the indicated times. (E) Same as in D for VPS52 KO cells. (F) Immunofluorescence of DAPI (blue), GM130 (magenta) and STING (yellow) in control (ntgRNA) or RIC1 KO BJ1 fibroblasts stimulated with 1μM diABZI for the indicated times. One field representative of n≥3 in n=3 independent experiments. (G) STING mean intensity calculated in GM130 (Golgi) regions in cells as in f. Each dot represents an individual Golgi. (H) Same as in e for VPS52 KO cells. (I) STING mean intensity calculated in GM130 (Golgi) regions in cells as in H. Each dot represents an individual Golgi. In all panels, bar plots show mean and error bars standard deviation. Marker unit for Western blots is KDa. *p <0.05,**p <0.01, ***p <0.001,****p < 0.0001, ns not significant.

References

    1. Motwani M., Pesiridis S., and Fitzgerald K.A. (2019). DNA sensing by the cGAS-STING pathway in health and disease. Nat. Rev. Genet. 20, 657–674. - PubMed
    1. Samson N., and Ablasser A. (2022). The cGAS-STING pathway and cancer. Nat Cancer 3, 1452–1463. - PubMed
    1. Skopelja-Gardner S., An J., and Elkon K.B. (2022). Role of the cGAS-STING pathway in systemic and organ-specific diseases. Nat. Rev. Nephrol. 10.1038/s41581-022-00589-6. - DOI - PMC - PubMed
    1. Yang K., Tang Z., Xing C., and Yan N. (2023). STING signaling in the brain: Molecular threats, signaling activities, and therapeutic challenges. Neuron. 10.1016/j.neuron.2023.10.014. - DOI - PMC - PubMed
    1. Ishikawa H., and Barber G.N. (2008). STING is an endoplasmic reticulum adaptor that facilitates innate immune signalling. Nature 455, 674–678. - PMC - PubMed

Publication types