[Preprint]. 2024 Apr 13:2024.04.09.588427.
doi: 10.1101/2024.04.09.588427.

Microbiota-derived inosine programs protective CD8+ T cell responses against influenza in newborns

Affiliations

Microbiota-derived inosine programs protective CD8+ T cell responses against influenza in newborns

Joseph Stevens et al. bioRxiv. .

Update in

Abstract

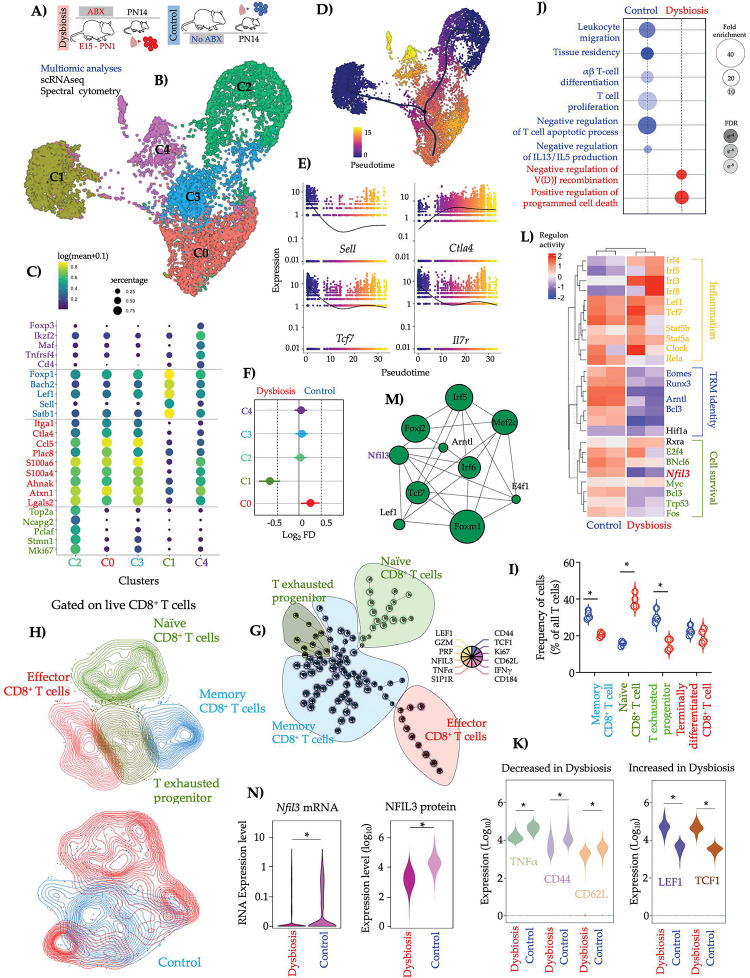
The immunological defects causing susceptibility to severe viral respiratory infections due to early-life dysbiosis remain ill-defined. Here, we show that influenza virus susceptibility in dysbiotic infant mice is caused by CD8+ T cell hyporesponsiveness and diminished persistence as tissue-resident memory cells. We describe a previously unknown role for nuclear factor interleukin 3 (NFIL3) in repression of memory differentiation of CD8+ T cells in dysbiotic mice involving epigenetic regulation of T cell factor 1 (TCF 1) expression. Pulmonary CD8+ T cells from dysbiotic human infants share these transcriptional signatures and functional phenotypes. Mechanistically, intestinal inosine was reduced in dysbiotic human infants and newborn mice, and inosine replacement reversed epigenetic dysregulation of Tcf7 and increased memory differentiation and responsiveness of pulmonary CD8+ T cells. Our data unveils new developmental layers controlling immune cell activation and identifies microbial metabolites that may be used therapeutically in the future to protect at-risk newborns.


Conflict of interest statement

Declaration of Interest: The authors declare no competing interests.

Figures

Fig. 1
Fig. 1. Infant mice exposed to perinatal ABX mount less robust lung localized CD8+ T cell responses to influenza A.
A) Experimental approach. Pregnant C57/B6 dams were treated with a cocktail of antimicrobials from embryonic day (E) 15 to postnatal day (PN) 5 (dysbiosis) or with saline (control). Infant mice in each experimental group were challenged with a sublethal dose of murine-adapted influenza A H1N1 strain-PR8, expressing OVA257–264 epitope (PR8-OVA) [102 TCID50] via the intranasal (i.n.) route on PN14. B) Weight change (n=6, * p-values < 0.05, one-way ANOVA with Tukey’s correction for multiple comparisons. Solid lines, mean; dotted lines, quartiles). C) Flow cytometry analysis of single-cell lung suspension from infant mice ten days post-infection (d.p.i.). Representative bi-axial plots. The proportion of OVA257–264 specific CD8+ T cells (mean ± SEM) is indicated. D) Proportion of OVA257–264 specific (tetramer+) CD8+ T cells in lungs or E) mediastinal lymph nodes at 7 d.p.i or F) lungs at 14 d.p.i. [n=5–6, * indicated p-values < 0.05, Student’s t-test, Solid lines, mean; dotted lines, quartiles]. G) Infant mice in each experimental group previously challenged with PR8-OVA were allowed to recover for six weeks and challenged with either PR8-OVA [103 TCID50] or heterotypic, influenza A-strain H3N2 [104 TCID50] or sham (uninfected) via i.n. route. In some experiments, age-matched mice not previously challenged with influenza during infancy (Naïve) were used. Animals were treated with fluorescent-labeled anti-CD45 antibody (Ab) via the intravenous route (i.v.) at 10 d.p.i. Thirty minutes after i.v. injection, animals were euthanized, and single-cell lung suspension was analyzed by flow cytometry H) Representative bi-axial plots. The proportion of extravascular or intravascular OVA257–264 specific CD8+ T cells (mean ± SEM) is indicated. I) Proportion of extravascular OVA257–264 specific CD8+ T cells in indicated experimental groups. [n = 7, * indicated p-values < 0.05, Student’s t-test, Solid lines, mean; dotted lines, quartiles]. J) Weight change after challenge with PR8-OVA or K) H3N2 (n=4–5, * p-values < 0.05, one-way ANOVA with Tukey’s correction for multiple comparisons. Solid lines, mean; dotted lines, quartiles). L) Experimental Approach. Pregnant OT-1 transgenic dams, on either CD90.1 or CD45.1 background, were treated with a cocktail of antimicrobials as described in Fig. 1A. Equal numbers of OT-1 CD8+ T cells from control (CD45.1) or dysbiotic (CD90.1) donors (PN14) were labeled with CFSE and adoptively co-transferred into age-matched recipient mice. Twelve hours later, the recipient mice were challenged with influenza [PR8-OVA, 102 TCID50]. M) Flow cytometry analysis of single-cell suspension from either lung, mediastinal lymph nodes, or spleen infant mice seven days post-infection (d.p.i.). Representative bi-axial plots. The proportion of OT-1 CD8+ T cells from either control (CD45.1) or dysbiotic (CD90.1) host infant mice (mean) is indicated. N) Proportion of adoptively transferred OT-1 CD8+ T cells in lungs or O) mediastinal lymph nodes of recipient infant mice at 10 d.p.i [Solid lines, mean; dotted lines, quartiles, n=5, * indicated p-values < 0.05, Student’s t-test]. P) Representative histogram of computationally modeled CFSE peaks corresponding to cell divisions in OT-1 CD8+ T cells at indicated times post-infection and Q) proliferation index of control (CD45.1) or dysbiotic (CD90.1) OT-1 cells in recipient mouse at 10 d.p.i. (Solid lines, mean; dotted lines, quartiles, n=6, *indicated p-values < 0.05, one-way ANOVA with Tukey’s correction for multiple comparisons). R) Representative histogram of CD44 expression in OT-1 CD8+ T cells and S) Proportion of CD44hi or T) KLRGhi control (CD45.1) or dysbiotic (CD90.1) OT-1 cells in individual recipient mice at indicated cell divisions. [Solid lines, mean; dotted lines, quartiles, n=5, *indicated p-values < 0.05, one-way ANOVA with Tukey’s correction for multiple comparisons]. U) Proportion of INF γ + cells or V) extravascular OVA257–264 specific control (CD45.1) or dysbiotic (CD90.1) TRM cells [n=6, * p-values < 0.05, Student’s t-test. Solid lines, mean; dotted lines, quartiles]. W) Infant B6 mice were adoptively transferred with OT-1 CD8+ T cells from age-matched control (CD45.1) or dysbiotic (CD90.1) infants on PN14. Twelve hours later, the recipient mice were challenged with influenza [PR8-OVA, 102 TCID50]. X) Weight change was determined at indicated time points [n=6, * p-values < 0.05, one-way ANOVA with Tukey’s correction for multiple comparisons. Solid lines, mean; dotted lines, quartiles].
Fig. 2:
Fig. 2:. Cell-intrinsic defects in the generation of lung-localized effector T cells in dysbiotic infants.
A) Lung from control and dysbiotic infant mice (n=4, 2 in each group) was obtained at 7 days post-infection (d.p.i). Lung samples were dissociated into cell suspensions, magnetically enriched (EPCAMCD31CD45+CD8+) and used for single-cell RNA sequencing (scRNAseq). B) Uniform manifold approximation and projection (UMAP) embedding of all samples (n~9000 cells) colored by cell clusters was performed on scRNAseq data. C0: terminally differentiated effector CD8+ T cells, C1: naive-like CD8+ T cells C2: CD8+ T exhausted progenitor characterized. C3: effector-memory CD8+ T cells. C4: regulatory T cells. C) Scaled expression of genes unique to each cluster. Bubble size represents the percentage of cells expressing the gene, and the color intensity represents the log (mean expression +0.1) [Benjamini and Hochberg-adjusted p-values < 0.01, log2 fold change > 2, Wald’s test]. D) UMAP embedding of all samples colored by pseudo time with overlaid trajectory and E) scatter plots showing expression of Sell, Ctla4, Tcf7 and Il7r across pseudo time. F) Proportion of clusters in dysbiotic and control samples showing predominance of naïve-like CD8+ T cells (C1) in dysbiotic mice and terminally differentiated effector CD8+ T cells (C0) in controls. Lines indicate 95% confidence intervals. G) Unsupervised analysis of live, single live CD8 T+ cells using a self-organizing map (SOM). CD8+ T cell clusters identified by SOM were mapped to H) uniform manifold approximation and projection (UMAP) embedding and colored by naïve, effector, memory, and exhausted progenitor clusters. I) The proportion of memory or naïve or exhausted progenitor or effector CD8+ T cells in control and dysbiotic infant lungs at ten d.p.i. [n=6, * indicated p-values < 0.05, NS – not significant. One-way ANOVA with Tukey’s correction for multiple comparisons. Solid lines, mean; dotted lines, quartiles). J) Gene Ontology (GO) terms associated with DEG in in control and dysbiotic mice. [Benjamini-Hochberg-corrected p-values < 0.05 (one-sided Fisher’s exact test) are shown and colored by gene ratio]. K) MFI of indicated markers in live CD8+ T cells from control or dysbiotic infant lungs [n=6 per group, * indicated p-values < 0.05, one-way ANOVA with Tukey’s correction for multiple comparisons. Solid lines, mean; dotted lines, quartiles]. L) Row-scaled regulon activity for all samples. k-means clustering was used to arrange clusters and regulons [Benjamin and Hochberg-adjusted p-values < 0.01]. Regulons related to TRM identity, cell survival, and inflammation are highlighted. M) Network diagram showing the core regulator relationship, with the circle size indicating # of regulated genes. N) Average Nfil3 expression (left) or NFIL3 MFI (right) in CD8+ T cells from control or dysbiotic infant lung, at seven d.p.i. [Benjamini and Hochberg-adjusted p-values < 0.01].
Fig. 3:
Fig. 3:. T cell-specific deletion of NFIL3 remodels the lung-localized CD8+ T cell compartment with a dominant naive T cell signature and relative lack of memory-like and effector T cells.
A) Experimental approach. Transgenic dLckcre and Nfil3flox on C57Bl/6J background mice were crossbred. dLckΔNfil3 and control littermate infant mice were challenged with a sublethal dose of murine-adapted influenza A H1N1 strain-PR8, expressing OVA257–264 epitope (PR8-OVA) [102 TCID50] via the intranasal route on PN14. B) Unsupervised analysis of live, single live CD8 T+ cells using a self-organizing map (SOM). CD8+ T cell clusters identified by SOM were mapped to uniform manifold approximation and projection (UMAP) embedding and colored by naïve, effector, memory, and exhausted progenitor clusters (on left) and by genotype (right). CD8+ T cells from dLckΔNfil3 infant lungs are colored blue, whereas CD8+ T cells from dLckcre infant lungs are colored red. C) The proportion of memory or naïve or exhausted progenitor or effector CD8+ T cells in lungs of dLckΔNfil3 and dLckcre CD8+ T cells [n=8, * indicated p-values < 0.05, one-way ANOVA with Tukey’s correction for multiple comparisons. Solid lines, mean; dotted lines, quartiles]. D) Mean fluorescent intensity (MFI) of key phenotypic markers in live lung CD8+ T cells from dLckΔNfil3 or dLckcre infant mice [* indicated p-values < 0.05, one-way ANOVA with Tukey’s correction for multiple comparisons. Solid lines, mean; dotted lines, quartiles]. E) Experimental approach. Infant B6 mice were treated with anti-CD8α antibody (Ab) on PN12 to deplete endogenous CD8+ T cells and received adoptive transfer of CD8+ T cells from age-matched dLckcre or dLckΔNfil3 infants on PN14. F) Representative histogram of CFSE expression in CD8+ T cells and G) computationally modeled CFSE peaks corresponding to cell divisions in CD8+ T cells. H) Proliferation index of CD8+ T cells from lungs of dLckΔNfil3 or dLckcre infant mice in recipient mouse, five days after transfer [Solid lines, mean; dotted lines, quartiles, n=6, *indicated p-values < 0.05, Student’s t-test]. I) Representative biaxial plots of KLRG1 and CFSE expression in CD8+ T cells in recipient mice at indicated cell divisions or J) Representative histogram of KLRG1 expression in CD8+ T cells in recipient mice at indicated cell divisions. K) Proportion of KLRG1hi CD8+ T cells from lungs of dLckΔ Nfil3 or dLckcre infant mice recipient mouse at indicated cell divisions. [Solid lines, mean; dotted lines, quartiles, n=5, *indicated p-values < 0.05, one-way ANOVA with Tukey’s correction for multiple comparisons]. L) Proportion of OVA257–264 specific CD8+ T cells or M) IFNγ+ OVA257–264 specific CD8+ T cells or N) OVA257–264 specific TRM cells in lungs of dLckΔNfil3 and dLckcre infant mice [n=5, * indicated p-values < 0.05, Student’s t-test. Solid lines, mean; dotted lines, quartiles]. O) Chromatin Immuno-Precipitation with sequencing (ChiPseq) of CD8+ T cells isolated from lungs of control or dysbiotic infant mice at PN14 days with anti-NFIL3 antibody. Heat map of the NFIL3 ChIP-seq signals around transcription start site (TSS) compared to the random genomic control in CD8+ T cells from indicated infant mice. P) Denovo motifs identified by HOMER. Q) Gene Ontology (GO) terms associated with NFIL3 peaks. [Benjamini-Hochberg-corrected p-values < 0.05 (one-sided Fisher’s exact test) are shown and colored by gene ratio]. R) NFIL3 ChIP-seq or ENCODE-identified cis-regulatory elements (CRE) in Tcf7 loci or S) Lef1 loci in CD8+ T cells from lungs of control compared to dysbiotic mice. T) Fold enrichment of H3K4me3 binding at ENCODE-identified CRE in Tcf7 or U) Lef1 promoter in indicated experimental groups. [n=3, * indicated p-values < 0.05, one-way ANOVA with Tukey’s correction for multiple comparisons. Solid lines, mean; dotted lines, quartiles].
Fig. 4:
Fig. 4:. Cell-intrinsic defects in the generation of lung-localized effector T cells in dysbiotic human infants.
A) Enriched (CD45+CD3ε +) single-cell suspension from control and dysbiotic human infants (n=4, 2 in each group) were used for single-cell RNA sequencing (scRNAseq). B) Uniform manifold approximation and projection (UMAP) embedding of all samples (n~6000 cells) colored by cell clusters. C) Scaled expression of genes unique to each cluster. Bubble size represents the percentage of cells expressing the gene, and the color intensity represents the log (mean expression +0.1) [Benjamini and Hochberg-adjusted p-values < 0.01, log2 fold change > 2, Wald’s test]. D) Proportion of clusters in dysbiotic and control samples showing predominance of CD8 TRM in controls. Solid lines represent 95% confidence interval. E) Gene Ontology (GO) terms associated with DEG in control or dysbiotic infants. [Benjamini-Hochberg-corrected p-values < 0.05 (one-sided Fisher’s exact test) are shown and colored by gene ratio]. F) Heatmap plot showing Spearman correlation of paired transcriptional profiles of control and dysbiotic human infants and control and dysbiotic infant mice. H) Enriched (CD45+CD3ε +) single-cell suspension from control and dysbiotic human infants were analyzed by flow cytometry. I) Representative biaxial plots. Proportion of CD45RA+CD45RO CD8+ T cells or tetramer+ CD8+ T cells, co-expressing residency markers, CD103 and CD69 in indicated. J) Proportion of CD45RA+CD45RO CD8+ T cells or K) Tetramer+ CD69+CD103+ CD8+ T cells (TRM) in dysbiotic and control human infants [Solid lines, mean; dotted lines, quartiles, n=6, *indicated p-values < 0.05, student’s t test]. L) Enriched (CD45+CD3ε +) single-cell suspension from control and dysbiotic human infants were co-incubated with M158–66 (GILGFVFTL) peptide and anti-CD28 mAb, followed by stimulation with IL-2 and analyzed by flow cytometry after seven days. M) Representative biaxial plots. Proportion of tetramer+ CD8+ T cells or CD8+ T cells co-expressing Ki67 or IFNγ is indicated. N) Proportion of KI67+ CD8+ T cells or O) INFγ+ CD8+ T cells in dysbiotic and control human infants [Solid lines, mean; dotted lines, quartiles, n=5, *indicated p-values < 0.05, Student’s t test].
Fig. 5:
Fig. 5:. Microbiome-derived inosine is essential for robust lung-localized anti-viral response and NFIL3-directed remodeling of the lung-T cell compartment.
A) Experimental approach. Fecal samples from control and dysbiotic humans and intestinal contents from control or dysbiotic infant mice samples were subjected to shotgun metagenomics and targeted metabolomics to quantify differences in microbiota taxonomy and function. B) Linear discriminant analysis effect size showing the differentially abundant clades between dysbiotic and control infant mice with an abundance of Bifidobacteria and Lactobacilli genera in controls and Proteobacteria in dysbiotic infant mice. C) Linear discriminant analysis effect size showing the differentially abundant clades between dysbiotic and control infant humans with an abundance of Bifidobacterium in controls and Proteobacteria in dysbiotic infant humans. D) Volcano plot depicting the abundance of various metabolites in plasma of dysbiotic and control infant mice. E) Enriched (CD3ε+ CD8+) single-cell suspension from control and dysbiotic infant mice were co-incubated with inosine with or without an A2AR antagonist (ZM241385). F) Representative histogram of NFIL3 expression on CD8+ T cells in indicated experimental groups. Proportion of NFIL3+ CD8+ T cells is indicated. G) Mean fluorescent intensity (MFI) of TCF1 or H) LEF1 in CD8+ T cells in indicated experimental groups. [* indicated p-values < 0.05, n=5, Student’s t-test. Solid lines, mean; dotted lines, quartiles]. I) Representative histogram of CFSE expression and J) proportion of proliferating CD8+ T cells or K) IFNγ+ CD8+ T cells in indicated experimental groups [n=5, * indicated p-values < 0.05, one-way ANOVA with Tukey’s correction for multiple comparisons. Solid lines, mean; dotted lines, quartiles]. L) Representative histogram of phosphorylated CREB (pCREB) expression. Proportion of pCREB+ CD8+ T cells is indicated. M) Experimental approach. Pregnant C57/B6 dams were treated with a cocktail of antimicrobials from embryonic day (E) 15 to postnatal day (PN) 5 (dysbiosis) or with saline (control). Infant mice in each experimental group were treated with inosine (300 μg g−1) on PN10,12 and 14 via intraperitoneal route and subsequently challenged with a sublethal dose of murine-adapted influenza A H1N1 strain-PR8, expressing OVA257–264 epitope (PR8-OVA) [102 TCID50] via the intranasal (i.n.) route on PN14. N) Fold enrichment of H3K4me3 binding at ENCODE-identified CRE in Tcf7 promoter in lung CD8+ T cells in indicated experimental groups. [n=3, * indicated p-values < 0.05, one-way ANOVA with Tukey’s correction for multiple comparisons. Solid lines, mean; dotted lines, quartiles]. O) Fold change in Tcf7 transcripts in lung CD8+ T cells in indicated experimental groups. [n=3, * indicated p-values < 0.05, one-way ANOVA with Tukey’s correction for multiple comparisons. Solid lines, mean; dotted lines, quartiles]. P) Proportion of OVA257–264 specific CD8+ T cells in lungs [n=5, * indicated p-values < 0.05, one-way ANOVA with Tukey’s correction for multiple comparisons. Solid lines, mean; dotted lines, quartiles] or Q) weight change in indicated experimental groups (n=6, * p-values < 0.05, one-way ANOVA with Tukey’s correction for multiple comparisons. Solid lines, mean; dotted lines, quartiles).

References

    1. Li Y. et al. , Global, regional, and national disease burden estimates of acute lower respiratory infections due to respiratory syncytial virus in children younger than 5 years in 2019: a systematic analysis. Lancet 399, 2047–2064 (2022). - PMC - PubMed
    1. Billingham R. E., Brent L., Medawar P. B., Actively acquired tolerance of foreign cells. Nature 172, 603–606 (1953). - PubMed
    1. Gammon G. et al. , Neonatal T-cell tolerance to minimal immunogenic peptides is caused by clonal inactivation. Nature 319, 413–415 (1986). - PubMed
    1. Smith N. L. et al. , Rapid proliferation and differentiation impairs the development of memory CD8+ T cells in early life. J Immunol 193, 177–184 (2014). - PMC - PubMed
    1. Zens K. D. et al. , Reduced generation of lung tissue-resident memory T cells during infancy. J Exp Med 214, 2915–2932 (2017). - PMC - PubMed

Publication types