[Preprint]. 2024 Apr 1:rs.3.rs-4049577.
doi: 10.21203/rs.3.rs-4049577/v1.

Non-Invasive Label-free Analysis Pipeline for In Situ Characterization of Differentiation in 3D Brain Organoid Models

Affiliations

Non-Invasive Label-free Analysis Pipeline for In Situ Characterization of Differentiation in 3D Brain Organoid Models

Caroline Filan et al. Res Sq. .

Update in

Abstract

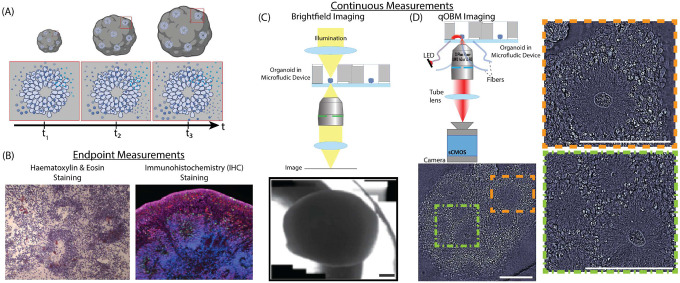
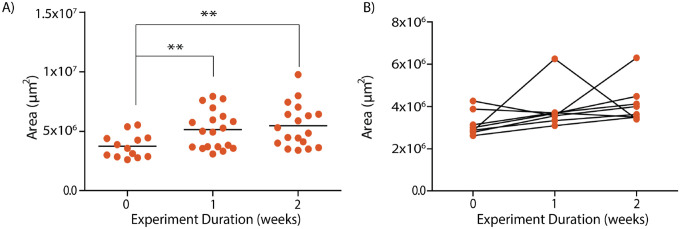
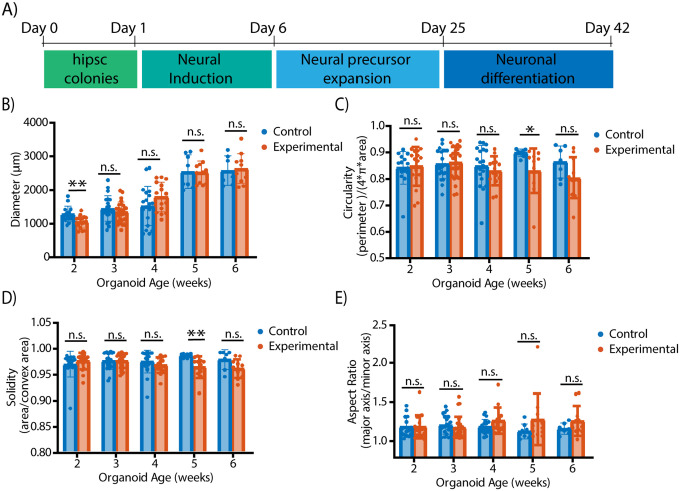
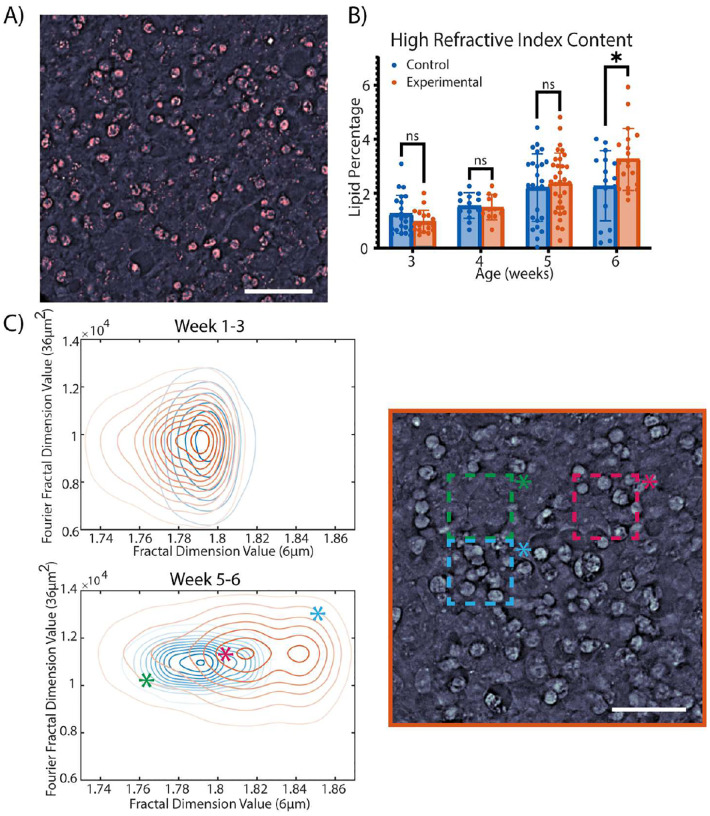
Brain organoids provide a unique opportunity to model organ development in a system similar to human organogenesis in vivo. Brain organoids thus hold great promise for drug screening and disease modeling. Conventional approaches to organoid characterization predominantly rely on molecular analysis methods, which are expensive, time-consuming, labor-intensive, and involve the destruction of the valuable 3D architecture of the organoids. This reliance on end-point assays makes it challenging to assess cellular and subcellular events occurring during organoid development in their 3D context. As a result, the long developmental processes are not monitored nor assessed. The ability to perform non-invasive assays is critical for longitudinally assessing features of organoid development during culture. In this paper, we demonstrate a label-free high-content imaging approach for observing changes in organoid morphology and structural changes occurring at the cellular and subcellular level. Enabled by microfluidic-based culture of 3D cell systems and a novel 3D quantitative phase imaging method, we demonstrate the ability to perform non-destructive high-resolution imaging of the organoid. The highlighted results demonstrated in this paper provide a new approach to performing live, non-destructive monitoring of organoid systems during culture.


Conflict of interest statement

Additional Declarations: No competing interests reported. The authors declare no competing interests

Figures

Figure 1.
Figure 1.
Conventional and Proposed Organoid Analysis Pipeline: (A) schematic of organoid growth over time, including increase in size–which can be monitored with brightfield–and development of neuro-progenitor structures with cells eminating from the center–which can be observed with qOBM. (B) conventional endpoint analyses including Haematoxylin & Eosin (H&E) staining and immunohistochemistry (IHC) staining. (C) schematic of brightfield imaging of the organoids in the custom microfluidic devices with a representative image. (D) schematic of the qOBM imaging system used for the organoids in the microfluidic device. Bottom contains a 20X image. Right insets contain 40X images of the indicated regions in the 20X image. Scale bars are 200 μm.
Figure 2.
Figure 2.
Characterization of organoid growth via brightfield imaging. (A) Characterization of the area of all organoids cultured in the microfluidic platform with device height of 7.5mm. Significance was calculated using a two-tailed unpaired t-test with Welch-correction for two groups. (B) Subset of data in (A) showing longitudinal changes in area of organoids grown in the microfluidic platform. N=6 organoids from both the control and experimental groups.
Figure 3.
Figure 3.
Whole-organoid morphology brightfield analysis of organoids with TSC mutations and healthy controls. (A) Schematic of protocol for TSC organoid culture. (B-D). Quantification of brightfield metrics related to organoid shape and size of the control organoids (left) and the experimental organoids (right); aspect ratio (B), circularity (C), diameter (D), and solidity (E). Images were taken using the microfluidic device. N = 15 organoids (control) and N= 17 organoids (experimental) for Week 2, N = 21 organoids (control), N = 27 organoids (experimental) for Week 3, N = 19 organoids (control), N = 15 organoids (experimental) for Week 4, N = 8 organoids (control), N = 11 organoids (experimental) for Week 5, N= 7 organoids (control), N = 11 organoids (experimental) for Week 6. Using a two-tailed unpaired t-test with Welch-correction for the 2 groups. Data is representative of 4 independent experiments with 6–8 organoids from each experiment group per experiment. Due to limited sample availability, data were pooled from both microfluidic and conventional cultures. Week 1 - Week 4 data: combination of microfluidic and conventional culture. Week 4- Week 5 data: microfluidic culture only. Organoids with low quality brightfield images were discarded from the analysis.
Figure 4.
Figure 4.
Low magnification (20X) qOBM imaging of the two experimental groups reveals differences in cell morphologies on the surface of the organoid. (A) Representative qOBM images showing several folds within experimental group organoids and control organoids at day 15 (week 2). Scale bar: 200 μm. (B) A representation of how the folds present in day 30 organoids (week 4). Right image shows a zoomed-in region with directional cells around the folding lines. (C) shows the presence of fissures over time, with the control organoids showing a decrease in fissures throughout development. Experimental group organoids do not show the same level of decrease. (D) represents the values of the fractal features for the 7 μm and 20 μm patterns corresponding to the elongated cells along the fissures. These values follow the same trend in the controls and experimental organoids as exhibited in (C). Significant differences exist between the control and experimental group organoids post- exposure to neuronal differentiation media. (E) shows the distribution of fractal values before and after culture in neuronal differentiation media to demonstrate the decrease of directional cells among the control group. They also contain images to show how different fractal values appear within the distribution. The selected images are border regions that contain both directional and circular cells. Significance was calculated using a two-tailed unpaired t-test with Welch-correction for two groups. All scale bars are 100μm.
Figure 5.
Figure 5.
A demonstration of rosettes in the organoid. (A) (left) shows a control organoid with no surface-level rosettes and (right) shows a TSC organoid with 10 rosettes visible in the field of view. (B) shows that the TSC-experimental organoids demonstrated a statistically significantly higher number of rosettes on the surface of the organoid at all time points after Week 3. (C) shows the segmentation of 4 different rosettes. From left to right, they show a pair of rounded rosettes with the lumen centered, an irregularly shaped rosette with a centered lumen, a rounded rosette with a lumen not centered, and an irregularly shaped rosette with an uncentered lumen. (D) shows the circularity of rosettes over time. Note the larger variance in the TSC rosette circularity compared to the controls. (E) shows the distance between the center of the rosettes and the center of the lumen. Note how the lumen is less centered in the TSC-experimental rosettes than in the controls and how those differences increase over time. Significance was calculated using a two-tailed unpaired t-test with Welch-correction for two groups. All scale bars are 100 μm.
Figure 6.
Figure 6.
Analysis of cell content using refractive index information. (A) shows qOBM segmentation with pink as the segmented high RI material. (B) shows the lipid data shows the percentage of the organoid composed of lipids. We note the growth over time with significant differences between the control and TSC organoids in Week 6 of organoid culture. (C) shows the distribution of fractal values with higher values representing repeated pattern values. The heat maps show the distribution of the linear fractal pattern (x-axis) and the 2D circular fractal pattern (y-axis) pre-and-post-exposure to neuronal differentiation medium. The image on the right exhibits sample regions and the corresponding fractal values in an experimental organoid growing in neuronal differentiation medium. Significance was calculated using a two-tailed unpaired t-test with Welch-correction for two groups. All scale bars are 50μm
Figure 7.
Figure 7.
Histological assessment reveals similar cell morphologies and lipid content differences in experimental and control organoids to non-invasive imaging. (A) Top: Representative Oil Red O images of organoid sections showing lipid droplets (red, indicted by yellow asterisks) at day 24 for experimental (1st column) and control (2nd column) samples. Bottom: Representative Oil Red O images of organoid sections showing lipid droplets (red, indicated by yellow asterisks) at day 42 for experimental (1st column) and control (2nd column) samples. Slices were counterstained with Hematoxylin. The brightness and contrast of images were adjusted for visualization. Scale bar:40 μm. (B) Schematic showing the image processing pipeline for quantifying ORO particles in the organoid sections (C) Quantification of ORO-positive particles in organoid sections of experimental group organoids (left) and control organoids (right) at two different time points: day 24 and day 42. Using a two-tailed unpaired t-test with Welch-correction for 2 groups. D24: 112 images from 17 sections (control) and 75 images from 20 sections (experimental). D42: 81 images from 25 sections (control) and 71 from 22 sections (experimental).

Similar articles

References

    1. Lancaster M. A. & Knoblich J. A. Cerebral organoids model human brain development and microcephaly. Nature 350, 373–379, DOI: 10.1038/nature12517 (2013). - DOI - PMC - PubMed
    1. Blair J. D., Hockemeyer D. & Bateup H. S. Genetically engineered human cortical spheroid models of tuberous sclerosis. Nat. Medicine 24, 1568–1578, DOI: 10.1038/s41591-018-0139-y (2018). - DOI - PMC - PubMed
    1. Kim N.-S. et al. Pharmacological rescue in patient ipsc and mouse models with a rare disc1 mutation. Nat Commun 12, DOI: 10.1038/s41467-021-21713-3 (2021). - DOI - PMC - PubMed
    1. Groveman B. R. et al. Human cerebral organoids as a therapeutic drug screening model for creutzfeldt–jakob disease. Sci Rep 11, DOI: 10.1038/s41598-021-84689-6 (2021). - DOI - PMC - PubMed
    1. Qian X. et al. Brain-region-specific organoids using mini-bioreactors for modeling zikv exposure. Cell 165, 1238–1254, DOI: 10.1016/j.cell.2016.04.032 (2016). - DOI - PMC - PubMed

Publication types