[Preprint]. 2024 Apr 5:rs.3.rs-4188387.
doi: 10.21203/rs.3.rs-4188387/v1.

The challenge of improving long-lasting insecticidal nets coverage on Bioko Island: using data to adapt distribution strategies

Affiliations

The challenge of improving long-lasting insecticidal nets coverage on Bioko Island: using data to adapt distribution strategies

Guillermo A García et al. Res Sq. .

Update in

Abstract

Background: Since 2015, malaria vector control on Bioko Island has relied heavily upon long-lasting insecticidal nets (LLIN) to complement other interventions. Despite significant resources utilised, however, achieving and maintaining high coverage has been elusive. Here, core LLIN indicators were used to assess and redefine distribution strategies.

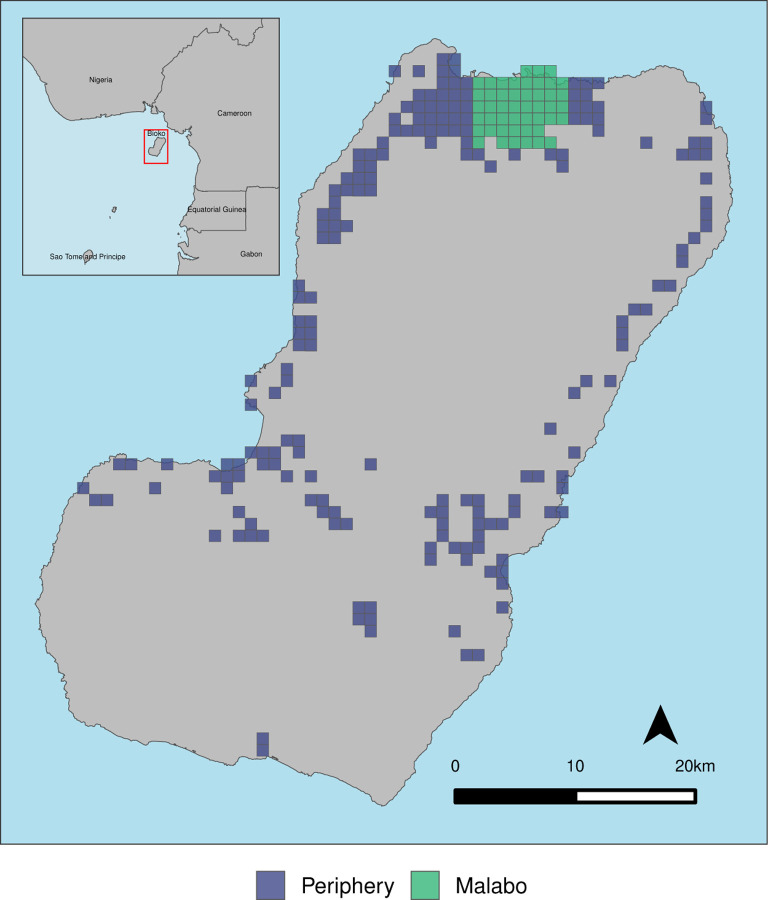
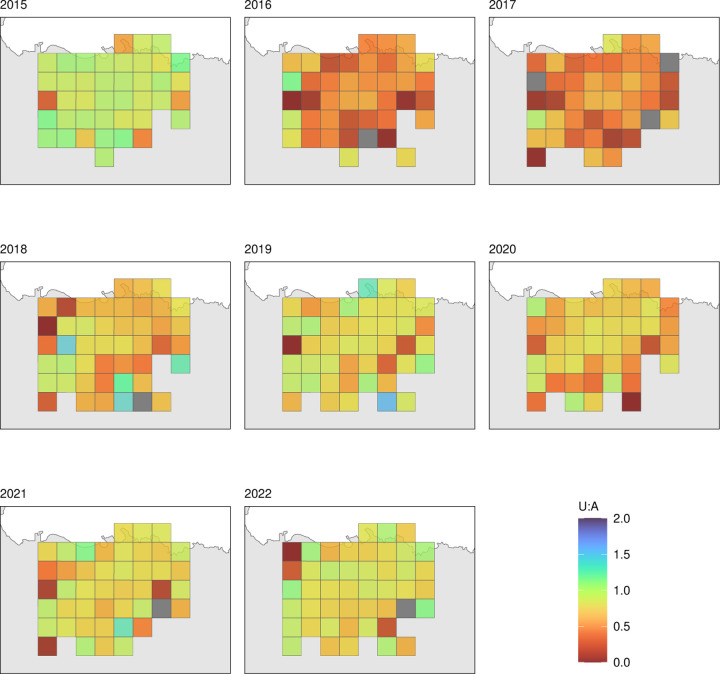
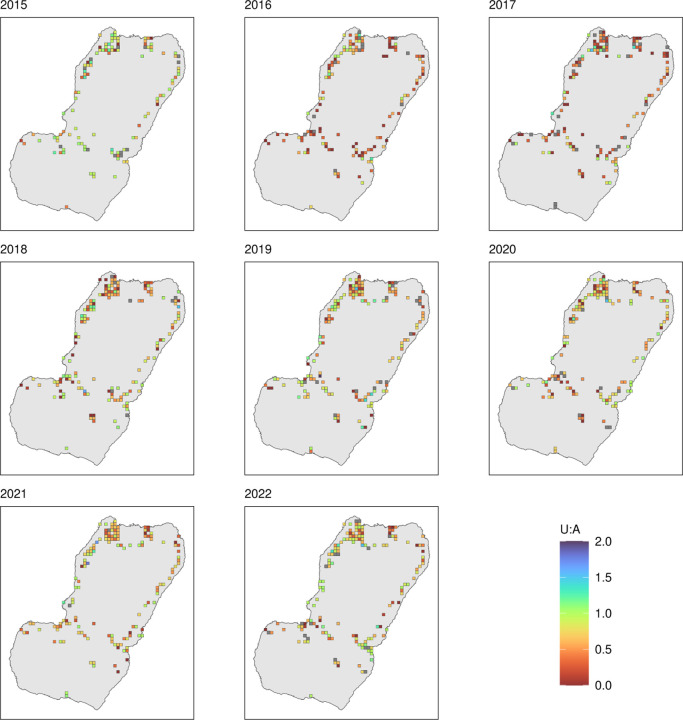
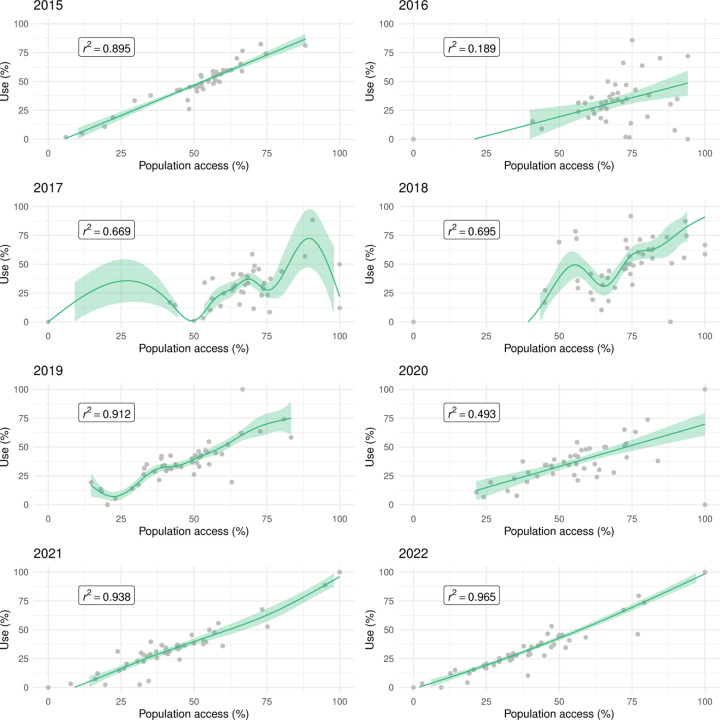
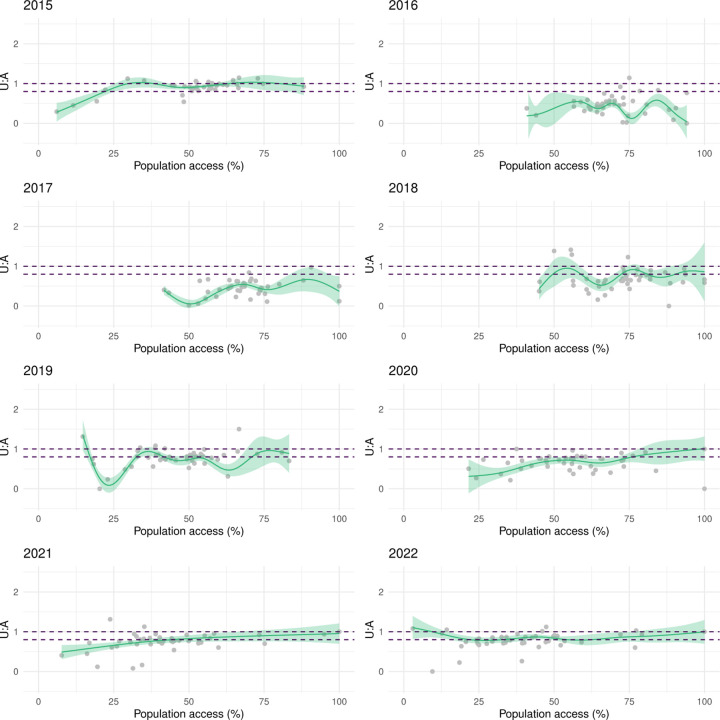
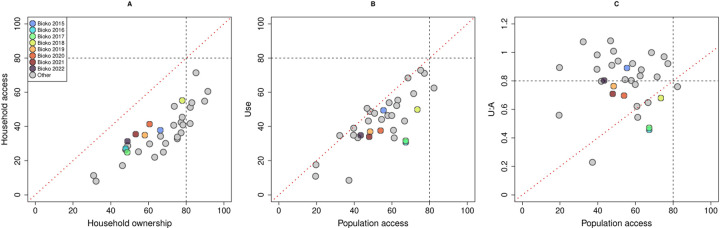
Methods: LLIN indicators were estimated for Bioko Island between 2015 and 2022 using a 1×1 km grid of areas. The way these indicators interacted was used to critically assess coverage targets. Particular attention was paid to spatial heterogeneity and to differences between urban Malabo, the capital, and the rural periphery.

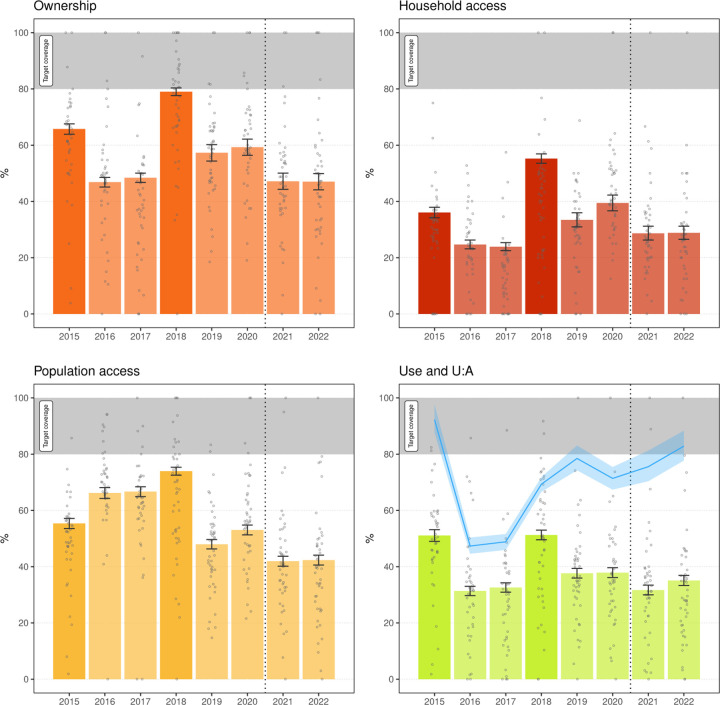
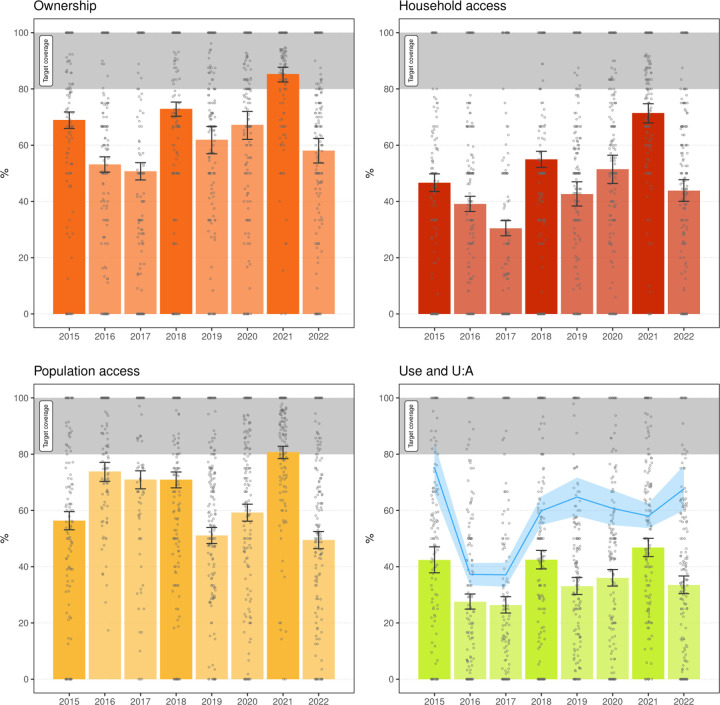
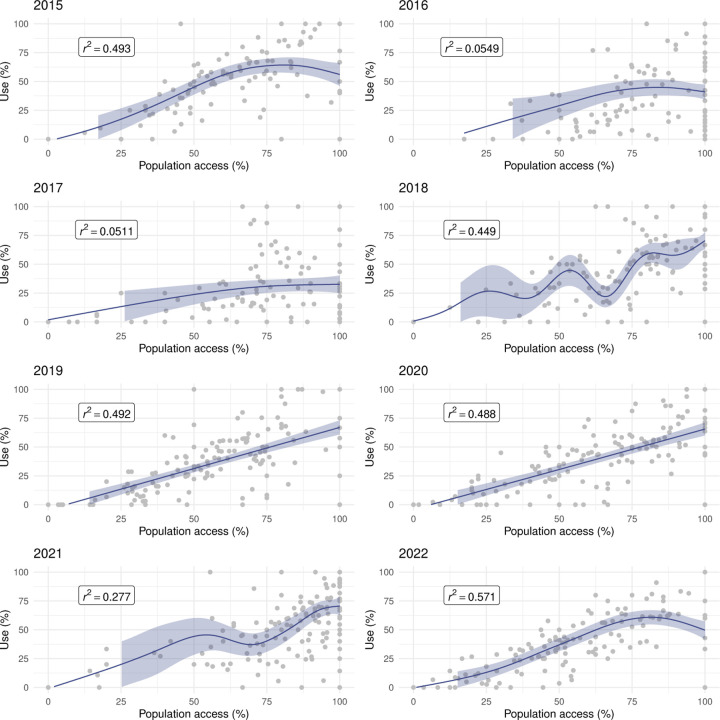
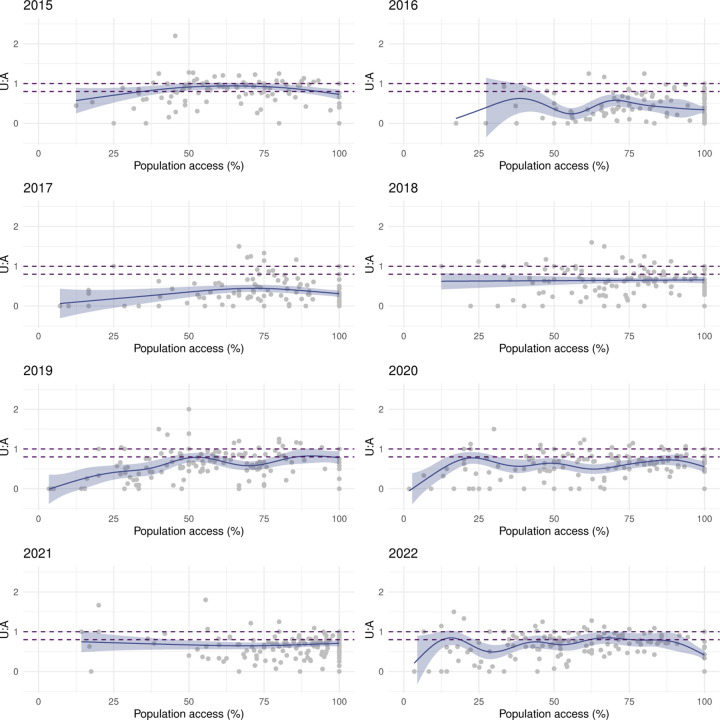
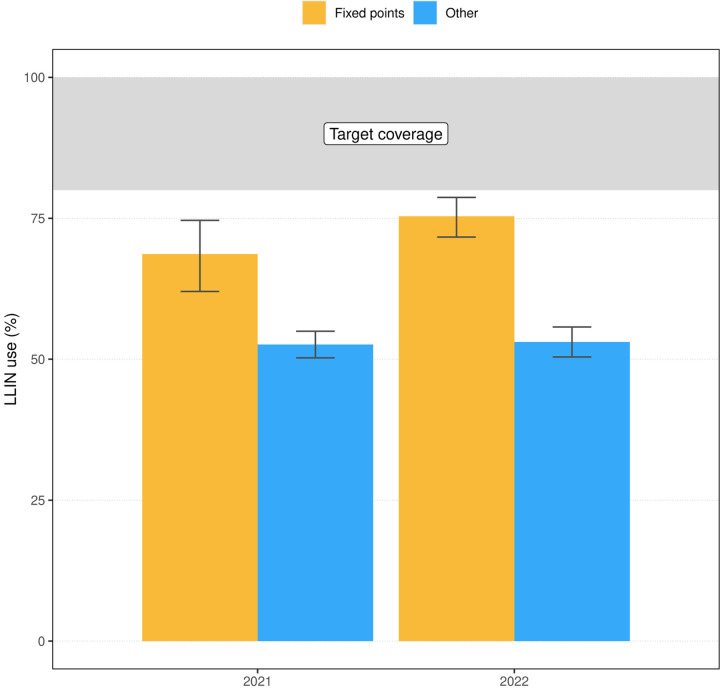
Results: LLIN coverage according to all indicators varied substantially across areas, decreased significantly soon after mass distribution campaigns (MDC) and, with few exceptions, remained consistently below the recommended target. Use was strongly correlated with population access, particularly in Malabo. After a change in strategy in Malabo from MDC to fixed distribution points, use-to-access showed significant improvement, indicating those who obtained their nets from these sources were more likely to keep them and use them. Moreover, their use rates were significantly higher than those of whom sourced their nets elsewhere.

Conclusions: Striking a better balance between LLIN distribution efficiency and coverage represents a major challenge as LLIN retention and use rates remain low despite high access resulting from MDC. The cost benefit of fixed distribution points in Malabo was deemed significant, providing a viable alternative for guaranteeing access to LLINs to those who use them.

Keywords: LLIN indicators; coverage; long-lasting insecticidal nets; malaria; malaria indicator survey; mass-distribution campaign.


Conflict of interest statement

Competing interests The authors declare that they have no competing interests.

Figures

Figure 1
Figure 1. Bioko Island and its 1×1 km grid of inhabited areas.
Areas are represented by the boxes [10] stratified by urban Malabo (47 areas) and the rural periphery (193 areas).
Figure 2
Figure 2. LLIN indicators.
Illustration of how the four indicators are calculated using a simple schematic of an area (Figure 1) populated by 25 households, each with 5 residents. Households are enumerated sequentially. Top left: Household ownership. Green houses have at least one LLIN and purple houses have no nets (20/25, or 80%). Top right: Household access. Houses with at least one LLIN but with less than one LLIN for every two members are colored blue (15/25, or 60%). Bottom left: Population access. Sleeping residents colored in green and surrounded by a purple box have access to a LLIN within their home; individuals in blue inhabit a house with nets but do not have access to one and those in purple inhabit a house with no nets. Since one LLIN protects two people, households with all individuals colored green have three LLINs (e.g. houses 1, 5 and 25). Despite living in a house with less than one LLIN for every two occupants (i.e. blue houses in the top right panel, such as house 6 and 14), some residents still have access to a net. House 6, for example, has one LLIN to protect two residents. Population access in this example is 72.8% (91/125 people), higher than household access given that some occupants within households with not enough nets to serve all could still sleep under a net. Bottom right: Use. Sleepers with no access to a net (blue and purple) cannot use one. Some residents choose not to use a net despite having access to one (i.e. green sleepers marked with an X). LLIN use was 45.6% (57/125 residents). Among the 68 non-users living in the area, half of them lacked access while the other half chose to not use available LLINs. U:A is 45.6/72.8 = 0.63, or 63% of those with access used a net (57/91 residents). Source of infographics: Font Awesome by Dave Gandy - http://fontawesome.io.
Figure 3
Figure 3. LLIN indicators in Malabo, 2015–2022.
Bars and error bars mark the overall mean and 95% confidence intervals of survey weighted estimates. Bars with greater colour saturation indicate MDC years. The grey circles illustrate area-level weighted estimates for the 47 areas in Malabo. In the lower right panel, green bars and grey circles express LLIN use and the blue line the mean U:A with the shaded area corresponding to the 95% confidence intervals. The grey band marks the target universal coverage (≥ 80%). The vertical dotted line indicates the change in distribution strategy in Malabo.
Figure 4
Figure 4. LLIN indicators in the periphery, 2015–2022.
Bars and error bars mark the overall mean and 95% confidence intervals of survey weighted estimates. Bars with greater colour saturation indicate MDC years. The grey circles illustrate area-level weighted estimates for the 193 areas in the periphery. In the lower right panel, green bars and grey circles express LLIN use and the blue line the mean U:A with the shaded area corresponding to the 95% confidence intervals. The grey band marks the target universal coverage (≥ 80%).
Figure 5
Figure 5. Spatial rendering of U:A in Malabo, 2015–2022.
Only Malabo areas, as per Figure 1, surveyed in each year are plotted. MDC took place in 2015 and 2018.
Figure 6
Figure 6. Spatial rendering of U:A in the periphery, 2015–2022.
Only areas in the periphery, as per Figure 1, surveyed in each year are plotted. MDC took place in 2015, 2018 and 2021.
Figure 7
Figure 7. The relationship between LLIN use and population access at area level in Malabo.
The line and shaded areas represent GAM fits and credible intervals.
Figure 8
Figure 8. The relationship between LLIN U:A and population access at area level in Malabo.
The line and shaded areas represent model fits and credible intervals. The dashed lines represent the band of universal coverage (80–100% U:A).
Figure 9
Figure 9. The relationship between LLIN use and population access at area level in the periphery.
The line and shaded areas represent GAM fits and credible intervals.
Figure 10
Figure 10. The relationship between LLIN U:A and population access at area level in the periphery.
The line and shaded areas represent model fits and credible intervals. The dashed lines represent the band of universal coverage (80–100% U:A).
Figure 11
Figure 11. LLIN use in Malabo in 2021 and 2022 according to source of the nets.
LLIN use amongst households with access (i.e. at least one net for every two members) and with at least one net sourced from fixed distribution points (orange) or from other sources (blue), by year. Error bars represent the 95% confidence intervals of the estimates.
Figure 12
Figure 12. The relationship between LLIN indicators on Bioko Island compared to data from 25 other malaria endemic countries in sub-Saharan Africa [13].
(A) Household access against ownership; (B) use against population access and (C) U:A against population access. The black dotted lines represent the thresholds for universal coverage for each indicator in the x and y axes. The red dotted diagonals mark equity between indicators.

References

    1. WHO. World Malaria Report 2019. World Health Organization; 2019.
    1. Koenker H, Arnold F, Ba F, Cisse M, Diouf L, Eckert E, et al. Assessing whether universal coverage with insecticide-treated nets has been achieved: is the right indicator being used? Malaria Journal. 2018;17(1):355. - PMC - PubMed
    1. Koenker H, Kilian A. Recalculating the net use gap: a multi-country comparison of ITN use versus ITN access. PloS one. 2014;9(5):e97496–e97496. - PMC - PubMed
    1. Unwin HJT, Sherrard-Smith E, Churcher TS, Ghani AC. Quantifying the direct and indirect protection provided by insecticide treated bed nets against malaria. Nature Communications. 2023. feb;14(1):676. - PMC - PubMed
    1. Koenker H, Worges M, Kamala B, Gitanya P, Chacky F, Lazaro S, et al. Annual distributions of insecticide-treated nets to schoolchildren and other key populations to maintain higher ITN access than with mass campaigns: a modelling study for mainland Tanzania. Malaria Journal. 2022;21(1):246. - PMC - PubMed

Publication types

LinkOut - more resources