[Preprint]. 2024 Apr 8:2024.04.04.588107.
doi: 10.1101/2024.04.04.588107.

STING promotes homeostatic maintenance of tissues and confers longevity with aging

Affiliations

STING promotes homeostatic maintenance of tissues and confers longevity with aging

Jacob W Hopkins et al. bioRxiv. .

Abstract

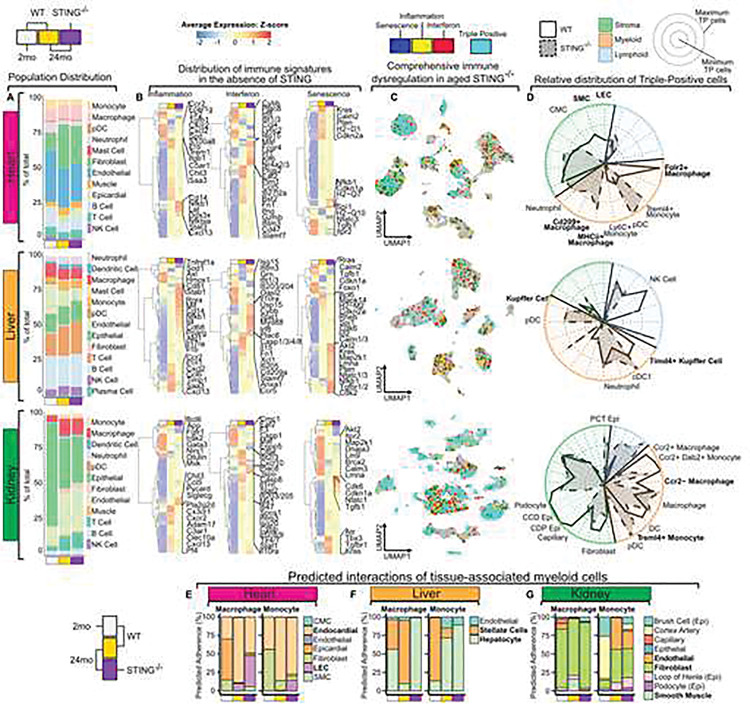
Local immune processes within aging tissues are a significant driver of aging associated dysfunction, but tissue-autonomous pathways and cell types that modulate these responses remain poorly characterized. The cytosolic DNA sensing pathway, acting through cyclic GMP-AMP synthase (cGAS) and Stimulator of Interferon Genes (STING), is broadly expressed in tissues, and is poised to regulate local type I interferon (IFN-I)-dependent and independent inflammatory processes within tissues. Recent studies suggest that the cGAS/STING pathway may drive pathology in various in vitro and in vivo models of accelerated aging. To date, however, the role of the cGAS/STING pathway in physiological aging processes, in the absence of genetic drivers, has remained unexplored. This remains a relevant gap, as STING is ubiquitously expressed, implicated in multitudinous disorders, and loss of function polymorphisms of STING are highly prevalent in the human population (>50%). Here we reveal that, during physiological aging, STING-deficiency leads to a significant shortening of murine lifespan, increased pro-inflammatory serum cytokines and tissue infiltrates, as well as salient changes in histological composition and organization. We note that aging hearts, livers, and kidneys express distinct subsets of inflammatory, interferon-stimulated gene (ISG), and senescence genes, collectively comprising an immune fingerprint for each tissue. These distinctive patterns are largely imprinted by tissue-specific stromal and myeloid cells. Using cellular interaction network analyses, immunofluorescence, and histopathology data, we show that these immune fingerprints shape the tissue architecture and the landscape of cell-cell interactions in aging tissues. These age-associated immune fingerprints are grossly dysregulated with STING-deficiency, with key genes that define aging STING-sufficient tissues greatly diminished in the absence of STING. Changes in immune signatures are concomitant with a restructuring of the stromal and myeloid fractions, whereby cell:cell interactions are grossly altered and resulting in disorganization of tissue architecture in STING-deficient organs. This altered homeostasis in aging STING-deficient tissues is associated with a cross-tissue loss of homeostatic tissue-resident macrophage (TRM) populations in these tissues. Ex vivo analyses reveal that basal STING-signaling limits the susceptibility of TRMs to death-inducing stimuli and determines their in situ localization in tissue niches, thereby promoting tissue homeostasis. Collectively, these data upend the paradigm that cGAS/STING signaling is primarily pathological in aging and instead indicate that basal STING signaling sustains tissue function and supports organismal longevity. Critically, our study urges caution in the indiscriminate targeting of these pathways, which may result in unpredictable and pathological consequences for health during aging.


Conflict of interest statement

DECLARATION OF INTERESTS The authors declare no competing interests.

Figures

Figure 1:
Figure 1:. Aging stromal and myeloid cells shape tissue intrinsic inflammatory fingerprints.
(A) Radial bar chart depicting serum concentrations (pg/mL) of inflammatory cytokines and chemokines (immunokines) from 3, 12, and 24-mo WT mice measured by multiplex ELISA (n = 4–5 mice). (B) Combined Uniform Manifold Approximation and Projection (UMAP) of tissue-associated cells from 2- and 24-mo heart, liver, and kidneys. Clusters are highlighted by tissue, lineage, and age (left to right, annotated as shown). (C, D) NicheNet analysis indicating the ligand–target regulatory potential elicited in 24-mo WT mice cell types by the immunokines assayed in (a). (c) Circos plot visualization of active ligand–target links between cells and immunokines assayed in (a). Il6, Tnf, Il12a/b highlighted. (D) Heatmap representation of mean NicheNet scores (based on Pearson correlation coefficients) of ligand–target regulatory potential scores across tissue-associated cells from the heart, liver, and kidney. Tissue and cell lineage are annotated. (E) Differential gene expression (DGE) analysis of top 25 inflammatory marker genes in the combined datasets of all three tissues and both ages (2 and 24mo). Bonferroni adjusted p-value < 0.1, for 2mo and 24mo WT samples from each tissue (hot pink, heart; gold, liver; green, kidney). Inflammatory genes compiled from gene ontology (GO):0006954. Gene expression scaled for row maximum. (F) Single cell expression levels of top inflammatory marker genes, Bonferroni adjusted p-value < 0.1, by cell type and tissue of origin from the combined dataset. Fibro, fibroblast; Endo, Endothelial; Epi, epithelial; Hep, hepatocyte; Mono, monocyte; Mac, macrophage; Neut, neutrophil; DC, dendritic cell; B, B cell; NK/T, NKT cell/T cell). (G) Bar chart depicting top GO pathways enriched in inflammatory DEGs during youth and aging. Pathways positively correlated with age in magenta, pathways negatively correlated with age (positive with youth) in cyan (hot pink, heart; gold, liver; green, kidney). Statistics calculated using ANOVA (a), or Wilcoxon Rank Sum test (e, f). *p0.05; **p0.01; ***p0.001.
Figure 2:
Figure 2:. Immune fingerprints in aging tissues are enriched for interferon and senescence signatures.
(A) GO pathway network analysis for all DEGs upregulated with age per cell type. GO terms were summarized by semantic similarity with Revigo. Nodes represent individual pathways upregulated in aged cell types, connecting edges represent relative semantic similarity. Blue, innate immune response; pink, senescence; green, interferon responsiveness; red, cellular stress; black, cellular function. (B) Expression of top 25 interferon stimulated marker genes (Bonferroni adjusted p-value < 0.1) for 2mo and 24mo WT tissues (heart, hot pink; liver, gold; kidney, green). (C) Single cell relative expression levels of top interferon stimulated marker genes per cell type separated by tissue of origin. (Fibro, fibroblast; Endo, endothelial; Epi, epithelial; Hep, hepatocyte; Mono, monocyte; Mac, macrophage; Neut, neutrophil; DC, dendritic cell; B, B cell; NK/T, NKT cell/T cell) (D) MAGIC imputed expression levels of key senescence associated genes by cell lineage and tissue. Box plots depict median expression level, first, third quartiles, and range. (Boxplots: grey, 2mo; yellow, 24mo). (E-G) UMAP with maximal relative GSVA enrichment per cell of inflammatory (yellow), interferon response (red), or senescence associated (blue) metagenes in the heart (E) liver (F) and kidney (G). Cells relatively enriched in all three immune pathways (polypositive, PP) in cyan. (H-J) Stacked bar plots depict relative distribution of cells enriched for unique or overlapping immune metagenes, including proportion of PP cells, in 2mo and 24mo samples. Heart (H), liver (I), kidney (J). Statistics calculated using a Wilcoxon Rank Sum test. *p0.05; **p0.01; ***p0.001.
Figure 3:
Figure 3:. An altered immune landscape in the absence of STING.
(A) Stacked bar plots indicate relative distribution of indicated cell types in tissue-specific data sets. Age and genotype are indicated below (2mo WT, grey; 24mo WT, yellow; 24mo STING−/−, purple) (B) Relative average expression of top inflammatory, interferon, and senescence associated DEGs in 2mo and 24mo WT and 24mo STING−/− tissues identified by Bonferroni adjusted p-value < 0.1. Age and genotype indicated above are consistent with (a). (C) UMAP representation of maximal enrichment of all three immune metagenes in 24mo STING−/− tissues (D). Radar plot quantification of relative enrichment of polypositive cells (solid lines: WT; dashed lines: STING−/−) in cell lineage subclusters. Key populations annotated for clarity (green, stroma; orange, myeloid; blue, lymphoid). (E) Stacked bar plots of predicted adherence between macrophages or monocytes and distinct stromal cell anchors forecast by the RNAMagnet algorithm (Velten Lab). Age and genotype indicated below are the consistent with (a). Differentially expressed genes calculated using a Wilcoxon rank sum test (b).
Figure 4:
Figure 4:. STING regulates systemic and histological inflammation to reinforce longevity.
(A) Radial bar chart depicting serum cytokine and chemokine concentrations (pg/mL) from 3, 12, 18, and 24mo STING−/− (filled, dotted bars) mice and WT (solid, transparent bars) measured by multiplex ELISA (N = 4–5). (B-D). H&E analysis of young (2mo) WT and aged (26–32mo) WT and STING−/− heart, liver, and kidney samples. (E) Kaplan-Meier survival probability curves comparing WT (solid line, yellow circles) and STING−/− (dashed line, purple circles) male mice. Statistics were calculated with a one-way ANOVA with Bonferroni correction (A) or a Mantel-Cox Logrank test (E) *p0.05; **p0.01; ***p0.001, ****p0.0001.
Figure 5:
Figure 5:. STING deficiency reshapes homeostatic TRM populations.
(A-C) UMAP of subsetted and re-clustered macrophages from combined datasets of WT and STING−/− hearts (A), livers (V), and kidneys (C). (D) Boxplots denoting gene expression distributions of SASP-associated genes from annotated tissue resident macrophages (TRMs). Boxplots indicate upper and lower range, first and third quartile, and median. Grey, 2mo WT; gold, 24mo WT; purple, 24mo STING−/−. Bonferroni adjusted p-value thresholds are indicated as *p ≤ 0.1. (E) Flow cytometry gating strategy to identify macrophages from the heart, liver, and kidney. (F) Stacked bar plot of F4/80hi (light blue) and F4/80lo (dark red) macrophages from the heart, liver, and kidney. Ages and genotypes annotated below. (G) Continued from gating in (E), flow cytometry gating strategy to identify resident macrophages in the heart, liver, and kidney. (H-M) Individual dots represent mice. Quantification of macrophages from the heart FlowSOM01 (aka TRM-1 or FlowSOM metacluster 1). Tukey correction adjusted p-value thresholds are indicated as *p ≤ 0.05; **p ≤ 0.01; ***p ≤ 0.001, ****p ≤ 0.0001. (H); Tim4+ CCR2 (K); liver, F4/80hi Ly6G (I), Tim4+ CCR2 MHCii (L); and kidney (F4/80hi Ly6G (J), CD11bint CD11c+ MHCii Ly6C (M). Ages and genotypes as indicated in (F). (N) scRNAseq based “ridgeplots” of gene expression for homeostasis related genes critical for scavenging and efferocytosis functions of TLF-like TRMs, from the heart, liver, and kidney. Genotypes annotated as in (d); WT; gold, STING−/− purple. (O) As in (n), histograms of homeostatic surface receptors on TRM-1 (heart) and F4/80hi macrophages (liver, kidney). 24mo samples are concatenated into representative images (n = 5 WT, 4, STING−/−). Percent positive cells are annotated as shown. Genotypes annotated as in (d, n); WT; gold, STING−/−; purple. Statistics calculated using a Wilcoxon Rank Sum test (d) or One Way ANOVA (h-m).
Figure 6:
Figure 6:. TRM vitality and tissue distribution require the STING pathway.
(A) Summary of GSVA enrichment scores of GO pathways related to cell death in TLF-like resident macrophages. Shading and colors indicate trends of relative pathway scores in 24mo WT and STING−/− relative to 2mo control TLF-like macrophages at a significance threshold with an FDR adjusted p-value < 0.05. (B) Immunofluorescent TUNEL staining of CLEC4F+ Kupffer cells (liver resident macrophages). White arrows indicate dual TUNEL and CLEC4F staining indicating dying Kupffer cells. (Red, TUNEL; green, CLEC4F; blue, Hoescht. 3 fields of view per tissue; number of independent tissues, N = 3) (C) Quantification of TUNEL+ Kupffer cells as percent of total CLEC4F+ Kupffer cells (right). (D). In vitro cell death assays testing vitality of 16-week resident macrophages (large peritoneal macrophages) and bone marrow derived macrophages (BMDMs) by administration of Etoposide (left), Nigericin (middle), and H2O2 + 3-MA (right). Data points are average of n=5 technical replicates. Figure representative of N = 4 biological replicates. (E-G) Visualization and quantification of TRM subsets in relation to local structures and vasculature. At least two fields of view per liver, kidney, or entire atria (N = 3–5). (E) CD68+, CD206+ macrophages and CD31+ endothelial cells in the atrium and LYVE1+ lymphatic venules in the myocardium from 3mo and 18mo WT and STING−/− heart. Peri-lymphatic localization of CD68+ and CD206+ macrophages are quantified as cells / length lymphatic venule in μm. (CD68, red; CD206, green; CD31/LYVE1, cyan; Hoescht, white). (F) IBA1+ and CLEC4F+ macrophages/Kupffer cells and CD31+ endothelial cells from WT and STING−/− liver. Kupffer cell polarization around the central vein is quantified below. White dashed circles indicate central vein. White dashed boxes indicate regions for greater magnification. (CV, central vein; PT, portal triad. (IBA1, red; CLEC4F, green; CDE31, cyan; Hoescht, white). (G) F4/80+ and CD169+ macrophages and CD31+ endothelial cells from WT and STING−/− kidneys. White dashed areas indicate perivascular space. Density of macrophages in the renal cortex and vascular polarization of macrophages are quantified. (Young, 3mo; Aged 18mo. F4/80, red; CD169, green; CD31, cyan; Hoescht, white). Statistics calculated using One Way ANOVA (d, e-g) or Two Way ANOVA (c) *p0.05; **p0.01; ***p0.001.

References

    1. Tuttle C.S.L., Waaijer M.E.C., Slee-Valentijn M.S., Stijnen T., Westendorp R., and Maier A.B. (2020). Cellular senescence and chronological age in various human tissues: A systematic review and meta-analysis. Aging Cell 19, e13083. 10.1111/acel.13083. - DOI - PMC - PubMed
    1. Yousefzadeh M.J., Flores R.R., Zhu Y., Schmiechen Z.C., Brooks R.W., Trussoni C.E., Cui Y., Angelini L., Lee K.A., McGowan S.J., et al. (2021). An aged immune system drives senescence and ageing of solid organs. Nature 594, 100–105. 10.1038/s41586-021-03547-7. - DOI - PMC - PubMed
    1. Lan Y.Y., Heather J.M., Eisenhaure T., Garris C.S., Lieb D., Raychowdhury R., and Hacohen N. (2019). Extranuclear DNA accumulates in aged cells and contributes to senescence and inflammation. Aging Cell 18, e12901. 10.1111/acel.12901. - DOI - PMC - PubMed
    1. Lei Y., Guerra Martinez C., Torres-Odio S., Bell S.L., Birdwell C.E., Bryant J.D., Tong C.W., Watson R.O., West L.C., and West A.P. (2021). Elevated type I interferon responses potentiate metabolic dysfunction, inflammation, and accelerated aging in mtDNA mutator mice. Sci Adv 7. 10.1126/sciadv.abe7548. - DOI - PMC - PubMed
    1. Simon M., Van Meter M., Ablaeva J., Ke Z., Gonzalez R.S., Taguchi T., De Cecco M., Leonova K.I., Kogan V., Helfand S.L., et al. (2019). LINE1 Derepression in Aged Wild-Type and SIRT6-Deficient Mice Drives Inflammation. Cell Metab 29, 871–885 e875. 10.1016/j.cmet.2019.02.014. - DOI - PMC - PubMed

Publication types