

This is a preprint.
Exploratory Study on COPD Phenotypes and their Progression: Integrating SPECT and qCT Imaging Analysis
- PMID: 38645219
- PMCID: PMC11030493
- DOI: 10.1101/2024.04.10.24305577
Exploratory Study on COPD Phenotypes and their Progression: Integrating SPECT and qCT Imaging Analysis
Abstract
Background: The objective of this study is to understand chronic obstructive pulmonary disease (COPD) phenotypes and their progressions by quantifying heterogeneities of lung ventilation from the single photon emission computed tomography (SPECT) images and establishing associations with the quantitative computed tomography (qCT) imaging-based clusters and variables.
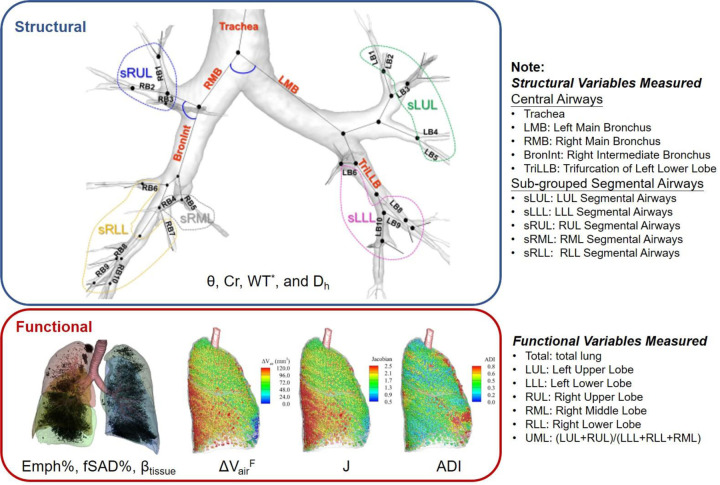
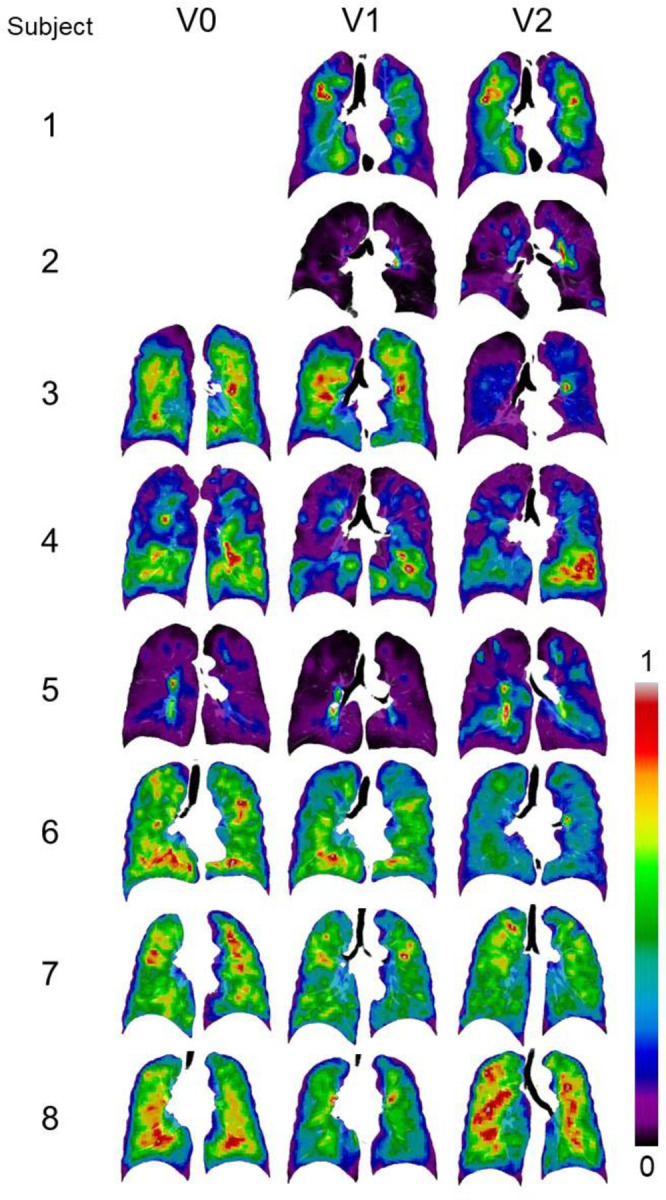
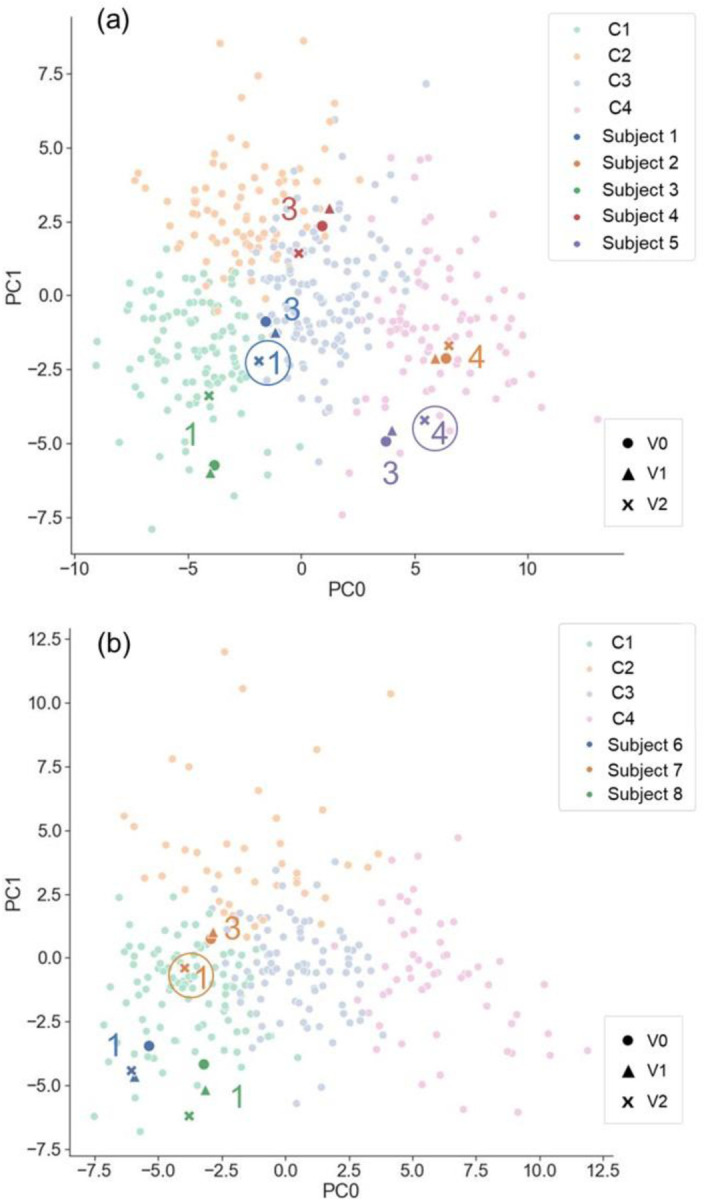
Methods: Eight COPD patients completed a longitudinal study of three visits with intervals of about a year. CT scans of these subjects at residual volume, functional residual capacity, and total lung capacity were taken for all visits. The functional and structural qCT-based variables were derived, and the subjects were classified into the qCT-based clusters. In addition, the SPECT variables were derived to quantify the heterogeneity of lung ventilation. The correlations between the key qCT-based variables and SPECT-based variables were examined.
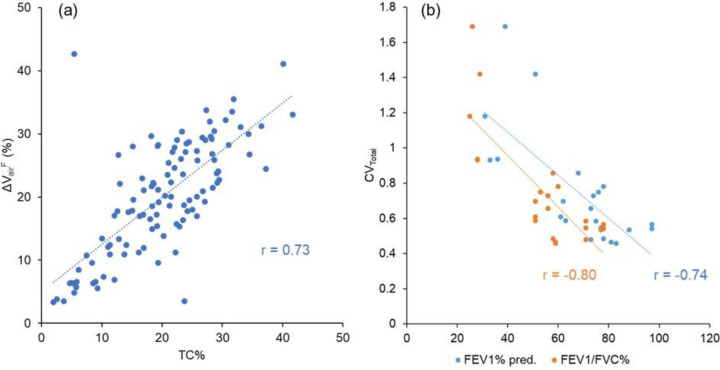
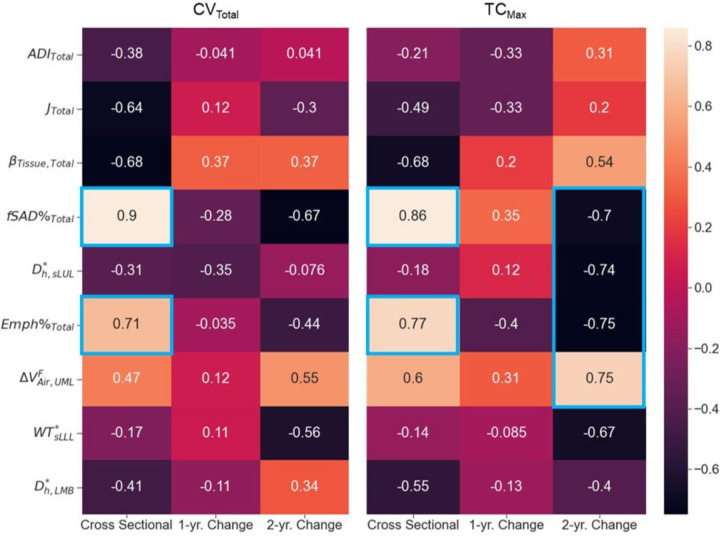
Results: The SPECT-based coefficient of variation (CVTotal), a measure of ventilation heterogeneity, showed strong correlations (|r| ≥ 0.7) with the qCT-based functional small airway disease percentage (fSAD%Total) and emphysematous tissue percentage (Emph%Total) in the total lung on cross-sectional data. As for the two-year changes, the SPECT-based maximum tracer concentration (TCmax), a measure of hot spots, exhibited strong negative correlations with fSAD%Total, Emph%Total, average airway diameter in the left upper lobe, and airflow distribution in the middle and lower lobes.
Conclusion: Small airway disease is highly associated with the heterogeneity of ventilation in COPD lungs. TCmax is a more sensitive functional biomarker for COPD progression than CVTotal. Besides fSAD%Total and Emph%Total, segmental airways narrowing and imbalanced ventilation between upper and lower lobes may contribute to the development of hot spots over time.
Keywords: COPD; CT; SPECT; Small Airway Disease; Ventilation.
Conflict of interest statement
Competing Interests There is no conflict of interest for all authors.
Figures
Similar articles
-
Longitudinal study of COPD phenotypes using integrated SPECT and qCT imaging.Front Physiol. 2025 Apr 25;16:1555230. doi: 10.3389/fphys.2025.1555230. eCollection 2025. Front Physiol. 2025. PMID: 40352142 Free PMC article.
-
Computer and mobile technology interventions for self-management in chronic obstructive pulmonary disease.Cochrane Database Syst Rev. 2017 May 23;5(5):CD011425. doi: 10.1002/14651858.CD011425.pub2. Cochrane Database Syst Rev. 2017. PMID: 28535331 Free PMC article.
-
Regional cerebral blood flow single photon emission computed tomography for detection of Frontotemporal dementia in people with suspected dementia.Cochrane Database Syst Rev. 2015 Jun 23;2015(6):CD010896. doi: 10.1002/14651858.CD010896.pub2. Cochrane Database Syst Rev. 2015. PMID: 26102272 Free PMC article.
-
123I-MIBG scintigraphy and 18F-FDG-PET imaging for diagnosing neuroblastoma.Cochrane Database Syst Rev. 2015 Sep 29;2015(9):CD009263. doi: 10.1002/14651858.CD009263.pub2. Cochrane Database Syst Rev. 2015. PMID: 26417712 Free PMC article.
-
Ventilator Management(Archived).2023 Mar 27. In: StatPearls [Internet]. Treasure Island (FL): StatPearls Publishing; 2025 Jan–. 2023 Mar 27. In: StatPearls [Internet]. Treasure Island (FL): StatPearls Publishing; 2025 Jan–. PMID: 28846232 Free Books & Documents.
References
-
- GLOBAL STRATEGY FOR PREVENTION, DIAGNOSIS AND MANAGEMENT OF COPD: 2023 Report [Internet]. 2023. Available from: https://goldcopd.org/2023-gold-report-2/
-
- Vogelmeier CF, Román-Rodríguez M, Singh D, Han MLK, Rodríguez-Roisin R, Ferguson GT. Goals of COPD treatment: Focus on symptoms and exacerbations. Respir Med. 2020;166(March). - PubMed
Publication types
Grants and funding
LinkOut - more resources
Full Text Sources
Research Materials