[Preprint]. 2024 Apr 11:2024.04.09.588557.
doi: 10.1101/2024.04.09.588557.

The neuroendocrine transition in prostate cancer is dynamic and dependent on ASCL1

Affiliations

The neuroendocrine transition in prostate cancer is dynamic and dependent on ASCL1

Rodrigo Romero et al. bioRxiv. .

Update in

  • The neuroendocrine transition in prostate cancer is dynamic and dependent on ASCL1.
    Romero R, Chu T, González Robles TJ, Smith P, Xie Y, Kaur H, Yoder S, Zhao H, Mao C, Kang W, Pulina MV, Lawrence KE, Gopalan A, Zaidi S, Yoo K, Choi J, Fan N, Gerstner O, Karthaus WR, DeStanchina E, Ruggles KV, Westcott PMK, Chaligné R, Pe'er D, Sawyers CL. Romero R, et al. Nat Cancer. 2024 Nov;5(11):1641-1659. doi: 10.1038/s43018-024-00838-6. Epub 2024 Oct 11. Nat Cancer. 2024. PMID: 39394434 Free PMC article.

Abstract

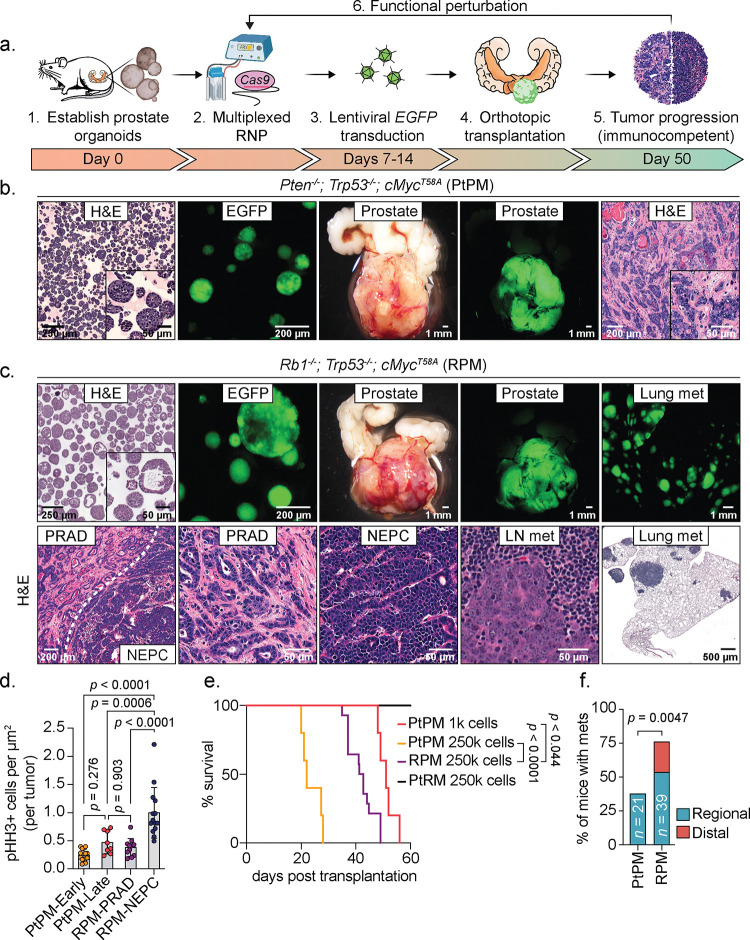
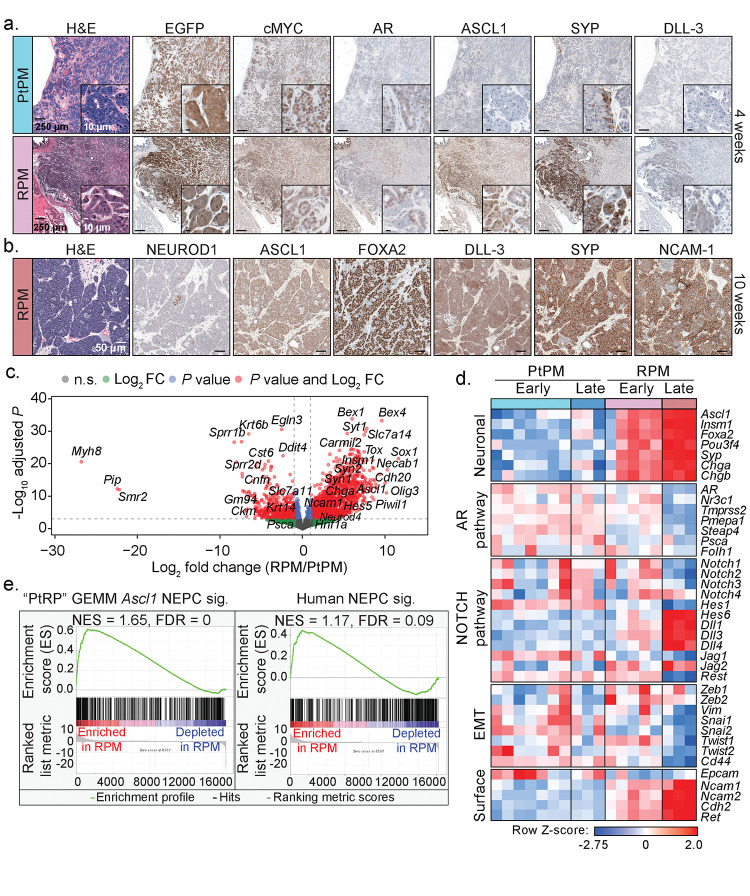
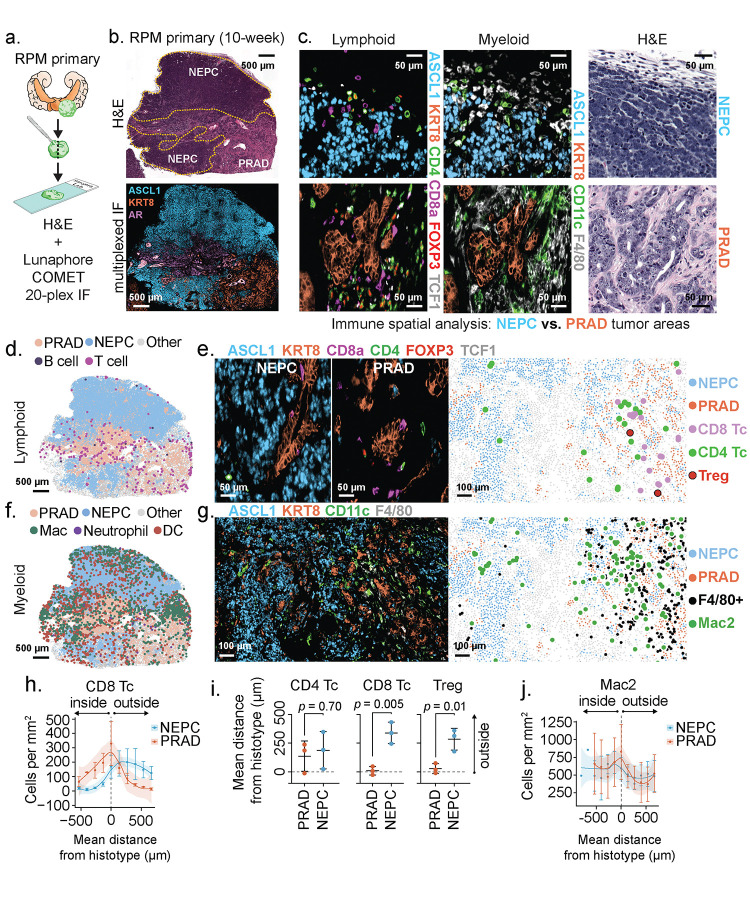
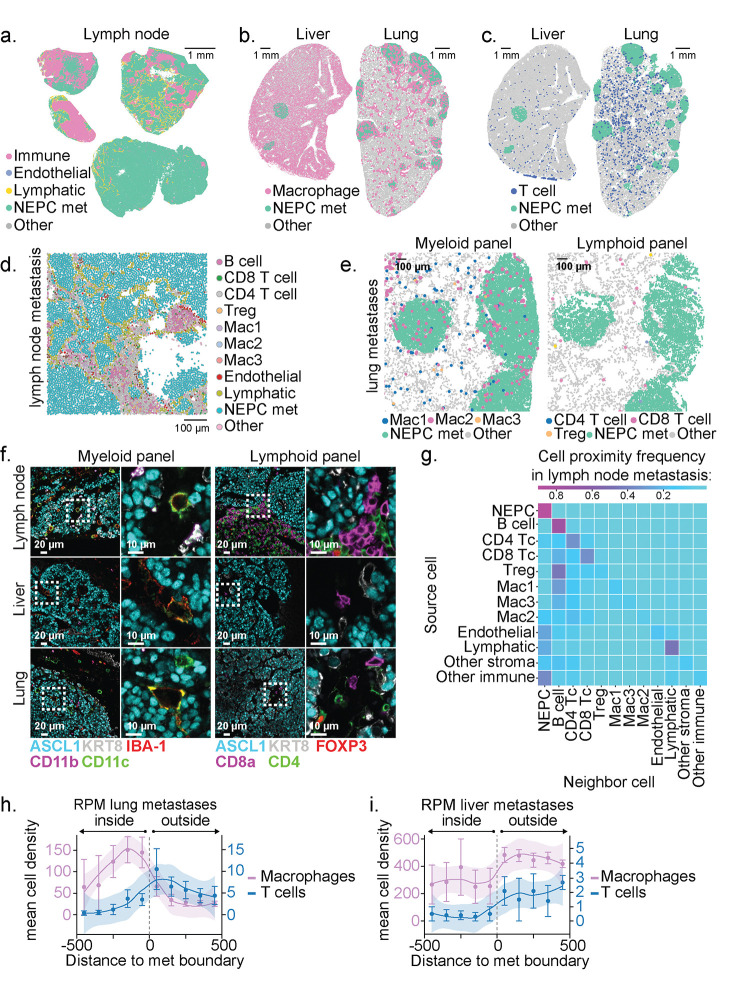
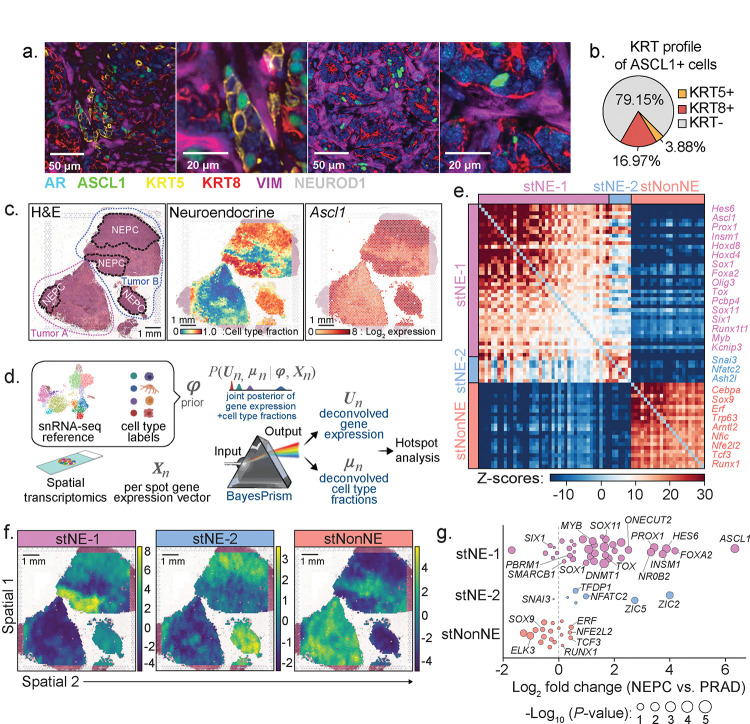
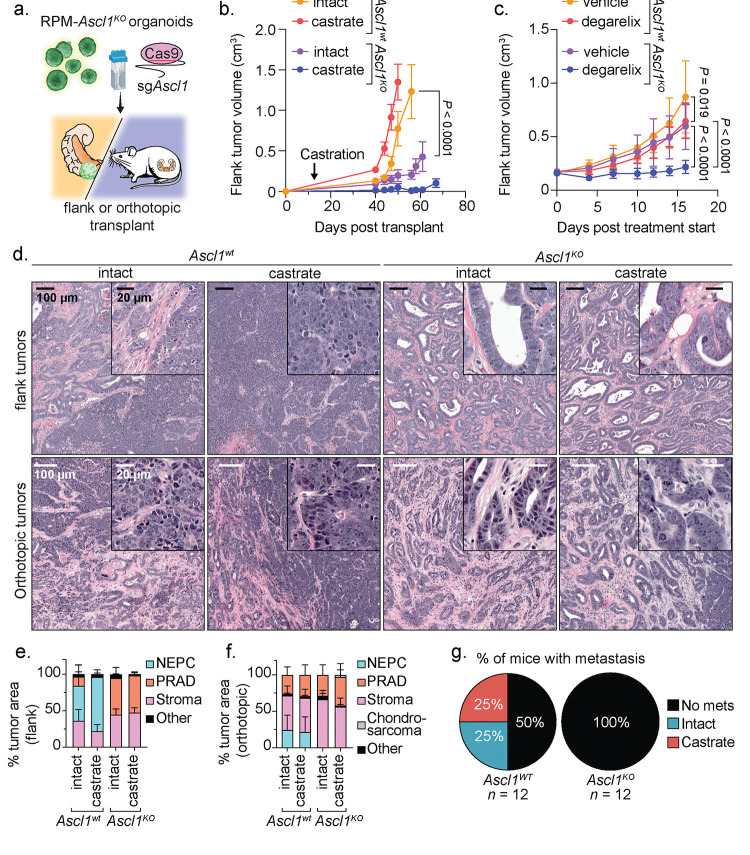
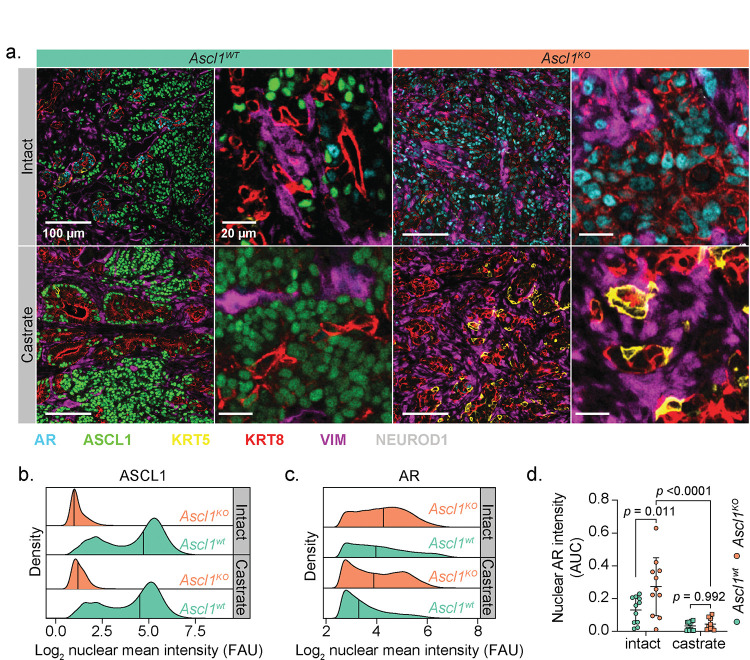
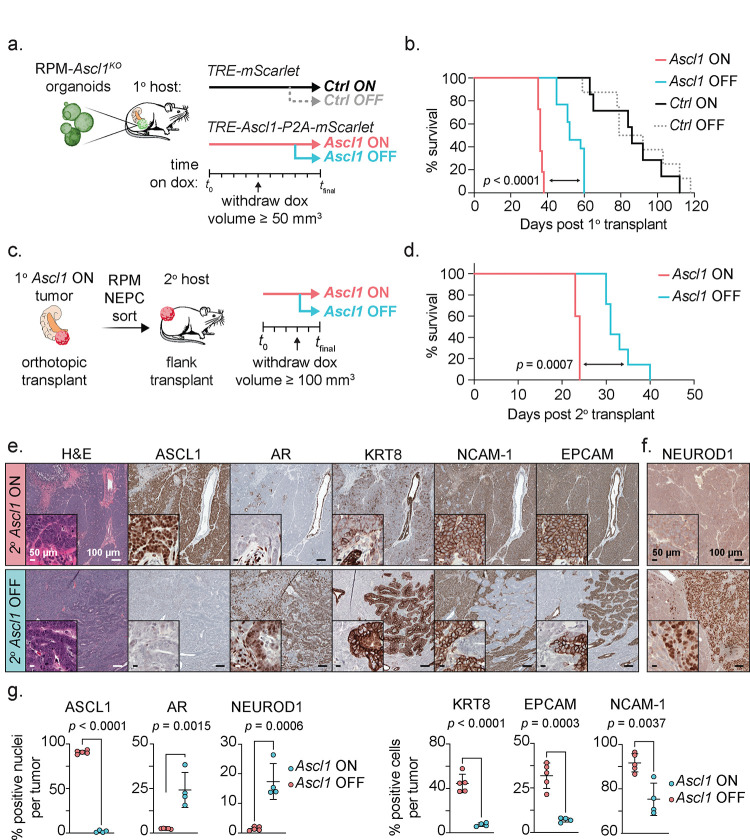
Lineage plasticity is a recognized hallmark of cancer progression that can shape therapy outcomes. The underlying cellular and molecular mechanisms mediating lineage plasticity remain poorly understood. Here, we describe a versatile in vivo platform to identify and interrogate the molecular determinants of neuroendocrine lineage transformation at different stages of prostate cancer progression. Adenocarcinomas reliably develop following orthotopic transplantation of primary mouse prostate organoids acutely engineered with human-relevant driver alterations (e.g., Rb1-/-; Trp53-/-; cMyc+ or Pten-/-; Trp53-/-; cMyc+), but only those with Rb1 deletion progress to ASCL1+ neuroendocrine prostate cancer (NEPC), a highly aggressive, androgen receptor signaling inhibitor (ARSI)-resistant tumor. Importantly, we show this lineage transition requires a native in vivo microenvironment not replicated by conventional organoid culture. By integrating multiplexed immunofluorescence, spatial transcriptomics and PrismSpot to identify cell type-specific spatial gene modules, we reveal that ASCL1+ cells arise from KRT8+ luminal epithelial cells that progressively acquire transcriptional heterogeneity, producing large ASCL1+;KRT8- NEPC clusters. Ascl1 loss in established NEPC results in transient tumor regression followed by recurrence; however, Ascl1 deletion prior to transplantation completely abrogates lineage plasticity, yielding adenocarcinomas with elevated AR expression and marked sensitivity to castration. The dynamic feature of this model reveals the importance of timing of therapies focused on lineage plasticity and offers a platform for identification of additional lineage plasticity drivers.


Figures

Figure 1:
Figure 1:. Rapid establishment of genetically-defined prostate cancer with prostate organoids transplanted into immunocompetent syngeneic hosts.
a. Schematic of timeline required to establish, propagate, edit, and select for organoids harboring mutations in cancer-associated genes prior to transplantation into immunocompetent hosts for tumor establishment. b. Representative microscopy of Pten−/−; Trp53−/−; cMycT58A (PtPM) organoids, and stereoscopic and fluorescence images of orthotopic (OT) prostate tumors with prostate adenocarcinoma (PRAD) histology. Tumor images are representative of n=22 independent mice. H&E, hematoxylin and eosin. c. Top: Representative microscopy of Rb1/; Trp53/; cMycT58A (RPM) organoids, and stereoscopic and fluorescence images of OT prostate tumors and lung metastases. Bottom: Representative histological assessment of RPM-PRAD and RPM-neuroendocrine prostate cancer (NEPC) primary tumor or metastases histology at varying magnifications. Primary and metastatic histology are representative of n=25 independent mice. LN, lymph node (iliac). d. Phospho-Histone H3 (Ser10; pHH3) positive tumor cells per total tumor area (μm2). Each data point represents the average number of pHH3+ cells per individual tumor subset by tumor histology (PRAD vs NEPC) and experimental end point. PtPM-Early (<4 weeks), n=14; PtPM-Late (>6 weeks), n=8; RPM-PRAD, n=11; RPM-NEPC, n=14. Statistics derived using one-way ANOVA with Tukey’s multiple comparisons correction. Error bars denote mean and standard deviation. e. Survival of mice transplanted with the indicated cell numbers of PtPM, RPM, and Pten/; Rb1/; cMycT58A (PtRM) ex-vivo edited organoids. PtPM 1k, n=5; PtPM 250k, n=5; RPM 250k, n=14; PtRM 250k, n=8. Statistics derived from the Log-rank (Mantel-Cox) test for each pair-wise comparison. f. Metastatic disease penetrance of the indicated organoid transplants. Regional metastases include dissemination into the iliac lymph nodes. Distal metastases include dissemination to kidney, pancreas, liver, or lungs. Statistics derived from two-sided Fisher’s exact test. Number of biological replicates indicated within the figure. Scale bars indicated within each figure panel.
Figure 2:
Figure 2:. Molecular characterization of PtPM and RPM primary prostate tumor transplants demonstrates emergence of neuroendocrine carcinoma marker expression.
a. Representative histological analysis of PtPM (top) and RPM (bottom) tumors isolated at 4-weeks post-transplantation. Serial sections depict immunohistochemical staining of the indicated markers. Data are representative of n=22 independently transplanted tumors. b. Representative histological analysis of RPM tumors isolated at 10-weeks post-transplantation. Serial sections depict immunohistochemical staining of the indicated markers. Data are representative of n=25 independently transplanted tumors. c. Volcano plot depiction of the log2 fold change in RNA expression of primary (OT) RPM tumors relative to primary (OT) PtPM tumors. Genes that meet or surpass the indicated thresholds of significance and fold change in expression are color coded as depicted in the figure legend. Data derived from the comparison of PtPM (n=10) and RPM (n=8) independent prostate tumors. d. Heatmap depicting the Z-score normalized differential expression of select genes in PtPM versus RPM tumors. Time points of isolation are color coded in the figure as they are in Fig. 2a. Genes are grouped by the listed class or pathway. Early PtPM ≤4 weeks, early RPM ≤6 weeks. Late PtPM =5 weeks, late RPM =10 weeks. Data related to samples used in Fig. 2f. e. Enrichment plots (GSEA) of established expression signatures of (left) genetically engineered mouse model (GEMM) of NEPC harboring conditional deletion of Pten, Rb1, and Trp53 (PtRP), and (right) histologically verified human NEPC within RPM primary tumors. FDR and NES indicated in the figure. Analysis derived from the transcriptional profiles of multiple independent RPM tumors (n=8) relative to PtPM tumors (n=10). Data related to samples used in Fig. 2d. All scale bars noted in each panel and are of equivalent magnification across each marker.
Figure 3:
Figure 3:. Multiplexed immunofluorescence identifies unique spatial distribution of immune cells within RPM prostate tumors, with local depletion of immune cell types in NEPC areas.
a. Schematic representation of the methods used to process RPM tumors for 20-plex cyclic immunofluorescence. b. (Top) Representative H&E and (bottom) serial section depicting a 3-marker pseudo-colored 10-week RPM tumor. Histological regions (PRAD vs. NEPC) are denoted in the H&E and demarcated by dotted yellow line. c. Representative enhanced magnification of lymphoid (left) and myeloid cell markers (middle), and serially sectioned H&E (right). d. Representative segmented field of view (FoV) for the indicated general lymphoid cell types in a 10-week RPM tumor. e. Representative immunofluorescence of the indicated pseudo-colored lymphocyte markers within NEPC (left) or PRAD (middle). (Right) Data presented as a segmented FoV indicating the localization of each lymphoid and tumor cell type in space. f. Representative segmented field of view (FoV) for the indicated general myeloid cell types in a 10-week RPM tumor. g. Representative immunofluorescence of the indicated pseudo-colored myeloid and tumor histotype markers. (Right) Segmented FoV indicating the localization of each myeloid and tumor cell type in space. h. Frequency distribution of CD8+ T cells within binned distance outside or inside the defined interface region (NEPC or PRAD). Scale bar represents mean and standard error of the mean of the cell counts per bin. i. Mean distance of the indicated cell types to the nearest histotype boundary. Error bars denote mean and standard deviation. j. Frequency distribution of Mac2 cells (CD11blo; CD11c+; F4/80+) within each binned distance outside or inside of the defined interface region (NEPC or PRAD). Scale bar represents mean and standard error of the mean of the cell counts per bin. Data calculated as in h. Shaded regions in panels h and j approximated through Loess method. Dotted line in h-j represents the boundary of the tumor histotype or tumor edge. All scale bars denoted within each panel. Data derived from n=3 independent tumor samples. Infiltration analyses representative of n>3 distinct NEPC and PRAD boundaries.
Figure 4:
Figure 4:. NEPC metastatic lesions are T cell excluded but retain macrophage infiltrates.
a. Representative segmented field of view (FoV) for the indicated cell types within 4 independent draining lymph node metastases derived from n=2 mice transplanted OT with RPM organoids. b. Representative segmented FoV of macrophages (IBA-1+) within liver or lung sections obtained from mice transplanted OT with RPM organoids. Note, liver-resident macrophages (Kupffer cells) are IBA-1+. c. Representative segmented FoV of T cells (CD4+ or CD8+) within liver or lung sections obtained from mice transplanted OT with RPM organoids. d. Representative zoomed in segmented FoV for all cell types listed within a draining lymph node metastasis. Scale denotes relative cell size. e. Representative zoomed in segmented FoV across serial lung sections obtained from mice transplanted OT with RPM organoids, identifying NEPC metastatic nodules infiltrated with (left) macrophage subsets or (right) T cell subsets. f. Representative multiplexed immunofluorescence of the indicated cell type markers across distinct metastatic sites obtained from mice OT transplanted with RPM organoids. g. Neighborhood composition heatmap of cell types found within RPM draining lymph node metastases demonstrating the proximity of the source cell relative to a neighboring cell (20-pixel distance). Data are derived from n=4 independent metastatic lymph node samples isolated from n=2 mice. h. Frequency distribution for Macrophages (IBA1+) or T cells (CD4+ or CD8+) within each binned distance outside or inside of RPM lung metastatic samples. i. Frequency distribution for Macrophages (IBA1+) or T cells (CD4+ or CD8+) within each binned distance outside or inside of RPM liver metastatic samples quantified as in Fig. 4h. Shaded region in h-i approximated through Loess method. Scale bar in h-i represents mean and standard error of the mean of the cell counts per bin. Dotted line in h-i represents the boundary of a tumor histotype or tumor edge. All metastatic tumors per section within an individual mouse were combined for infiltration analysis and subsequently averaged between replicates (n=3 independent mice).
Figure 5:
Figure 5:. PrismSpot reveals spatial transcriptomic heterogeneity within NEPC marked by Ascl1 co-expressed with distinct NE-related TFs.
a. Representative confocal images of 7-plex IF of the indicated markers. Second and fourth images are digitally magnified versions of the first and third panel from the left. Data are representative of n=29 individual RPM tumors at varying time points post OT transplantation. b. Percentage of all ASCL1+ cells co-expressing KRT5, KRT8, or KRT-negative within an individual RPM OT tumor. Data is derived from the average percentage of cells within each tumor across n=10 independent tumors 6-weeks post OT transplantation. c. (Left) H&E stains of two independent 10-week RPM tumors. Tumors A and B are outlined in red and blue dotted lines, respectively. NEPC regions are highlighted in black dotted lines. (Middle) BayesPrism inferred cell type fraction for NEPC. (Right) Log2 fold expression of Ascl1 overlayed on the tumor histology. d. Workflow of PrismSpot method. BayesPrism infers the posterior of cell type-specific gene expression, U, and cell type fraction, μ, of each spot. The expression profile of the cell type of interest (NEPC) was selected as the input for Hotspot analysis. e. Heatmap shows PrismSpot output of the pairwise local correlation Z-scores of 71 TFs of high consensus scores (>0.8) and significant spatial autocorrelation (FDR<0.01). TFs are clustered into 3 modules based on pairwise local correlations between all TFs of significant spatial autocorrelation. f. Spatial expression patterns of TFs within each module are visualized using smoothed summary module scores. g. Beeswarm plot shows the log2 fold change in expression of TFs in each module between bulk RNA-seq of human NEPC and PRAD samples. Dot size shows the two-sided p-values based on Wilcoxon test. All scale bars indicated within each figure panel.
Figure 6:
Figure 6:. Loss of Ascl1 results in abrogated NEPC establishment and castration-sensitivity.
a. Schematic for the generation of RPM-Ascl1WT and RPM-Ascl1KO tumors transplanted into the flanks or prostates of immunocompetent C57BL6/J hosts. b. Longitudinal subcutaneous (SQ) tumor volumes of the indicated tumor genotypes and host backgrounds. Statistics derived using two-way ANOVA with Tukey’s multiple comparisons correction for data collected between days 0–56 to ensure equal sample size comparisons. Error bars denote mean and standard error of the mean. n=6 independent tumors across each group. Castration or sham surgery performed 14 days post SQ transplantation. c. Longitudinal SQ tumor volumes of the indicated tumor genotypes and host backgrounds. Statistics derived using two-way ANOVA with Tukey’s multiple comparisons correction for data collected between 0–16 days post treatment start to ensure equal sample size comparisons. Error bars denote mean and standard deviation. Ascl1WT-vehicle, Ascl1WT-vehicle, and Ascl1KO-degarelix, n=8; Ascl1KO-vehicle, n=9 independent tumors. Vehicle or degarelix treatment was initiated upon tumor establishment (≥150 mm3). d. Representative H&E of SQ (top) and OT (bottom) tumors isolated at endpoint. Genotype and treatment groups listed within the figure panel. Data related to mice in Fig. 5b–c. Scale bars denoted within the figure panel. Data are representative of 4–6 independent tumors per experimental group. e. Stacked bar charts representing percentage of OT tumor area composed of the histological categories depicted in the figure legend. Data are quantified histology of tumors generated in Fig. 5b and represent average tumor area. f. Stacked bar charts representing percentage of SQ tumor area composed of the histological categories depicted in the figure legend. Data are quantified histology of tumors generated in Fig. 5c and represent the average tumor area. g. Pie charts representing percentage of mice with metastatic disease (regional and distal) in intact or castrated hosts of the indicated genotypes. Statistics derived from two-sided Fisher’s exact test, p=0.0137. Number of biological replicates indicated in the figure panel. All scale bars denoted in the figure panels.
Figure 7:
Figure 7:. Loss of Ascl1 results in enhanced AR expression and proportion of KRT8+ tumor cells.
a. Representative confocal images of the tumors isolated from mice in Fig. 5b–c. Scale bars and pseudocolor legend indicated within the figure. b. Density plots of the log2(x+1) transformed ASCL1 mean fluorescence intensity from all (OT and SQ) tumor cells. Tumor cells subset by all cells staining negatively for VIMENTIN. Tumor genotype and treatment indicated in the figure panel. Data derived from n<10 independent RPM tumors per group. c. Density plots of the log2(X+1) transformed AR mean fluorescence intensity from all OT tumor cells within the indicated genotypes and treatment groups. Tumor cells subset by all cells staining negatively for VIMENTIN and positively for KRT8 and AR. d. Area under the curve for all KRT8+:AR+ tumor cells (VIMENTIN−) across both SQ and OT tumor transplants, containing a log2 transformed nuclear AR intensity score ≥3. Statistics derived using two-way ANOVA with Tukey’s multiple comparisons correction. Error bars indicate mean and standard deviation. Combined OT and SQ tumor sample sizes for all quantification and analysis performed in Fig. 7: n=11 (Ascl1wt and Ascl1KO intact groups), n=12 (Ascl1wt castrate group), n=9 (Ascl1KO castrate group). FAU=fluorescence arbitrary units.
Figure 8:
Figure 8:. Loss of Ascl1 in established NEPC results in modest tumor control and increased tumor heterogeneity.
a. Schematic of Ascl1 doxycycline (dox)-inducible in vivo platform. RPM-Ascl1KO organoids infected with inducible mScarlet (Ctrl) or Ascl1-P2A-mScarlet (Ascl1) vectors were transplanted OT into mice fed dox-chow (primary recipient host, 1°). Tumor volume was monitored by ultrasound. Upon primary tumor establishment, mice were randomized into dox ON (maintained) or dox OFF (withdrawal) groups. b. Survival curves of Ctrl or Ascl1 induced OT tumors following dox-maintenance (ON groups) or withdrawal groups (OFF groups). Statistics derived from log-rank (Mantel-Cox) test comparing primary Ascl1 ON to primary Ascl1 OFF groups. Ctrl ON n=7, Ctrl OFF n=8, Ascl1 ON n=11, Ascl1 OFF n=13 independent mice. c. Schematic of SQ Ascl1 doxycycline (dox)-inducible in vivo platform (secondary recipient host, 2°). Ascl1 ON primary tumors were dissociated for flow cytometry to enrich for RPM-NEPC cells used for transplantation assays into the flanks of secondary recipient mice fed dox-chow. Tumor volume was monitored by caliper. Upon tumor establishment, mice were randomized into dox ON (maintained) or dox OFF (withdrawal) groups. d. Survival curves of Ctrl or Ascl1 induced secondary tumors following dox-maintenance (ON groups) or withdrawal groups (OFF). Stats derived from Log-rank (Mantel-Cox) test. Ascl1 ON n=5, Ascl1 OFF n=7 independent mice per group. e. Serial sections from secondary transplanted mice (SQ) stained for the indicated markers by H&E and IHC. f. Representative NEUROD1 IHC within a secondary transplant containing mostly NEPC histology. Data representative of n=5 independent tumors. g. (Left) Average percent marker positive nuclei or (right) cells across biologically independent secondary SQ Ascl1 ON (n=5) or OFF (n=4) tumors. Statistics derived from two-sided t-test. Error bars indicate mean and standard deviation. All scale bars depicted in the figure panels.

References

    1. Siegel R. L., Miller K. D., Wagle N. S. & Jemal A. Cancer statistics, 2023. CA Cancer J. Clin. 73, 17–48 (2023). - PubMed
    1. Watson P. A., Arora V. K. & Sawyers C. L. Emerging mechanisms of resistance to androgen receptor inhibitors in prostate cancer. Nat. Rev. Cancer 15, 701–711 (2015). - PMC - PubMed
    1. Rubin M. A., Bristow R. G., Thienger P. D., Dive C. & Imielinski M. Impact of Lineage Plasticity to and from a Neuroendocrine Phenotype on Progression and Response in Prostate and Lung Cancers. Mol. Cell 80, 562–577 (2020). - PMC - PubMed
    1. Quintanal-Villalonga Á. et al. Lineage plasticity in cancer: a shared pathway of therapeutic resistance. Nat. Rev. Clin. Oncol. 17, 360–371 (2020). - PMC - PubMed
    1. Yamada Y. & Beltran H. Clinical and biological features of neuroendocrine prostate cancer. Curr. Oncol. Rep. 23, 15 (2021). - PMC - PubMed

Publication types