[Preprint]. 2024 Apr 12:2024.04.11.588875.
doi: 10.1101/2024.04.11.588875.

Optogenetic control of Nodal signaling patterns

Affiliations

Optogenetic control of Nodal signaling patterns

Harold M McNamara et al. bioRxiv. .

Update in

  • Optogenetic control of Nodal signaling patterns.
    McNamara HM, Guyer AM, Jia BZ, Parot VJ, Dobbs CD, Schier AF, Cohen AE, Lord ND. McNamara HM, et al. Development. 2025 May 1;152(9):dev204506. doi: 10.1242/dev.204506. Epub 2025 May 1. Development. 2025. PMID: 40145591 Free PMC article.

Abstract

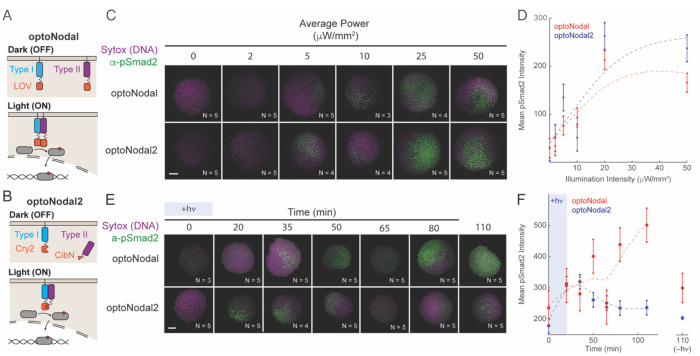
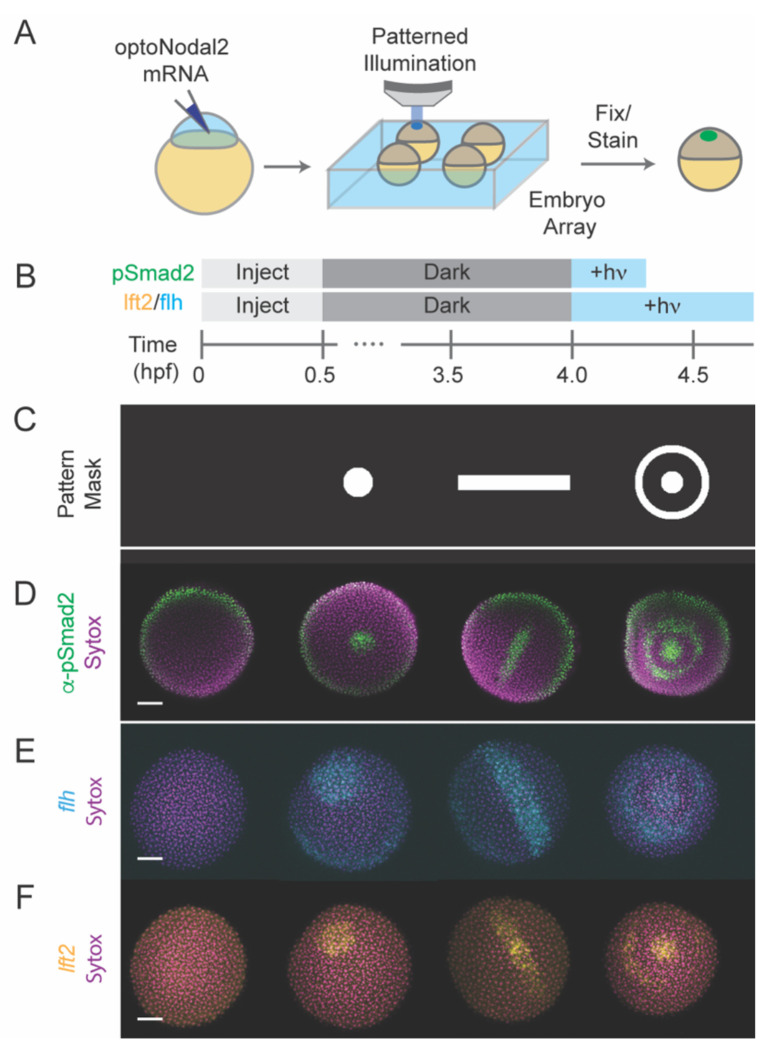
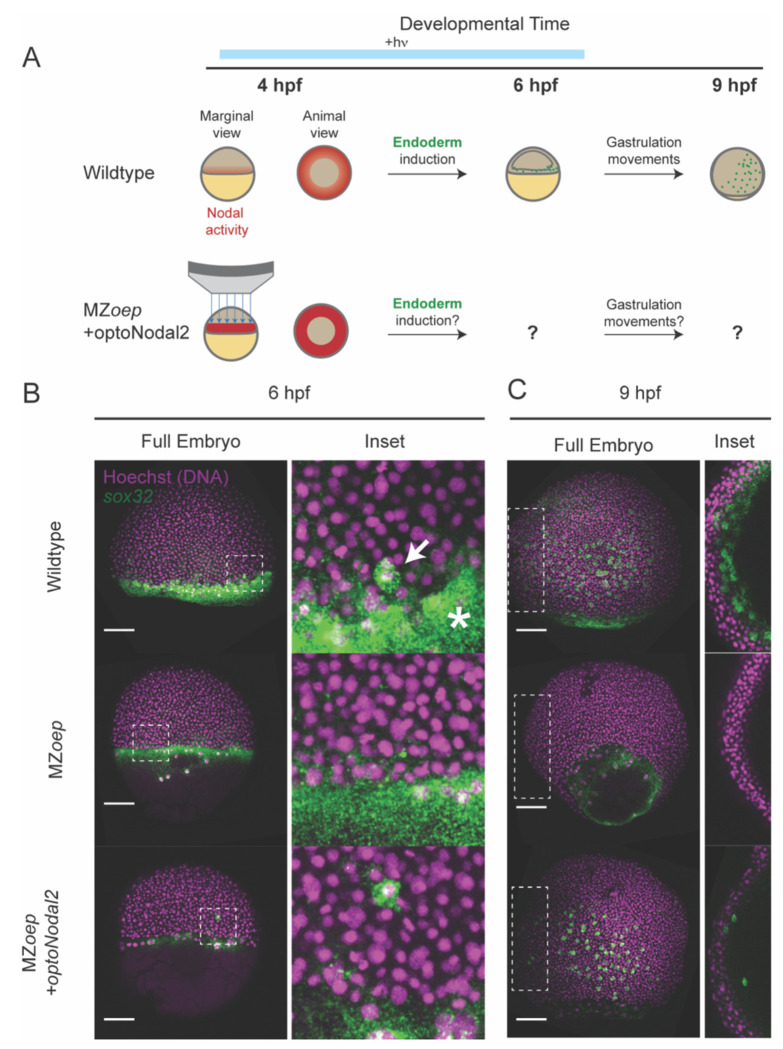
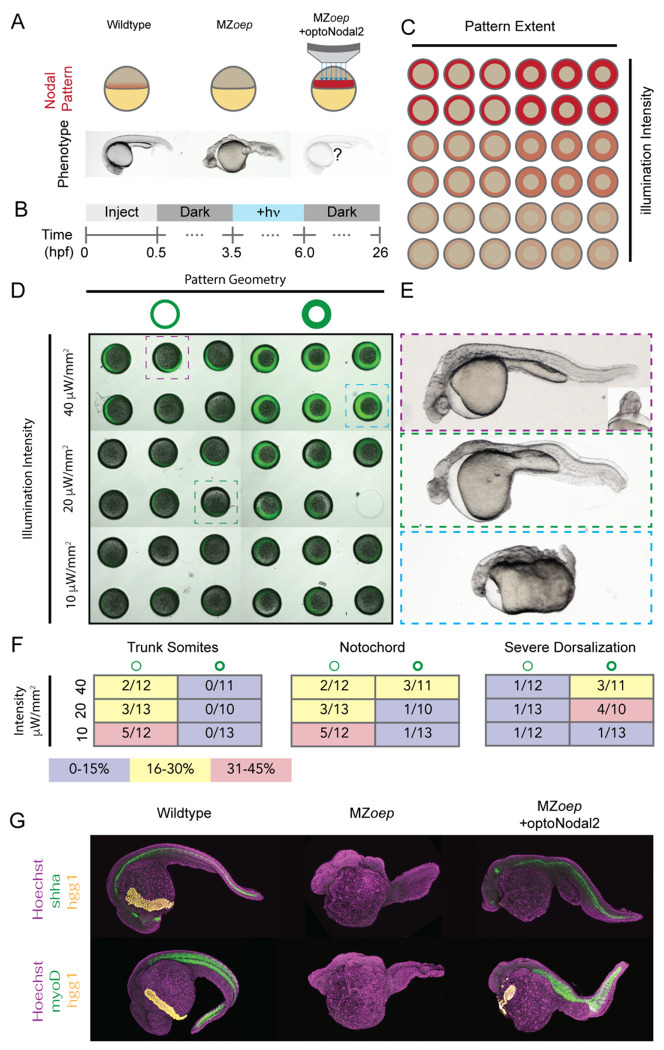
A crucial step in early embryogenesis is the establishment of spatial patterns of signaling activity. Tools to perturb morphogen signals with high resolution in space and time can help reveal how embryonic cells decode these signals to make appropriate fate decisions. Here, we present new optogenetic reagents and an experimental pipeline for creaHng designer Nodal signaling patterns in live zebrafish embryos. Nodal receptors were fused to the light-sensitive heterodimerizing pair Cry2/CIB1N, and the Type II receptor was sequestered to the cytosol. The improved optoNodal2 reagents eliminate dark activity and improve response kinetics, without sacrificing dynamic range. We adapted an ultra-widefield microscopy platform for parallel light patterning in up to 36 embryos and demonstrated precise spatial control over Nodal signaling activity and downstream gene expression. Patterned Nodal activation drove precisely controlled internalization of endodermal precursors. Further, we used patterned illumination to generate synthetic signaling patterns in Nodal signaling mutants, rescuing several characteristic developmental defects. This study establishes an experimental toolkit for systematic exploration of Nodal signaling patterns in live embryos.


Figures

Fig. 1.
Fig. 1.. Improved optoNodal2 reagents based on Cry2-Cib1N heterodimerization.
(A) Schematic of previously developed LOV-based optoNodal reagents. Type I and Type II receptors are tethered to the membrane via a myristoylation motif (top). Blue light induces homodimerization between LOV domains, activating Nodal signaling (bottom). (B) Schematic of OptoNodal2 reagents. The myristoylation motif is removed from the Type II receptor, localizing it to the cytoplasm (top). Blue light induces heterodimerization of Cry2 and Cib1N, activating Nodal signaling (bottom). (C) Blue light intensity responses for optoNodal (top row) and optoNodal2 (bottom row) reagents. Embryos injected with indicated reagents were illuminated for 1 hour with 470 nm light with the indicated intensity. Nodal signaling was measured by α-pSmad2 immunostaining (green). Images are maximum intensity projections of representative embryos. Scale bar 100 μm. (D) Quantification of Nodal signaling activity from panel C. α-pSmad2 staining intensity was extracted from segmented nuclei in optoNodal (red) and optoNodal2 (blue) treatment groups; each point represents the average nuclear staining intensity from replicate embryos. Number of replicate embryos for each condition are indicated in the relevant images in panel C. Error bars denote the standard error of the mean. Dashed curves depict cubic smoothing spline interpolations. (E) Measurement of response kinetics for optoNodal (top row) and optoNodal2 (bottom row) reagents. Embryos injected with indicated reagents were illuminated for 20 minutes with 470 nm light. Nodal signaling was measured by α-pSmad2 immunostaining (green). Images are maximum intensity projections of representative embryos. (F) Quantification of Nodal signaling activity from panel E. α-pSmad2 staining intensity was extracted from segmented nuclei in optoNodal (red) and optoNodal2 (blue) treatment groups; each point represents the average nuclear staining intensity from replicate embryos. Number of replicate embryos for each condition are indicated in the corresponding images in panel E. Error bars denote the standard error of the mean. Dashed curves depict cubic smoothing spline interpolations. Background intensity of unilluminated embryos at the 110 minute timepoint are included (-hv) to indicate baseline levels of signaling activity.
Fig. 2.
Fig. 2.. Platform for spatial and temporal patterning of Nodal signaling activity.
(A) Schematic of patterning experiment. One-cell embryos were injected with mRNA encoding optoNodal2 receptors. At sphere stage, embryos were mounted in custom array mounts compatible with an upright microscope. Spatial patterns of light were generated using an ultra-widefield microscope incorporating DMD-based digital projector (Fig. S4). (B) Experimental timeline. Embryos were injected with optoNodal2 mRNAs at the 1-cell stage. Embryos were kept in the dark until 4 hpf. Embryos stained for pSmad2 (panel D) were illuminated from 4-4.3 hpf, while embryos stained for lft2 or flh expression (panels E and F) were illuminated from 4-4.75 hpf. All embryos were fixed immediately following light treatment. (C-F) Demonstration of spatial patterning of Nodal signaling activity and target gene expression. (C) DMD pattern masks used for spatial patterning. (D) α-pSmad2 immunostaining (green) demonstrating spatial patterning of signaling activity. (E) Spatial patterning of flh gene expression (cyan). (F) Spatial patterning of lft2 gene expression (yellow). Embryos were double stained for lft2 and flh; each column of images in panels E and F depict the same embryo imaged in different channels. All images in panels D-F are maximum intensity projections derived from confocal images of a representative embryo. All scale bars 100 μm.
Fig. 3.
Fig. 3.. Rescue of endoderm precursors and internalization movements.
(A) Endoderm rescue experiment. In wild-type embryos, Nodal signaling near the margin turns on the master endoderm transcription factor sox32 at 4 hpf. By 6 hpf, sox32+ endodermal precursors have internalized, and by 9 hpf they have spread over the yolk via random walk movements. MZeop mutants lack Nodal signaling and do not specify endoderm. We rescued sox32 expression and downstream cell movements in MZoep embryos by targeted optoNodal2 stimulation at the margin from 3.75-6.25 hpf (indicated by blue bar). (B) Rescue of sox32 expression at 6 hpf expression with optoNodal2 stimulation. Sox32+ cells were visualized by HCR in wild-type (top row), MZoep (middle row) and optoNodal2-stimulated MZoep embryos (bottom row). Insets and white arrow highlight localization of sox32+ cells at the embryonic margin. Asterisk highlights Nodal-independent sox32 expression in the extraembryonic yolk syncytial layer. (C) Rescue of cell internalization movements with optoNodal2 stimulation. Sox32+ cells were visualized by HCR at 9 hpf in wild-type (top row), MZoep (middle row) and optoNodal2-stimulated MZoep (bottom row). Insets depict maximum intensity projections of middle confocal slices to visualize the hypoblast cell layer. Sox32+ cells reside in the hypoblast in wild-type and optoNodal2-treated embryos at 9 hpf. All scale bars 100 μm.
Fig. 4.
Fig. 4.. Optogenetic rescue of Nodal signaling mutant phenotypes
(A) Experimental overview. The absence of Nodal signaling in MZoep mutants (middle) results in loss of nearly all mesendodermal tissues. We injected optoNodal2 mRNA into 1-cell stage MZoep embryos and replaced endogenous Nodal signaling with patterned optogenetic stimulation (bottom) (B) Experimental timeline. Illumination patterns were applied from 3.5-6 hpf. Embryos were imaged or fixed at 26 hpf. . (C) Schematic of arrayed layout of Nodal patterns. Optogenetic pattern characteristics were varied along each axis of the embryo array; pattern geometry was varied left-to-right, and pattern intensity was varied top-to-bottom. (D) Visualization of stimulation patterns. Applied patterns (green) were visualized by projecting pattern masks with 560 nm illumination and observing fluorescence from a co-injected mCherry mRNA. Each combination of pattern geometry and intensity was tested in 5 or 6 replicate embryos in the depicted experiment. The 26 hpf phenotypes of boxed embryos are highlighted in panel C. (E) Example rescue phenotypes. Example of a strong rescue phenotype (top), exhibiting notochord, trunk somites and partial rescue of cyclopia. Weaker intensity stimulation (middle) resulted in weaker rescue, with incomplete specification of trunk somites and notochord. Combining high intensity and large-area stimulation led to phenotypes reminiscent of Nodal gain-of-function (bottom, e.g. lefty1;lefty2 double mutants). (F) Quantification of rescue phenotype frequencies for trunk somites (left), notochord (middle) and severe dorsalization (right). Phenotypes were assessed by visual inspection of transmitted light images. (G) Visualization of marker gene expression for Nodal-dependent tissues. Top row: expression of notochord (shha, green) and hatching gland (hgg1, yellow) markers. Bottom row: expression of somite (myoD, green) and hatching gland (hgg1, yellow) markers.

References

    1. Gregor T., Tank D. W., Wieschaus E. F. & Bialek W. Probing the Limits to Positional Information. Cell 130, 153–164 (2007). - PMC - PubMed
    1. Petkova M. D., Tkačik G., Bialek W., Wieschaus E. F. & Gregor T. Optimal Decoding of Cellular Identities in a Genetic Network. Cell 176, 844–855.e15 (2019). - PMC - PubMed
    1. Zagorski M. et al. Decoding of position in the developing neural tube from antiparallel morphogen gradients. Science 356, 1379–1383 (2017). - PMC - PubMed
    1. Stumpf H. Mechanism by which cells estimate their location within the body. Nature 212, 430–431 (1966). - PubMed
    1. Wolpert L. Positional information and the spatial pattern of cellular differentiation. Journal of theoretical biology 25, 1–47 (1969). - PubMed

Publication types