

High risk, high gain? Trade-offs between growth and resistance to extreme events differ in northern red oak (Quercus rubra L.)
- PMID: 38645393
- PMCID: PMC11026572
- DOI: 10.3389/fpls.2024.1374498
High risk, high gain? Trade-offs between growth and resistance to extreme events differ in northern red oak (Quercus rubra L.)
Abstract
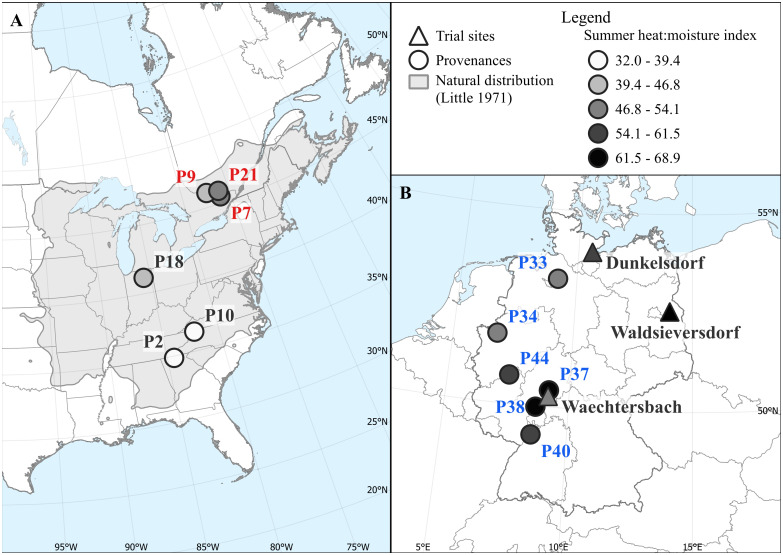
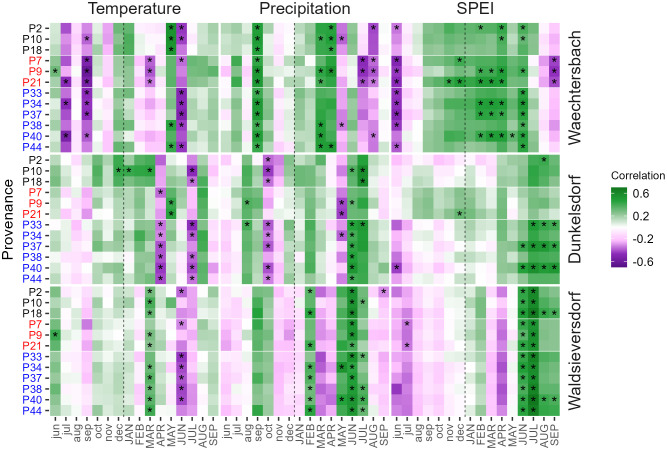
Information about the resistance and adaptive potential of tree species and provenances is needed to select suitable planting material in times of rapidly changing climate conditions. In this study, we evaluate growth responses to climatic fluctuations and extreme events for 12 provenances of northern red oak (Quercus rubra L.) that were tested across three trial sites with distinct environmental conditions in Germany. Six provenances each were sourced from the natural distribution in North America and from introduced stands in Germany. We collected increment cores of 16 trees per provenance and site. Dendroecological methods were used to compare provenance performance and establish climate-growth relationships to identify the main growth limiting factors. To evaluate the provenance response to extreme drought and frost events, three site-specific drought years were selected according to the Standardized Precipitation Evapotranspiration Index (SPEI) and 2010 as a year with an extreme late frost event. Resistance indices for these years were calculated and assessed in relation to overall growth performance. We observed a high variation in growth and in the climate sensitivity between sites depending on the prevailing climatic conditions, as well as a high intra-specific variation. Overall, summer drought and low temperatures in the early growing season appear to constrain the growth of red oak. The resistance of provenances within sites and extreme years showed considerable rank changes and interaction effects. We did not find a trade-off between growth and resistance to late frost, namely, fast growing provenances had a high frost hardiness. Further, there was no evidence for a trade-off between growth and drought hardiness. Still, responses to drought or late frost differ between provenances, pointing to dissimilar adaptive strategies. Provenances from introduced (i.e. German) stands represent suitable seed sources, as they combine a higher growth and frost hardiness compared to their North American counterparts. Drought hardiness was slightly higher in the slow-growing provenances. The results provide a better understanding of the variable adaptive strategies between provenances and help to select suitable planting material for adaptive forest management.
Keywords: climate-growth relationships; dendroecology; drought hardiness; frost hardiness; introduced species; provenance trial; tree rings.
Copyright © 2024 Kormann, van der Maaten, Liesebach, Liepe and van der Maaten-Theunissen.
Conflict of interest statement
The authors declare that the research was conducted in the absence of any commercial or financial relationships that could be construed as a potential conflict of interest. The author(s) declared that they were an editorial board member of Frontiers, at the time of submission. This had no impact on the peer review process and the final decision.
Figures


References
-
- Beguería S., Vicente-Serrano S. M. (2017). Calculation of the Standardised Precipitation-Evapotranspiration Index. doi: 10.1175/2009JCLI2909.1.http - DOI
-
- BMEL (2022) Dritte Bundeswaldinventur 2012. Available at: https://www.bundeswaldinventur.de/dritte-bundeswaldinventur-2012/lebensr....
LinkOut - more resources
Full Text Sources