. 2024 Apr 5:15:1292757.
doi: 10.3389/fgene.2024.1292757. eCollection 2024.

Analysis of weighted gene co-expression networks and clinical validation identify hub genes and immune cell infiltration in the endometrial cells of patients with recurrent implantation failure

Affiliations

Analysis of weighted gene co-expression networks and clinical validation identify hub genes and immune cell infiltration in the endometrial cells of patients with recurrent implantation failure

Zhenteng Liu et al. Front Genet. .

Abstract

Background: About 10% of individuals undergoing in vitro fertilization encounter recurrent implantation failure (RIF), which represents a worldwide social and economic concern. Nevertheless, the critical genes and genetic mechanisms underlying RIF are largely unknown.

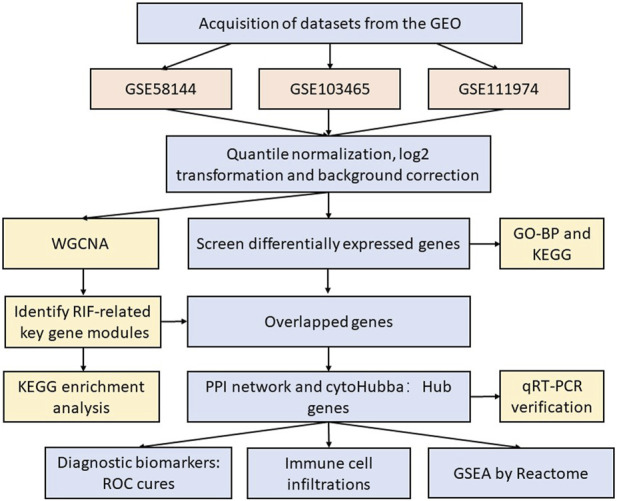
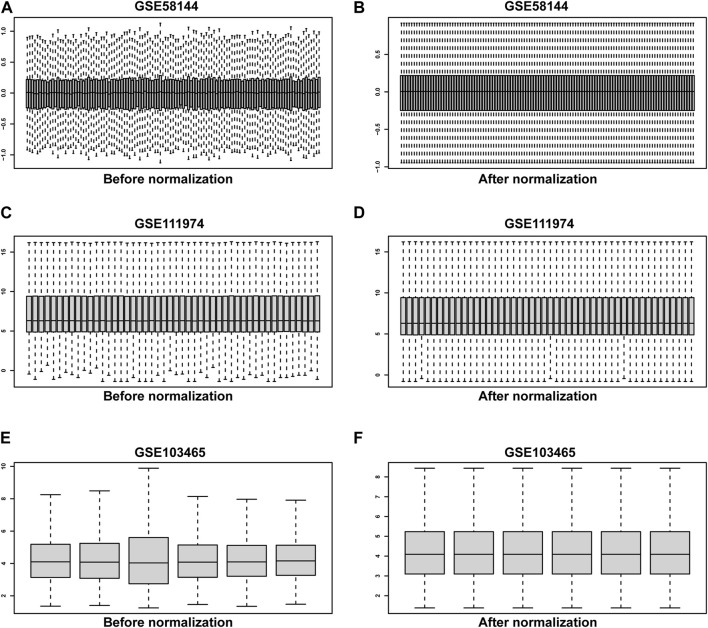
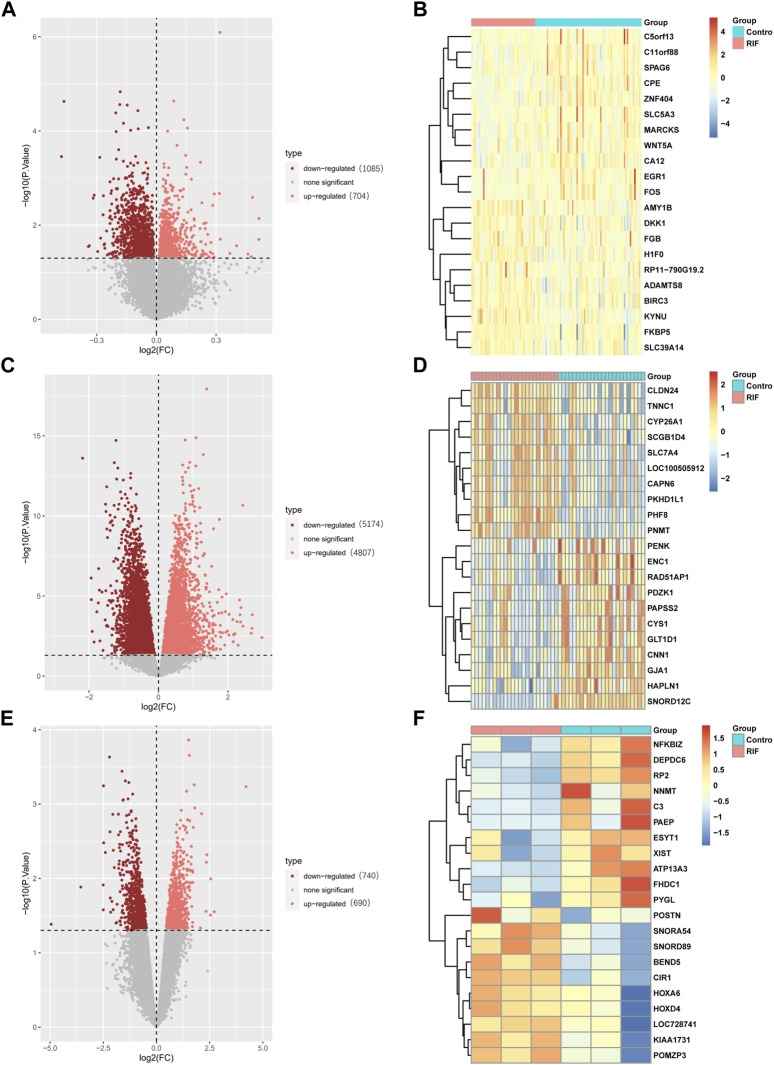
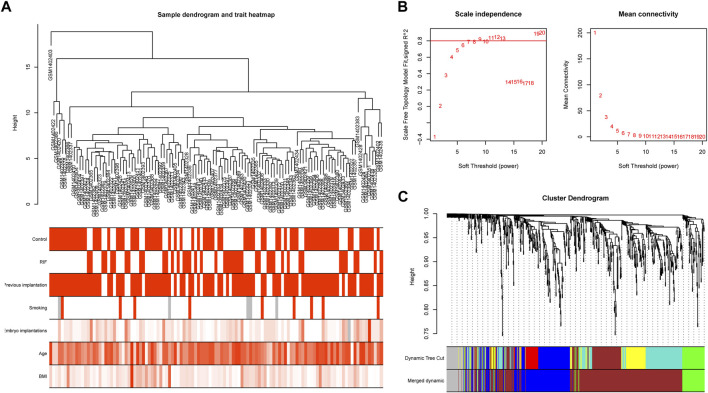
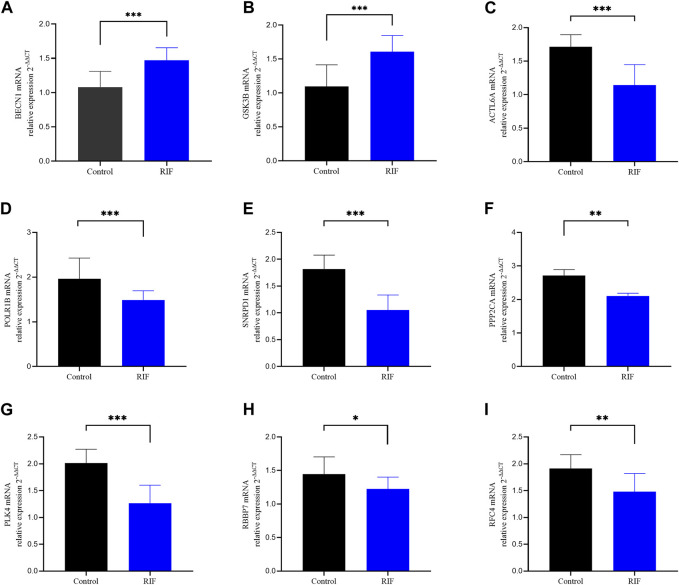
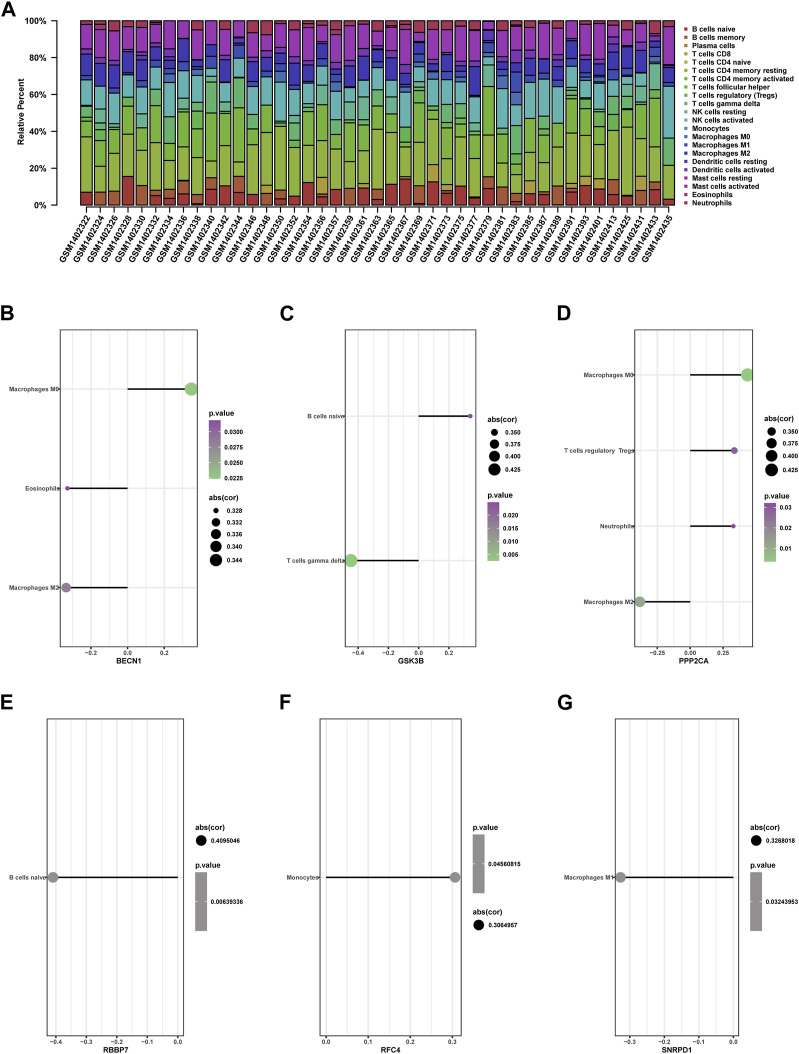
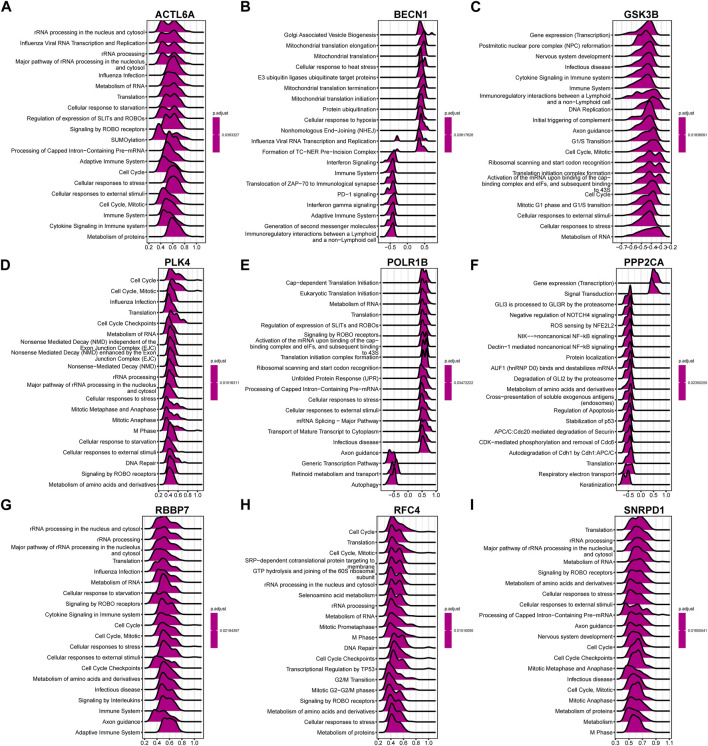
Methods: We first obtained three comprehensive microarray datasets "GSE58144, GSE103465 and GSE111974". The differentially expressed genes (DEGs) evaluation, enrichment analysis, as well as efficient weighted gene co-expression network analysis (WGCNA), were employed for distinguishing RIF-linked hub genes, which were tested by RT-qPCR in our 30 independent samples. Next, we studied the topography of infiltration of 22 immune cell subpopulations and the association between hub genes and immune cells in RIF using the CIBERSORT algorithm. Finally, a novel ridge plot was utilized to exhibit the potential function of core genes.

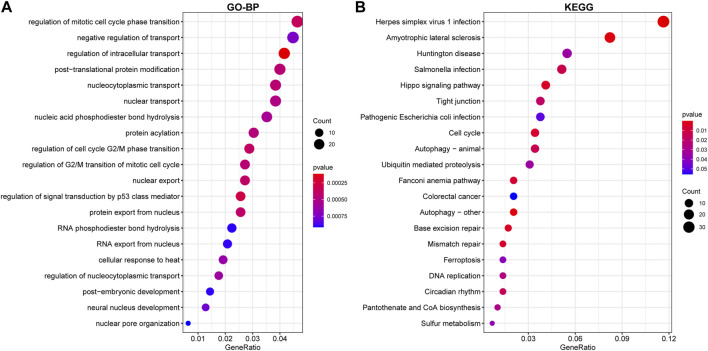
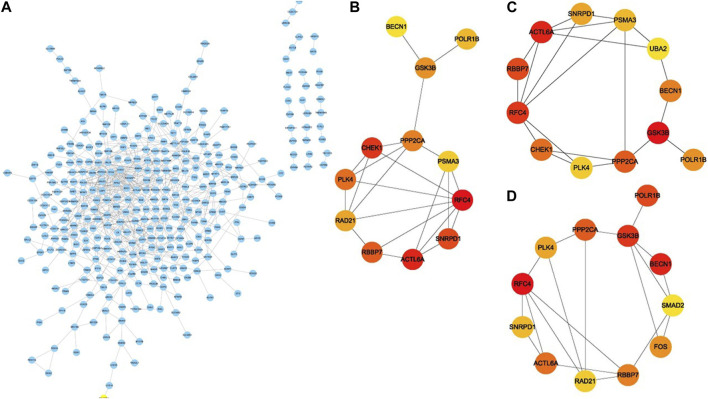
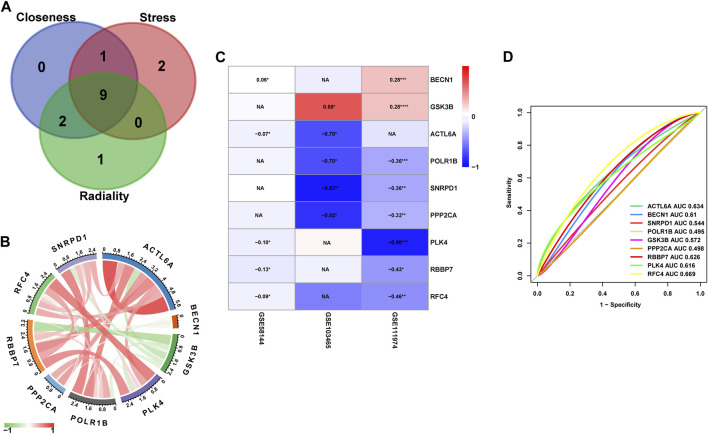
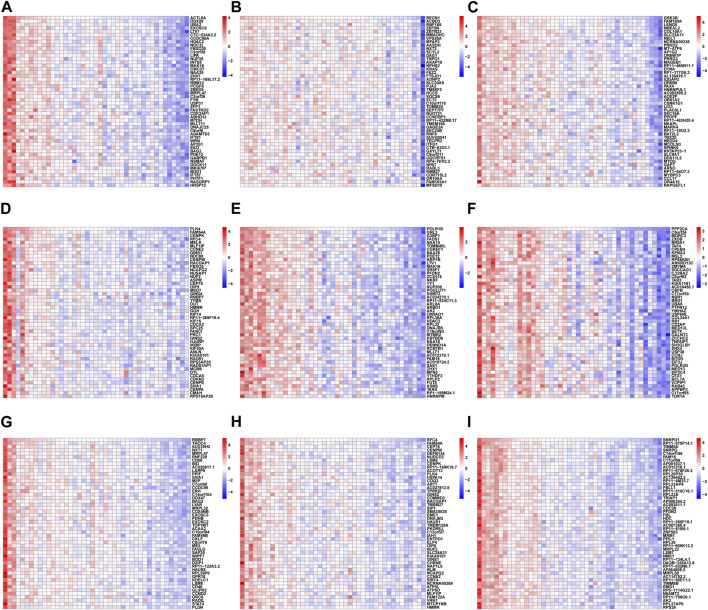
Results: The enrichment of GO/KEGG pathways reveals that Herpes simplex virus 1 infection and Salmonella infection may have an important role in RIF. After WGCNA, the intersected genes with the previous DEGs were obtained using both variance and association. Notably, the subsequent nine hub genes were finally selected: ACTL6A, BECN1, SNRPD1, POLR1B, GSK3B, PPP2CA, RBBP7, PLK4, and RFC4, based on the PPI network and three different algorithms, whose expression patterns were also verified by RT-qPCR. With in-depth analysis, we speculated that key genes mentioned above might be involved in the RIF through disturbing endometrial microflora homeostasis, impairing autophagy, and inhibiting the proliferation of endometrium. Furthermore, the current study revealed the aberrant immune infiltration patterns and emphasized that uterine NK cells (uNK) and CD4+ T cells were substantially altered in RIF endometrium. Finally, the ridge plot displayed a clear and crucial association between hub genes and other genes and key pathways.

Conclusion: We first utilized WGCNA to identify the most potential nine hub genes which might be associated with RIF. Meanwhile, this study offers insights into the landscape of immune infiltration status to reveal the underlying immune pathogenesis of RIF. This may be a direction for the next study of RIF etiology. Further studies would be required to investigate the involved mechanisms.

Keywords: bioinformatics; hub genes; immune cell infiltration; infertility; recurrent implantation failure.


Conflict of interest statement

The authors declare that the research was conducted in the absence of any commercial or financial relationships that could be construed as a potential conflict of interest.

Figures

FIGURE 1
FIGURE 1
The flow diagram of our study.
FIGURE 2
FIGURE 2
The quantile normalization. Before normalization for GSE58144, GSE111974 and GSE103465 datasets (A, C, E), respectively. After normalization for GSE58144, GSE111974 and GSE103465 datasets (B, D, F), respectively.
FIGURE 3
FIGURE 3
Detection of differentially expressed genes (DEGs) in the GSE58144, GSE111974 and GSE103465 datasets. The expression volcano plots in the GSE58144 (A), GSE111974 (C) and GSE103465 (E) datasets, respectively. The heatmap of the top 21 DEGs corresponding to the GSE58144 (B), GSE111974 (D) and GSE103465 (F) datasets.
FIGURE 4
FIGURE 4
Identification of shared DEGs. (A) DEGs upregulated among the GSE58144, GSE111974 and GSE103465 datasets. (B) DEGs downregulated among the GSE58144, GSE111974 and GSE103465 datasets.
FIGURE 5
FIGURE 5
Enrichment of DEGs using Gene Ontology (GO)-BP (A) and Kyoto Encyclopedia of Genes and Genomes (KEGG) (B) analysis. The larger the circle in the figure, the more genes it contains; lower p values are indicated with a stronger red color.
FIGURE 6
FIGURE 6
Sample clustering and network construction of the weighted gene co-expression network analysis. (A) Clustering dendrogram of 43 RIF and 72 control samples. The color intensity was proportional to disease status (control or RIF) or clinical traits (previous implantation, smoking, embryo implantations, age and BMI). (B) Analysis of the scale-free fit index and the mean connectivity for various soft-thresholding powers. The soft-thresholding power of 8 was selected based on the scale-free topology criterion. (C) Dendrogram clustered based on a dissimilarity measure (1-TOM). Gene expression similarity is assessed by a pair-wise weighted correlation metric and clustered based on a topological overlap metric into modules. Each color below represents one co-expression module, and every branch stands for one gene.
FIGURE 7
FIGURE 7
The identification of key modules via weighted gene co-expression network analysis. Heatmap of the correlation between module eigengenes and the clinical traits. The corresponding correlation coefficient along with p-value is given in each cell, and each cell is color-coded by correlation according to the color (legend at right).
FIGURE 8
FIGURE 8
Enrichment analysis of key modules. (A) Kyoto Encyclopedia of Genes and Genomes pathway enrichment analysis in brown and grey modules (top 20). The significance of enrichment gradually increases from blue to red, and the size of the dots indicates the number of genes contained in the corresponding pathway. (B) Gene-Concept Network: Gene corresponding relationship analysis on the top 5 pathways.
FIGURE 9
FIGURE 9
PPI network construction and identification of hub genes. (A) The protein–protein interaction network of the overlapped genes. Key genes identified by “cytoHubba” according to three algorithms “Closeness,” “Radiality” and “Stress” (B–D), respectively. The significance of key genes (top 12) gradually increases from yellow to red.
FIGURE 10
FIGURE 10
(A) The Venn diagram of Hub genes based on three-character calculations from the key modules. (B) Correlation analysis between the nine core target genes from GSE58144, where red represents positive correlation, green represents negative correlation, the darker the color, the higher the correlation. (C) Heatmap of the nine Hub genes that are differentially expressed in the GSE58144, GSE103465 and GSE111974 datasets. (D) The GSE58144 dataset was used to validate the diagnostic effectiveness of the Hub genes for RIF by ROC analysis.
FIGURE 11
FIGURE 11
qRT-PCR analysis of the 9 hub genes expression in the indicated groups. Validation of the expression of these 9 hub genes in our study sample. (A) BECN1, (B) GSK3B, (C) ACTL6A, (D) POLR1B, (E) SNRPD1, (F) PPP2CA (G), PLK4 (H) RBBP7, (I) RFC4.
FIGURE 12
FIGURE 12
Immune cell infiltration in RIF and Control tissues. (A) The composition of 22 kinds of immune cells in each sample was showed in a histogram. (B–G) Correlation of the expression of 9 hub genes with the infiltration of immune cells from GSE58144.
FIGURE 13
FIGURE 13
The heatmap of the correlation analysis between the 9 hub genes and other all genes in RIF tissues from GSE58144, where red represents positive correlation, blue represents negative correlation; the deeper the color, the stronger the correlation. Each column of the heatmap represents one sample and each row represents one gene. The heatmaps showed the top 50 most positively associated significant genes with (A) ACTL6A, (B) BECN1, (C) GSK3B, (D) PLK4, (E) POLR1B, (F) PPP2CA, (G) RBBP7, (H) RFC4 and (I) SNRPD1, respectively.
FIGURE 14
FIGURE 14
The ridge plot of gene set enrichment analysis (GSEA) against the Reactome pathways (top 20) for the 9 hub genes. Significant GSEA results of the top 50 genes most positively or negatively associated with (A) ACTL6A, (B) BECN1, (C) GSK3B, (D) PLK4, (E) POLR1B, (F) PPP2CA, (G) RBBP7, (H) RFC4 and (I) SNRPD1, respectively.

Similar articles

References

    1. Ahmadi M., Pashangzadeh S., Moraghebi M., Sabetian S., Shekari M., Eini F., et al. (2022). Construction of circRNA-miRNA-mRNA network in the pathogenesis of recurrent implantation failure using integrated bioinformatics study. J. Cell Mol. Med. 26 (6), 1853–1864. 10.1111/jcmm.16586 - DOI - PMC - PubMed
    1. Bastu E., Demiral I., Gunel T., Ulgen E., Gumusoglu E., Hosseini M. K., et al. (2019). Potential marker pathways in the endometrium that may cause recurrent implantation failure. Reprod. Sci. 26 (7), 879–890. 10.1177/1933719118792104 - DOI - PubMed
    1. Busnelli A., Reschini M., Cardellicchio L., Vegetti W., Somigliana E., Vercellini P. (2020). How common is real repeated implantation failure? An indirect estimate of the prevalence. Reprod. Biomed. Online 40 (1), 91–97. 10.1016/j.rbmo.2019.10.014 - DOI - PubMed
    1. Chen C., Song X., Wei W., Zhong H., Dai J., Lan Z., et al. (2017). The microbiota continuum along the female reproductive tract and its relation to uterine-related diseases. Nat. Commun. 8 (1), 875. 10.1038/s41467-017-00901-0 - DOI - PMC - PubMed
    1. Chen P. M., Wong C. N., Wong C. N., Chu P. Y. (2023). Actin-like protein 6A expression correlates with cancer stem cell-like features and poor prognosis in ovarian cancer. Int. J. Mol. Sci. 24 (3), 2016. 10.3390/ijms24032016 - DOI - PMC - PubMed