

Acute physiological, biomechanical, and perceptual responses of runners wearing downward-curved carbon fiber insoles
- PMID: 38645727
- PMCID: PMC11026664
- DOI: 10.3389/fspor.2024.1340154
Acute physiological, biomechanical, and perceptual responses of runners wearing downward-curved carbon fiber insoles
Abstract
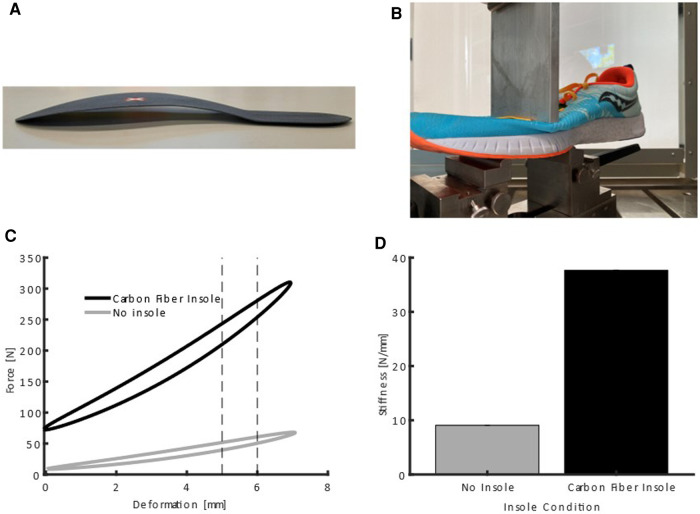
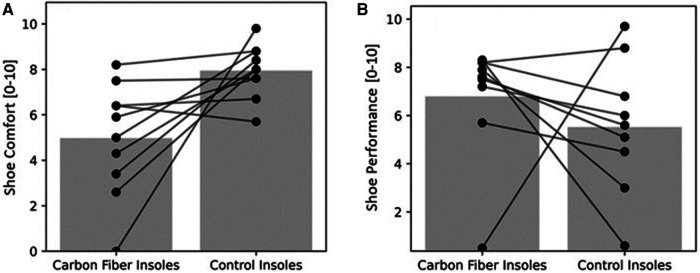
In a randomized controlled cross-over study ten male runners (26.7 ± 4.9 years; recent 5-km time: 18:37 ± 1:07 min:s) performed an incremental treadmill test (ITT) and a 3-km time trial (3-km TT) on a treadmill while wearing either carbon fiber insoles with downwards curvature or insoles made of butyl rubber (control condition) in light road racing shoes (Saucony Fastwitch 9). Oxygen uptake, respiratory exchange ratio, heart rate, blood lactate concentration, stride frequency, stride length and time to exhaustion were assessed during ITT. After ITT, all runners rated their perceived exertion, perceived shoe comfort and perceived shoe performance. Running time, heart rate, blood lactate levels, stride frequency and stride length were recorded during, and shoe comfort and shoe performance after, the 3-km TT. All parameters obtained during or after the ITT did not differ between the two conditions [range: p = 0.188 to 0.948 (alpha value: 0.05); Cohen's d = 0.021 to 0.479] despite the rating of shoe comfort showing better scores for the control insoles (p = 0.001; d = -1.646). All parameters during and after the 3-km TT showed no differences (p = 0.200 to 1.000; d = 0.000 to 0.501) between both conditions except for shoe comfort showing better scores for control insoles (p = 0.017; d = -0.919). Running with carbon fiber insoles with downwards curvature did not change running performance or any submaximal or maximal physiological or biomechanical parameter and perceived exertion compared to control condition. Shoe comfort is impaired while running with carbon fiber insoles. Wearing carbon fiber insoles with downwards curvature during treadmill running is not beneficial when compared to running with control insoles.
Keywords: footwear; running economy; running performance; running shoes; shoe technology.
© 2024 Engel, Zehnter, Yona, Mai, Willwacher, Düking and Sperlich.
Conflict of interest statement
The authors declare that the research was conducted in the absence of any commercial or financial relationships that could be construed as a potential conflict of interest. The author(s) declared that they were an editorial board member of Frontiers, at the time of submission. This had no impact on the peer review process and the final decision.
Figures


Similar articles
-
A Randomized Crossover Study Investigating the Running Economy of Highly-Trained Male and Female Distance Runners in Marathon Racing Shoes versus Track Spikes.Sports Med. 2019 Feb;49(2):331-342. doi: 10.1007/s40279-018-1012-3. Sports Med. 2019. PMID: 30374945 Clinical Trial.
-
Energetics and Biomechanics of Uphill, Downhill and Level Running in Highly-Cushioned Carbon Fiber Midsole Plated Shoes.J Sports Sci Med. 2022 Feb 15;21(1):127-130. doi: 10.52082/jssm.2022.127. eCollection 2022 Mar. J Sports Sci Med. 2022. PMID: 35250342 Free PMC article.
-
Influence of footwear designed to boost energy return on running economy in comparison to a conventional running shoe.J Sports Sci. 2016;34(11):1094-8. doi: 10.1080/02640414.2015.1088961. Epub 2015 Sep 14. J Sports Sci. 2016. PMID: 26367197
-
Variability in Running Economy of Kenyan World-Class and European Amateur Male Runners with Advanced Footwear Running Technology: Experimental and Meta-analysis Results.Sports Med. 2023 Jun;53(6):1255-1271. doi: 10.1007/s40279-023-01816-1. Epub 2023 Mar 2. Sports Med. 2023. PMID: 36862339 Free PMC article.
-
Increased footwear comfort is associated with improved running economy - a systematic review and meta-analysis.Eur J Sport Sci. 2023 Jan;23(1):121-133. doi: 10.1080/17461391.2021.1998642. Epub 2021 Nov 21. Eur J Sport Sci. 2023. PMID: 34726119
Cited by
-
The effects of running shoe longitudinal bending stiffness and midsole energy return on oxygen consumption and ankle mechanics and energetics: A systematic review and meta-analysis.J Sport Health Sci. 2025 Jun 21;14:101069. doi: 10.1016/j.jshs.2025.101069. Online ahead of print. J Sport Health Sci. 2025. PMID: 40550392 Free PMC article. Review.
References
-
- World Athletics. World Athletics website (2024). Available online at: https://worldathletics.org/records/all-time-toplists/road-running/marath... (cited February 5, 2024).
LinkOut - more resources
Full Text Sources