

An evaluation of synthetic data augmentation for mitigating covariate bias in health data
- PMID: 38645766
- PMCID: PMC11026977
- DOI: 10.1016/j.patter.2024.100946
An evaluation of synthetic data augmentation for mitigating covariate bias in health data
Abstract
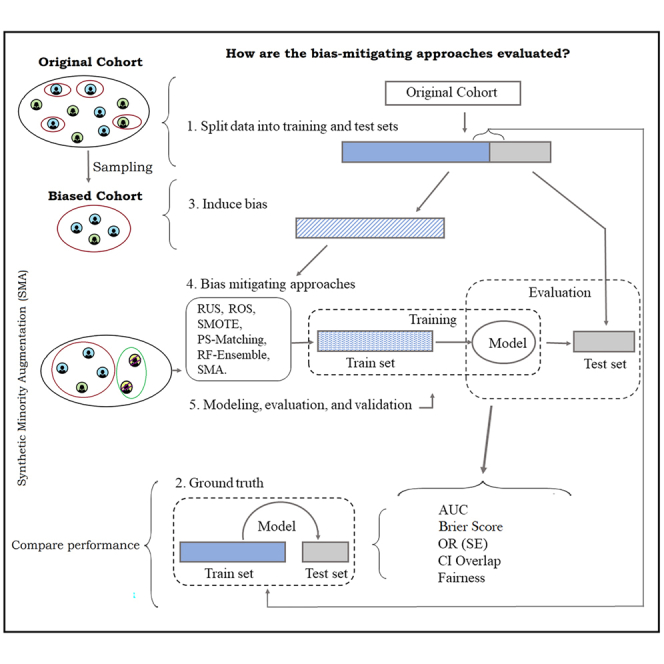
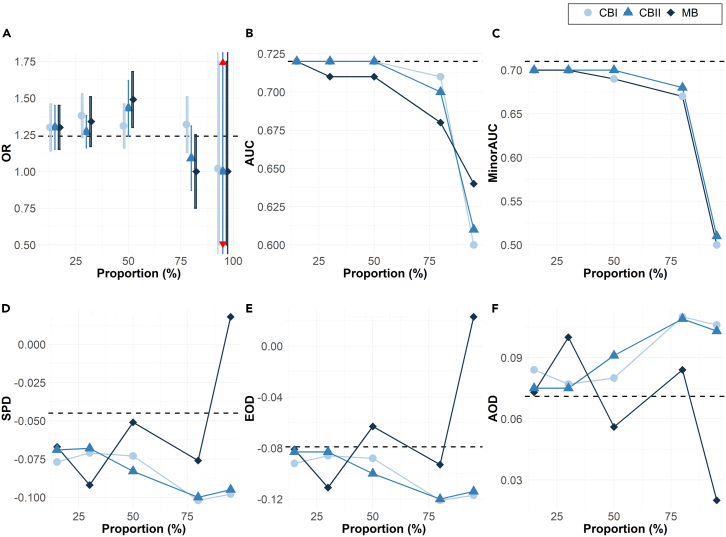
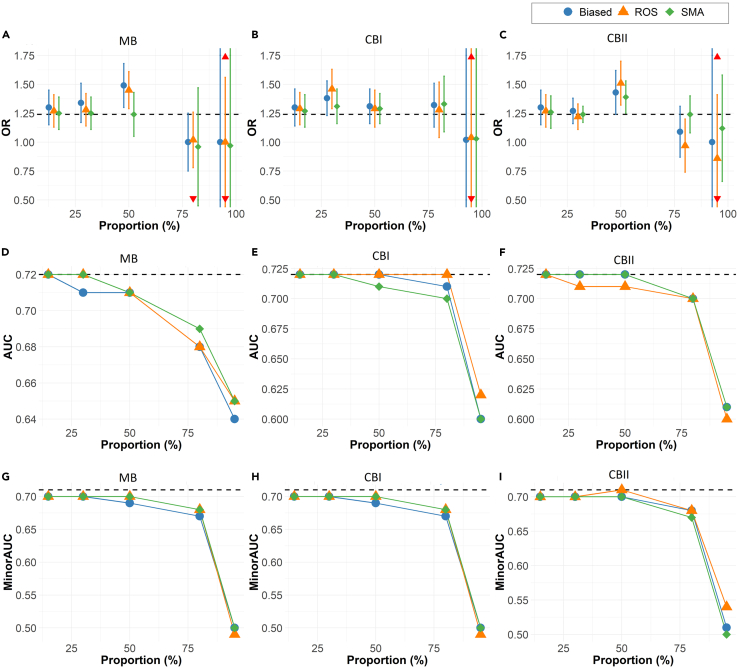
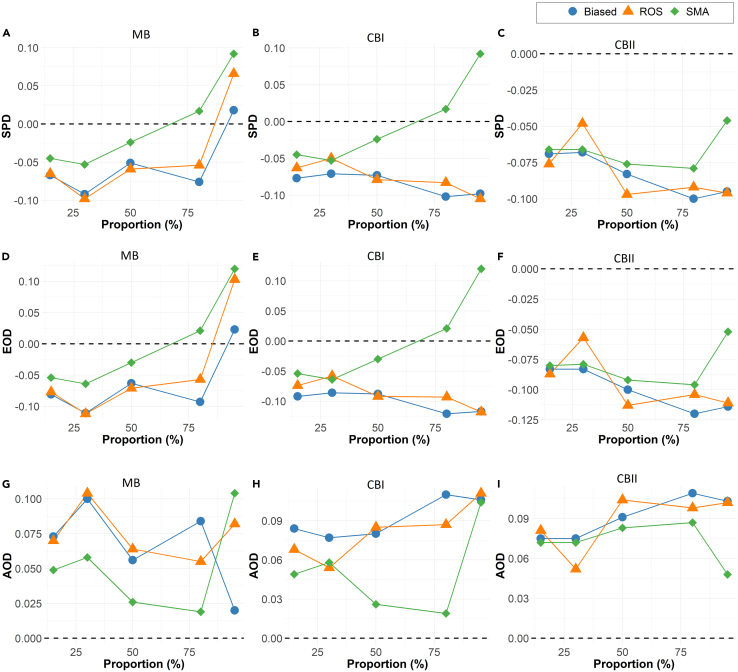
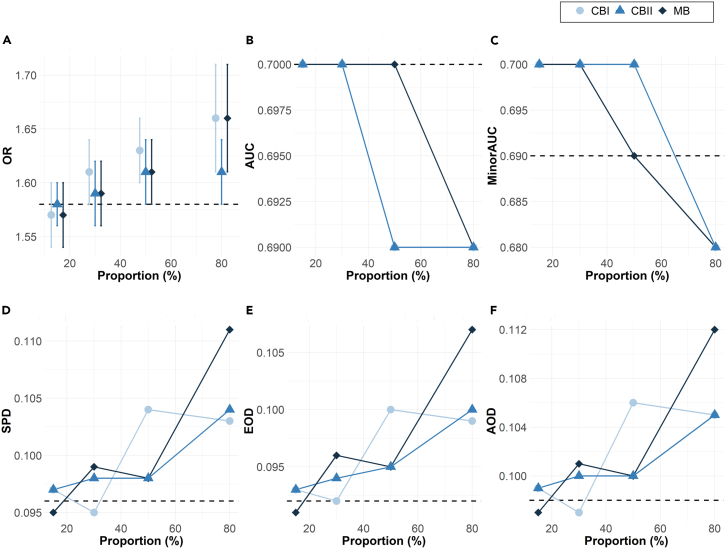
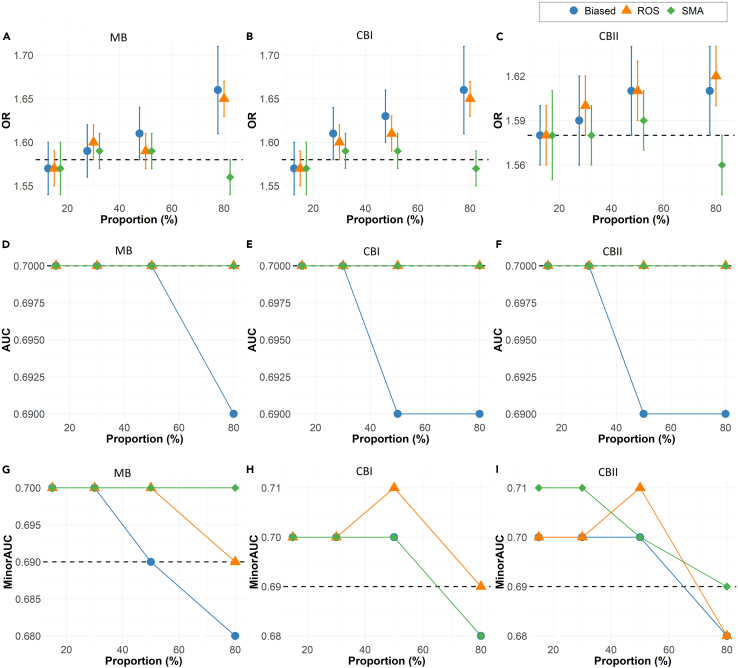
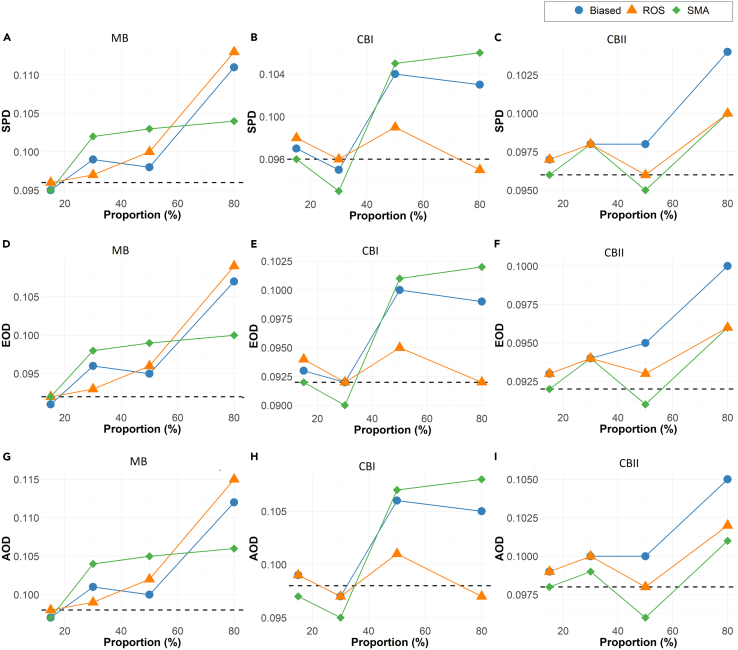
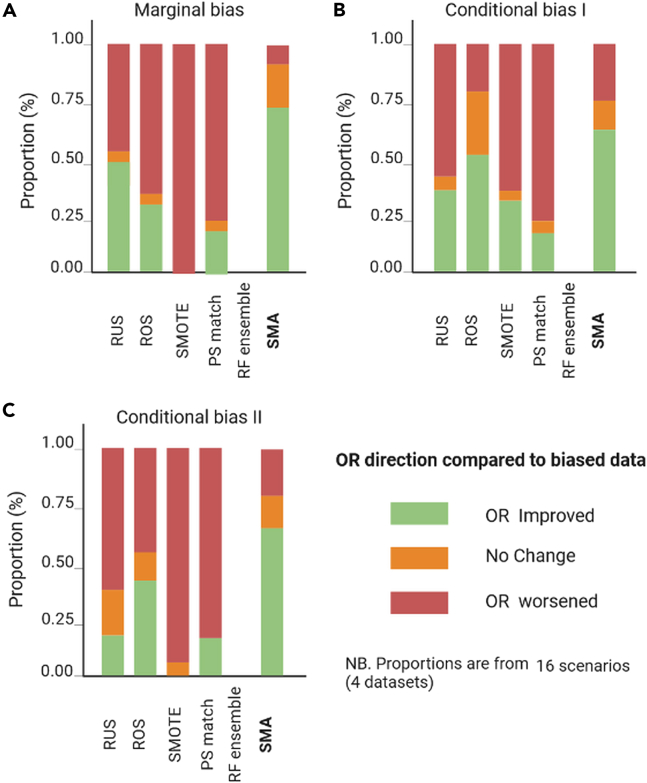
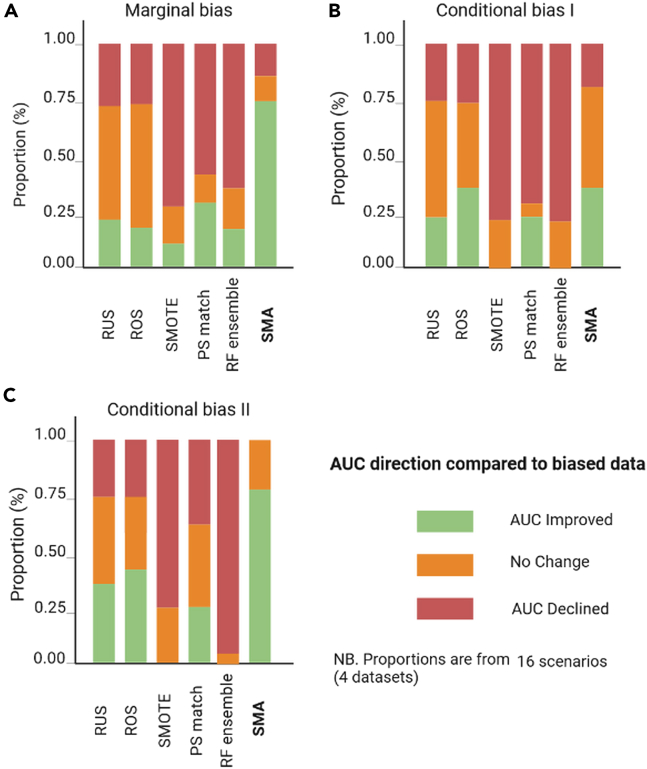
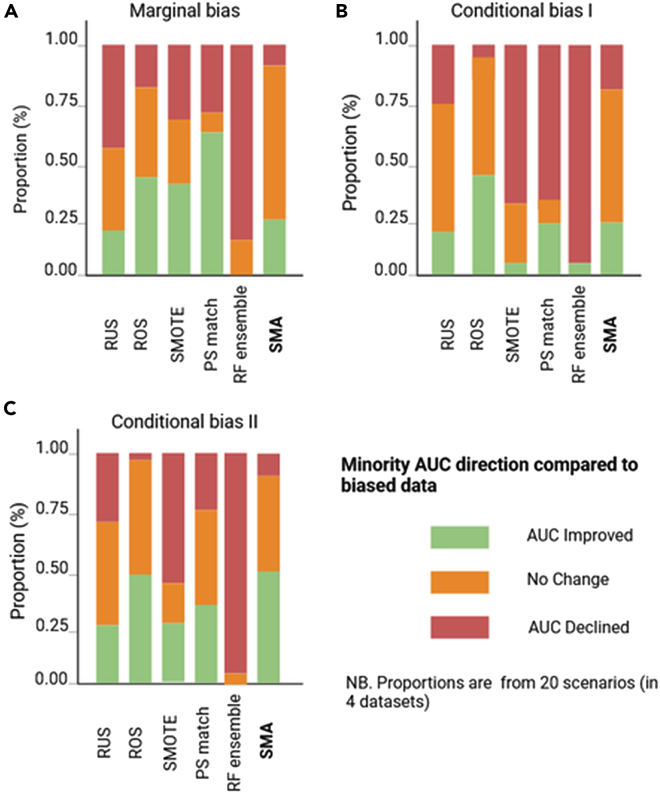
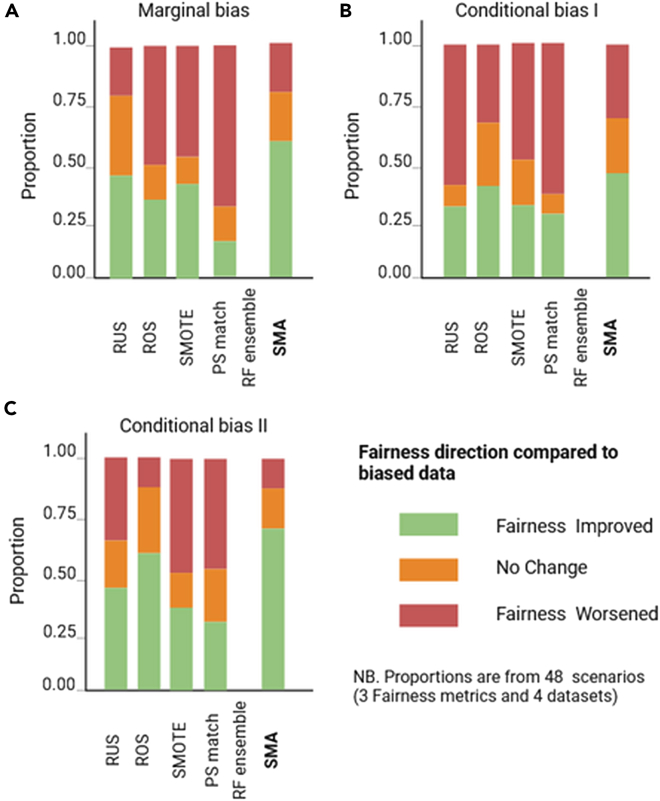
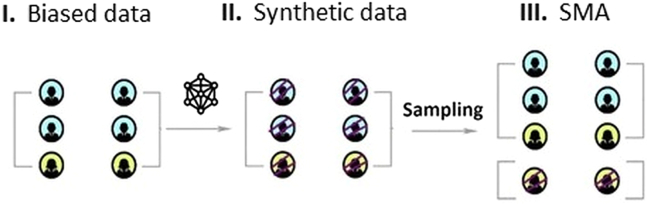
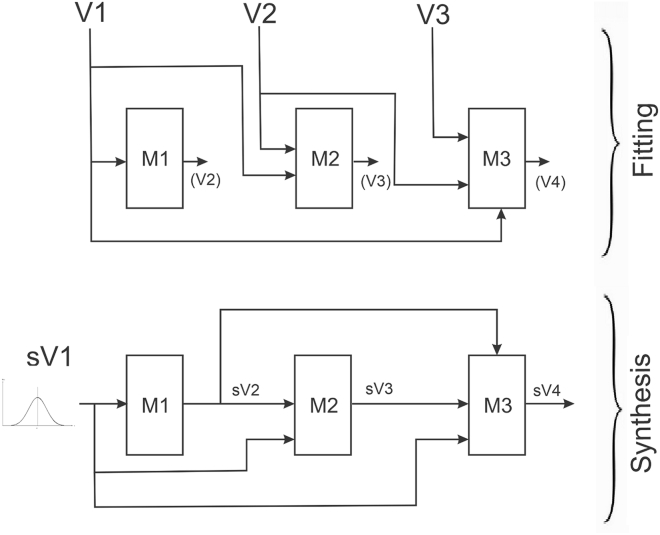
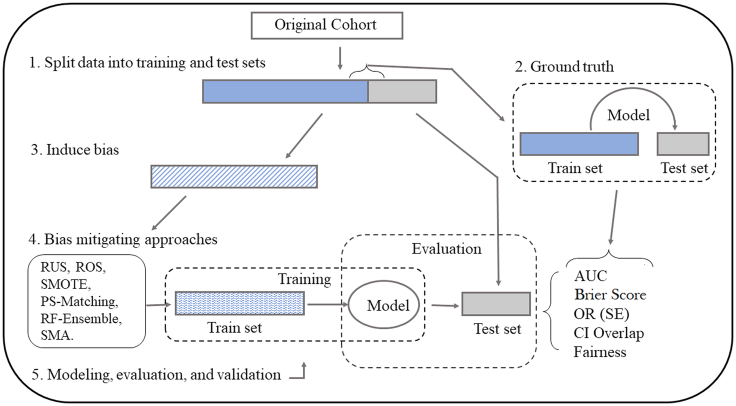
Data bias is a major concern in biomedical research, especially when evaluating large-scale observational datasets. It leads to imprecise predictions and inconsistent estimates in standard regression models. We compare the performance of commonly used bias-mitigating approaches (resampling, algorithmic, and post hoc approaches) against a synthetic data-augmentation method that utilizes sequential boosted decision trees to synthesize under-represented groups. The approach is called synthetic minority augmentation (SMA). Through simulations and analysis of real health datasets on a logistic regression workload, the approaches are evaluated across various bias scenarios (types and severity levels). Performance was assessed based on area under the curve, calibration (Brier score), precision of parameter estimates, confidence interval overlap, and fairness. Overall, SMA produces the closest results to the ground truth in low to medium bias (50% or less missing proportion). In high bias (80% or more missing proportion), the advantage of SMA is not obvious, with no specific method consistently outperforming others.
Keywords: classification; covariate imbalance; data bias; fairness; generative model; synthetic data generation.
© 2024 The Author(s).
Conflict of interest statement
This work was performed in collaboration with Replica Analytics Ltd. This company is a spin-off from the Children’s Hospital of Eastern Ontario Research Institute. K.E.E. is co-founder and has equity in this company.
Figures
Similar articles
-
An evaluation of the replicability of analyses using synthetic health data.Sci Rep. 2024 Mar 24;14(1):6978. doi: 10.1038/s41598-024-57207-7. Sci Rep. 2024. PMID: 38521806 Free PMC article.
-
A Joint Fairness Model with Applications to Risk Predictions for Under-represented Populations.ArXiv [Preprint]. 2021 May 10:arXiv:2105.04648v4. ArXiv. 2021. Update in: Biometrics. 2023 Jun;79(2):826-840. doi: 10.1111/biom.13632. PMID: 34012993 Free PMC article. Updated. Preprint.
-
Implications of resampling data to address the class imbalance problem (IRCIP): an evaluation of impact on performance between classification algorithms in medical data.JAMIA Open. 2023 May 31;6(2):ooad033. doi: 10.1093/jamiaopen/ooad033. eCollection 2023 Jul. JAMIA Open. 2023. PMID: 37266187 Free PMC article.
-
Optimal surveillance strategies for patients with stage 1 cutaneous melanoma post primary tumour excision: three systematic reviews and an economic model.Health Technol Assess. 2021 Nov;25(64):1-178. doi: 10.3310/hta25640. Health Technol Assess. 2021. PMID: 34792018
-
Utilizing data sampling techniques on algorithmic fairness for customer churn prediction with data imbalance problems.F1000Res. 2021 Sep 30;10:988. doi: 10.12688/f1000research.72929.2. eCollection 2021. F1000Res. 2021. PMID: 36071889 Free PMC article. Review.
Cited by
-
Generative AI mitigates representation bias and improves model fairness through synthetic health data.PLoS Comput Biol. 2025 May 19;21(5):e1013080. doi: 10.1371/journal.pcbi.1013080. eCollection 2025 May. PLoS Comput Biol. 2025. PMID: 40388536 Free PMC article.
-
Enhancement of Fairness in AI for Chest X-ray Classification.AMIA Annu Symp Proc. 2025 May 22;2024:551-560. eCollection 2024. AMIA Annu Symp Proc. 2025. PMID: 40417510 Free PMC article.
-
Improving medical machine learning models with generative balancing for equity and excellence.NPJ Digit Med. 2025 Feb 14;8(1):100. doi: 10.1038/s41746-025-01438-z. NPJ Digit Med. 2025. PMID: 39953146 Free PMC article.
-
On the evaluation of synthetic longitudinal electronic health records.BMC Med Res Methodol. 2024 Aug 14;24(1):181. doi: 10.1186/s12874-024-02304-4. BMC Med Res Methodol. 2024. PMID: 39143466 Free PMC article.
-
Clinical Algorithms and the Legacy of Race-Based Correction: Historical Errors, Contemporary Revisions and Equity-Oriented Methodologies for Epidemiologists.Clin Epidemiol. 2025 Jul 12;17:647-662. doi: 10.2147/CLEP.S527000. eCollection 2025. Clin Epidemiol. 2025. PMID: 40673267 Free PMC article. Review.
References
-
- Yadav P., Steinbach M., Kumar V., Simon G. Mining Electronic Health Records (EHRs): A Survey. ACM Comput. Surv. 2018;50:1–40. doi: 10.1145/3127881. - DOI
-
- Glauner P., Valtchev P., State R. Impact of biases in big data. arXiv. 2018 doi: 10.48550/arXiv.1803.00897. Preprint at. - DOI
-
- Cirillo D., Catuara-Solarz S., Morey C., Guney E., Subirats L., Mellino S., Gigante A., Valencia A., Rementeria M.J., Chadha A.S., Mavridis N. Sex and gender differences and biases in artificial intelligence for biomedicine and healthcare. Npj Digit. Med. 2020;3:81. doi: 10.1038/s41746-020-0288-5. - DOI - PMC - PubMed
LinkOut - more resources
Full Text Sources
