

Epidemiological feature analysis of SVEIR model with control strategy and variant evolution
- PMID: 38646061
- PMCID: PMC11031813
- DOI: 10.1016/j.idm.2024.03.005
Epidemiological feature analysis of SVEIR model with control strategy and variant evolution
Abstract
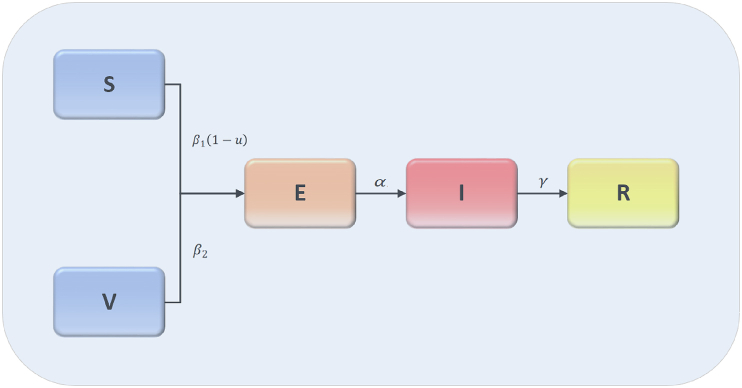
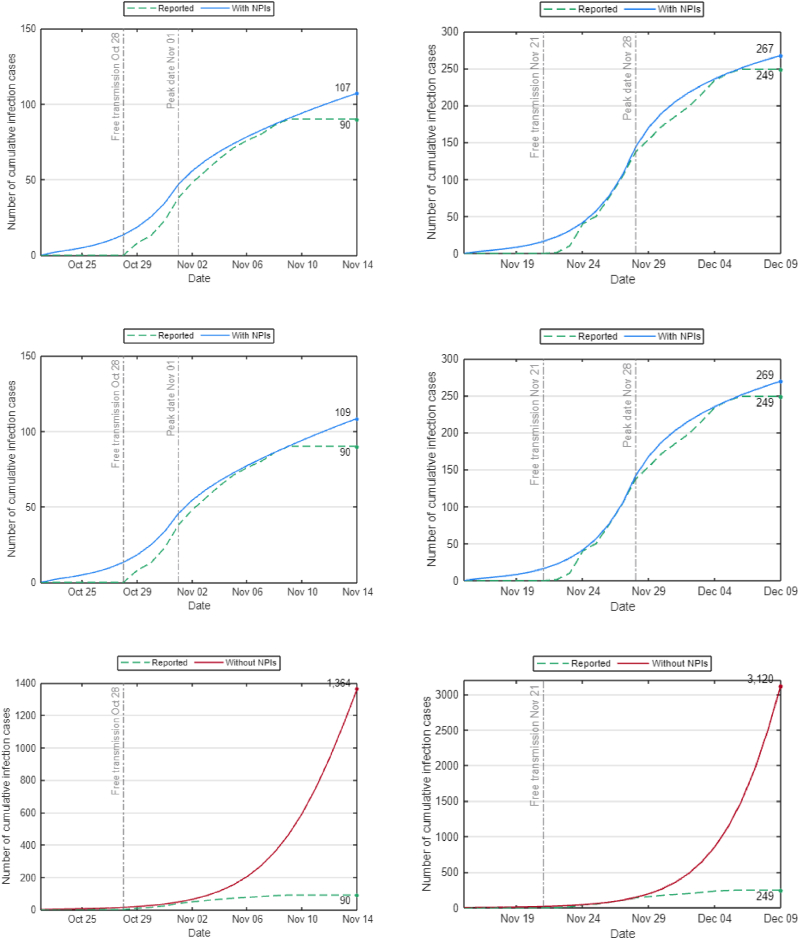
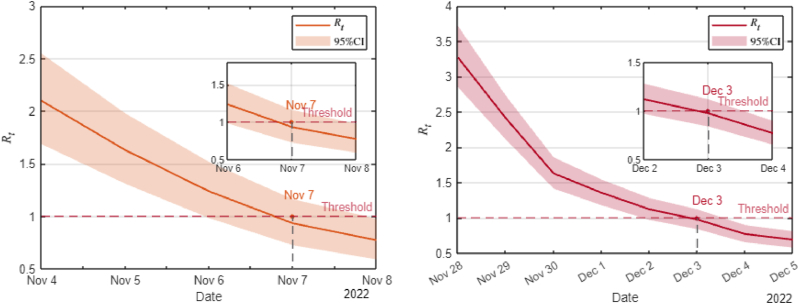
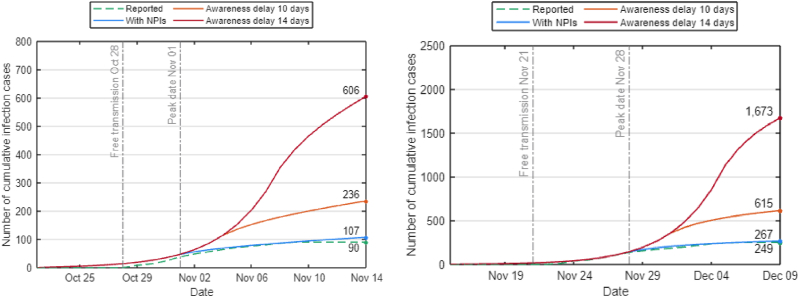
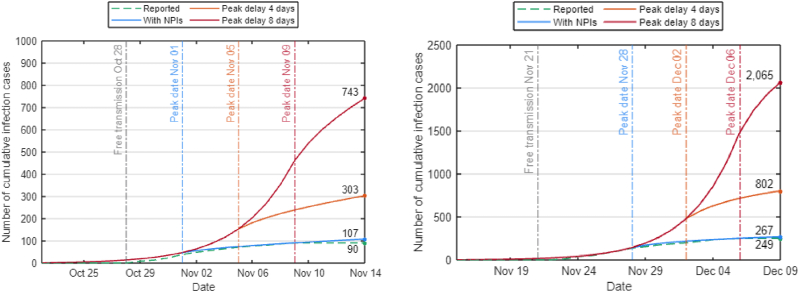
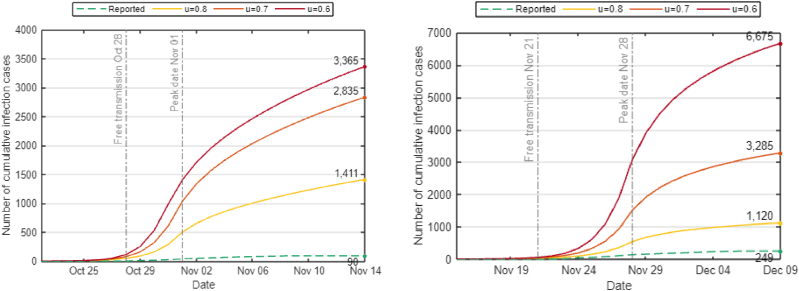
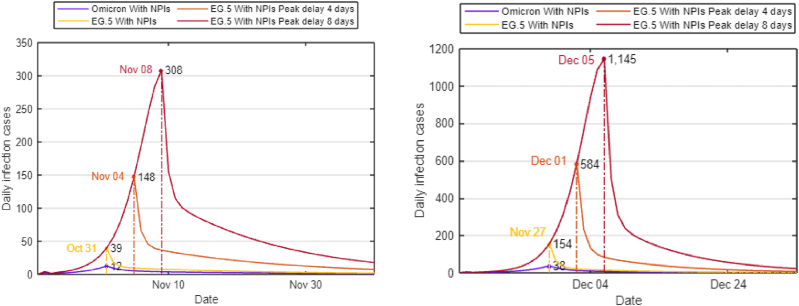
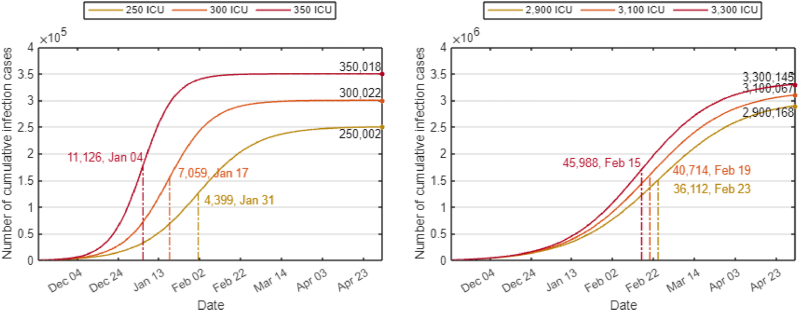
The complex interactions were performed among non-pharmaceutical interventions, vaccinations, and hosts for all epidemics in mainland China during the spread of COVID-19. Specially, the small-scale epidemic in the city described by SVEIR model was less found in the current studies. The SVEIR model with control was established to analyze the dynamical and epidemiological features of two epidemics in Jinzhou City led by Omicron variants before and after Twenty Measures. In this study, the total population (N) of Jinzhou City was divided into five compartments: the susceptible (S), the vaccinated (V), the exposed (E), the infected (I), and the recovered (R). By surveillance data and the SVEIR model, three methods (maximum likelihood method, exponential growth rate method, next generation matrix method) were governed to estimate basic reproduction number, and the results showed that an increasing tendency of basic reproduction number from Omicron BA.5.2 to Omicron BA.2.12.1. Meanwhile, the effective reproduction number for two epidemics were investigated by surveillance data, and the results showed that Jinzhou wave 1 reached the peak on November 1 and was controlled 7 days later, and that Jinzhou wave 2 reached the peak on November 28 and was controlled 5 days later. Moreover, the impacts of non-pharmaceutical interventions (awareness delay, peak delay, control intensity) were discussed extensively, the variations of infection scales for Omicron variant and EG.5 variant were also discussed. Furthermore, the investigations on peaks and infection scales for two epidemics in dynamic zero-COVID policy were operated by the SVEIR model with control. The investigations on public medical requirements of Jinzhou City and Liaoning Province were analyzed by using SVEIR model without control, which provided a possible perspective on variant evolution in the future.
Keywords: COVID-19; Control strategy; SVEIR model; Twenty measures; Variant evolution.
© 2024 The Authors.
Conflict of interest statement
The authors declare that they have no known competing financial interests or personal relationships that could have appeared to influence the work reported in this paper.
Figures

Similar articles
-
Dynamics of an SVEIR transmission model with protection awareness and two strains.Infect Dis Model. 2024 Oct 10;10(1):207-228. doi: 10.1016/j.idm.2024.10.001. eCollection 2025 Mar. Infect Dis Model. 2024. PMID: 39469221 Free PMC article.
-
Studying the impacts of variant evolution for a generalized age-group transmission model.PLoS One. 2024 Jul 5;19(7):e0306554. doi: 10.1371/journal.pone.0306554. eCollection 2024. PLoS One. 2024. PMID: 38968178 Free PMC article.
-
An SEIHR model with age group and social contact for analysis of Fuzhou COVID-19 large wave.Infect Dis Model. 2024 Apr 22;9(3):728-743. doi: 10.1016/j.idm.2024.04.003. eCollection 2024 Sep. Infect Dis Model. 2024. PMID: 38689855 Free PMC article.
-
Rapid review and meta-analysis of serial intervals for SARS-CoV-2 Delta and Omicron variants.BMC Infect Dis. 2023 Jun 26;23(1):429. doi: 10.1186/s12879-023-08407-5. BMC Infect Dis. 2023. PMID: 37365505 Free PMC article. Review.
-
Role of previous infection with SARS-CoV-2 in protecting against omicron reinfections and severe complications of COVID-19 compared to pre-omicron variants: a systematic review.BMC Infect Dis. 2023 Jun 26;23(1):432. doi: 10.1186/s12879-023-08328-3. BMC Infect Dis. 2023. PMID: 37365490 Free PMC article.
Cited by
-
On improving public health after COVID-19 epidemic: A fractal-fractional mathematical solutions with short memory effect and efficient optimal strategies.PLoS One. 2025 May 28;20(5):e0321195. doi: 10.1371/journal.pone.0321195. eCollection 2025. PLoS One. 2025. PMID: 40435157 Free PMC article.
-
Dynamics of an SVEIR transmission model with protection awareness and two strains.Infect Dis Model. 2024 Oct 10;10(1):207-228. doi: 10.1016/j.idm.2024.10.001. eCollection 2025 Mar. Infect Dis Model. 2024. PMID: 39469221 Free PMC article.
-
Studying the impacts of variant evolution for a generalized age-group transmission model.PLoS One. 2024 Jul 5;19(7):e0306554. doi: 10.1371/journal.pone.0306554. eCollection 2024. PLoS One. 2024. PMID: 38968178 Free PMC article.
-
HCV transmission model with protection awareness in an SEACTR community.Infect Dis Model. 2025 Jan 7;10(2):559-570. doi: 10.1016/j.idm.2024.12.014. eCollection 2025 Jun. Infect Dis Model. 2025. PMID: 39925973 Free PMC article.
References
-
- Chowell G., Nishiura H. 2009. The effective reproduction number as a prelude to statistical estimation of time-dependent epidemic trends. mathematical and statistical estimation approaches in epidemiology. Mathematical and Statistical Estimation Approaches in Epidemiology; pp. 103–121.
LinkOut - more resources
Full Text Sources
