. 2024 Apr 5:15:1360615.
doi: 10.3389/fimmu.2024.1360615. eCollection 2024.

Immunoglobulins and serum proteins impair anti-tumor NK cell effector functions in malignant ascites

Affiliations

Immunoglobulins and serum proteins impair anti-tumor NK cell effector functions in malignant ascites

Antonio Hrvat et al. Front Immunol. .

Erratum in

Abstract

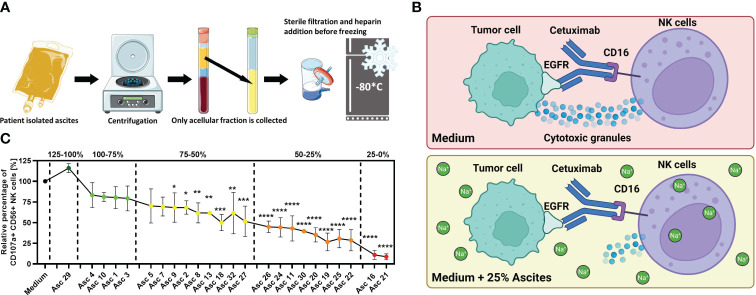
Introduction: Malignant ascites indicates ovarian cancer progression and predicts poor clinical outcome. Various ascites components induce an immunosuppressive crosstalk between tumor and immune cells, which is poorly understood. In our previous study, imbalanced electrolytes, particularly high sodium content in malignant ascites, have been identified as a main immunosuppressive mechanism that impaired NK and T-cell activity.

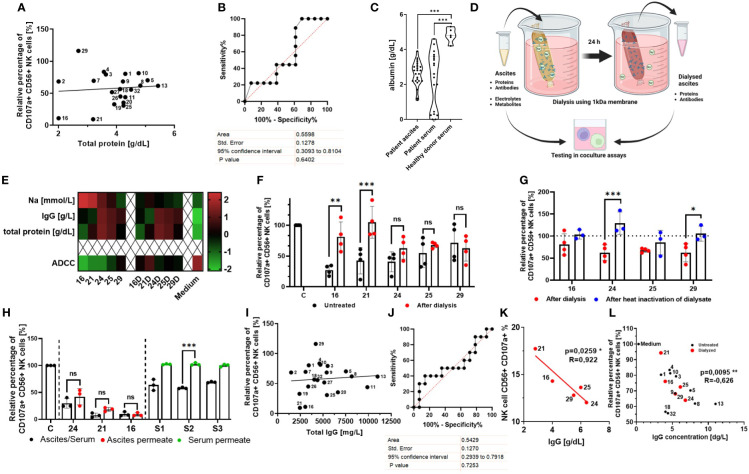
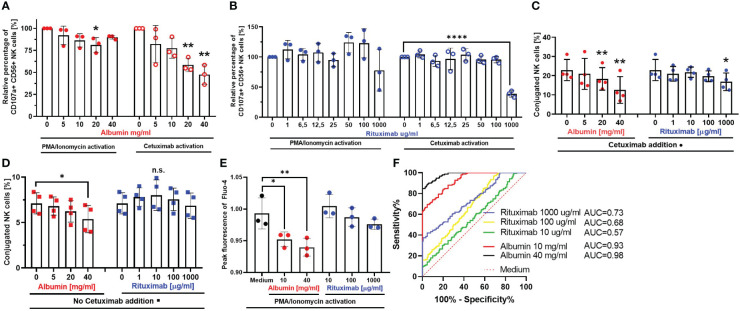
Methods: In the present study, we explored the role of high concentrations of ascites proteins and immunoglobulins on antitumoral NK effector functions. To this end, a coculture system consisting of healthy donor NK cells and ovarian cancer cells was used. The anti-EGFR antibody Cetuximab was added to induce antibody-dependent cellular cytotoxicity (ADCC). NK activity was assessed in the presence of different patient ascites samples and immunoglobulins that were isolated from ascites.

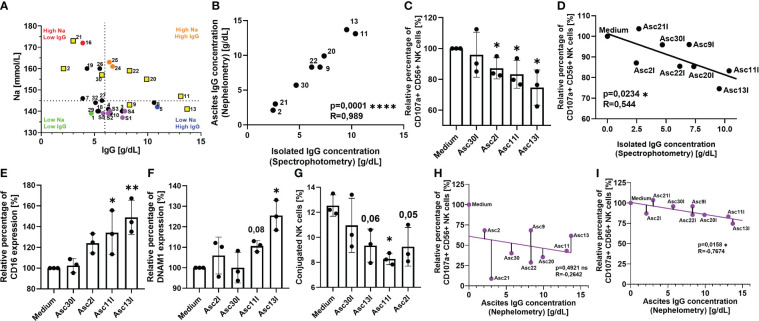
Results: Overall high protein concentration in ascites impaired NK cell degranulation, conjugation to tumor cells, and intracellular calcium signaling. Immunoglobulins isolated from ascites samples competitively interfered with NK ADCC and inhibited the conjugation to target cells. Furthermore, downregulation of regulatory surface markers CD16 and DNAM-1 on NK cells was prevented by ascites-derived immunoglobulins during NK cell activation.

Conclusion: Our data show that high protein concentrations in biological fluids are able to suppress antitumoral activity of NK cells independent from the mechanism mediated by imbalanced electrolytes. The competitive interference between immunoglobulins of ascites and specific therapeutic antibodies could diminish the efficacy of antibody-based therapies and should be considered in antibody-based immunotherapies.

Keywords: NK cells; albumin; antibody; ascites; immunoglobulins; immunosuppression; ovarian cancer; tumor microenvironment.


Conflict of interest statement

The authors declare that the research was conducted in the absence of any commercial or financial relationships that could be construed as a potential conflict of interest. The author(s) declared that they were an editorial board member of Frontiers, at the time of submission. This had no impact on the peer review process and the final decision.

Figures

Figure 1
Figure 1
Malignant peritoneal ascites impairs NK cell effector functions in vitro. (A) Processing of ascites samples. Graphical illustration of initial processing of ascites samples derived from patients with malignant ascites and storage of ascitic fluid after depletion of cellular components. (B) Illustration of the NK–tumor cell coculture system under the ADCC condition. This experimental setup was used to assess the effects of ascites or healthy donor serum on NK cell effector function. The same setup in the previous study was used, which revealed that malignant ascites is a sodium-imbalanced environment (24). Illustrations were created with BioRender and Sevier Medical Art. (C) Antibody-dependent cellular cytotoxicity (ADCC) of NK cells (NK) in the presence of selected ascites samples. Resting healthy donor NK cells were coincubated in 1:1 ratio with IGROV1- cells for 6 h with the addition of ADCC-inducing anti-EGFR-antibody Cetuximab (1 µg/mL) and benign ascites (Asc 29) or malignant ascites (all other 23 samples). We could differentiate samples with only weak (green), with intermediate (yellow), strong (orange), and very strong (red) inhibitory potential and sample no. 29 with no inhibition of NK ADCC (dark green) (24). Each datapoint represents one healthy NK cell donor. The relative percentages are shown after normalization to normal medium control. Data are presented as individual values with mean value as center of error bar ± standard deviation. Each datapoint represents one healthy donor. The normalization was done according to normal medium control. For significance testing, ordinary one-way (C) ANOVA and Dunnett’s post-hoc test were used.
Figure 2
Figure 2
Normalization of imbalanced electrolytes in malignant ascites only partially rescues NK cell ADCC, indicating the existence of an additional inhibitory mechanism. (A, B) Relationship between NK ADCC and protein content in ascites samples. (A) Pearson correlation shows no significant correlation between NK ADCC [percentage of CD107a-positive NK cells] and protein content [g/dL]. (B) ROC (receiver operating characteristic) curve depicting overall protein content as nonsignificant random classifiers. (C) Comparison of albumin content in biological fluids. Violin plot illustrating the comparison of albumin content [g/dL] in patient ascites, patient serum, and healthy donor serum. (D) Dialysis of ascites samples. Schematic illustration of normalizing ascites electrolyte content via dialysis. Ascites samples were processed in medium overnight using 1-kDa cutoff dialysis tubing to normalize electrolyte composition. Inhibitory effects were assessed in coculture assays. (E) Ascites composition before and after dialysis. Heatmap showing concentrations of sodium, IgG, and total protein in selected ascites samples (, , , and 26) before (left) and after dialysis (right) (16D,21D,24D,25D,29D) and in culture medium for control (24). (F) NK ADCC in the presence of ascites before and after dialysis. Resting NK cells were coincubated in 1:1 ratio with IGROV1 cells and Cetuximab in the presence of untreated (black) or dialyzed ascites (red). After 6 h, expression of CD107a on NK cells was determined by flow cytometry (24). (G) NK ADCC in the presence of dialyzed ascites before and after heat inactivation. Resting NK cells were coincubated in 1:1 ratio with IGROV1-cells and Cetuximab with dialyzed ascites (red) and after additional heat inactivation at 56°C for 30 min (blue). (H) NK ADCC in the presence of ascites or healthy donor serum after protein depletion. Resting NK cells were coincubated in 1:1 ratio with IGROV1 cells with the addition of Cetuximab in the presence of untreated serum or ascites (black), protein-less ascites permeate (red) and serum permeate (green). After 6 h, expression of CD107a on NK cells was determined by flow cytometry. (I, J) Relationship between NK ADCC and IgG-concentration in ascites samples. (I) Pearson correlation shows no significant correlation of NK ADCC [percentage of CD107a-positive NK cells] to content of IgG-immunoglobulins [mg/L]. (J) ROC (receiver operating characteristic) curve depicting immunoglobulins as nonsignificant random classifiers. (K, L) Relationship between NK ADCC and IgG-concentrations in ascites samples with normalized or low sodium content. (K) Pearson correlation shows significant correlation of NK ADCC to content of IgG-immunoglobulins [mg/L] in dialyzed ascites samples (red dots). (L) Pearson correlation shows significant correlation of NK ADCC to IgG immunoglobulins in dialyzed ascites samples (red dots) and untreated samples with physiological or low sodium content (<145 mM) (black dots). Data are presented as individual values with mean value as center of error bar ± standard deviation. Each datapoint represents one healthy donor. The normalization was done according to normal medium control. For significance testing, ordinary one-way (C, F, G, H) ANOVA and Sidak’s post-hoc test, two-tailed Pearson correlation (A, I, K, L), and ROC analysis (B, J) were used. *p < 0.05, **p < 0.01, ***p < 0.001.
Figure 3
Figure 3
Irrelevant antibodies and serum proteins interfere with various NK cell effector functions. Spontaneous NK cell degranulation and ADCC in the presence of serum protein albumin (A) or irrelevant antibody Rituximab (B) NK cells were stimulated with PMA (50 ng/mL)/Ionomycin (1 µg/mL) (left panels) or coincubated with IGROV-1 (1:1 ratio) and Cetuximab (1 µg/mL) (right panels) in the presence of either albumin (5, 10, 20, and 40 mg/mL) or Rituximab (1, 6.5, 12.5, 25, 50, 100, and 1,000 μg/mL) for 6 h. Percentage of CD107a-positive NK cells was assessed by flow cytometry. (C, D) NK-TC conjugation in the presence (C) or absence (D) of Cetuximab. NK cells and IGROV1- cells were mixed in 4:1 effector-to-target ratio and the addition of albumin (5, 10, 20, and 40 mg/mL) or Rituximab (1, 10, 100, and 1,000 μg/mL) with (C) or without (D) Cetuximab (1 µg/mL). Percentage of NK-TC-conjugates was assessed by flow cytometry. (E, F) Intracellular calcium-flux during NK cell stimulation in the presence of albumin and Rituximab. NK cells were exposed to PMA (50 ng/mL)/Ionomycin (1 µg/mL) in the presence of either medium or medium supplemented with albumin (10 and 40 mg/mL) and Rituximab (10,100, and 1,000 μg/mL), respectively. Intracellular Ca2+ flux was monitored via Fluo-4 dye. (E) Fold increase of 480/25 absorbance at peak of calcium flux. (F) ROC analysis shows significant difference between calcium flux curves in albumin (red and black line) compared to medium (dotted red line). Each datapoint represents one ascites sample. For significance testing, ordinary one-way ANOVA (A–E) with Dunnett’s post-hoc test and ROC analysis (F) were performed. ns, non-significant; *p < 0.05, **p < 0.01, ****p < 0.0001.
Figure 4
Figure 4
Antibodies isolated from ascites samples competitively inhibit Cetuximab-mediated NK cell cytotoxicity. (A) Ascites samples have heterogeneous sodium and IgG composition. Pearson correlation of sodium and IgG content in ascites and serum samples as determined by clinical chemistry. Dotted line divides ascites samples into high-sodium/low-sodium (red/orange versus green/blue) and high-IgG/low-IgG (orange/blue versus red/green) using physiological referent values for both components, serum samples are marked in purple. Yellow squares mark selected ascites samples for IgG isolation. (B) Quantification of ascites IgG immunoglobulins isolated by chromatography. UV absorbance at 280 nm was used to estimate amount of isolated IgG (black dots). Pearson correlation of isolated IgG immunoglobulins to nephelometry quantified ascites immunoglobulins. (CD) NK ADCC in the presence of ascites isolated immunoglobulins. Resting healthy donor NK cells were coincubated in 1:1 ratio with A431 cells for 6 h with the addition of ADCC-inducing anti-EGFR-antibody Cetuximab (1 µg/mL) and 25% addition of isolated ascites immunoglobulins. (C) NK ADCC in the presence of ascites isolated immunoglobulins. NK ADCC was quantified by flow cytometry after 6 h of coincubation. (D) Pearson correlation shows significant correlation of NK ADCC to ascites isolated immunoglobulins. (E, F) Expression of surface markers on NK cells in the presence of isolated ascites immunoglobulins. Isolated healthy donor NK cells were coincubated with A431 cells (1:1 ratio) and Cetuximab (1 μg/mL) in either medium or medium supplemented with 25% of isolated immunoglobulin suspension. After 18 h, expression of (E) CD16 and (F) DNAM-1 were measured by FACS. (G) Ascites isolated immunoglobulins impair NK-TC conjugation. NK cells and A431 were mixed in 1:4 effector-to-target ratio in either normal medium or medium with 25% addition of isolated ascites immunoglobulins. Percentage of NK-TC-conjugates was assessed by flow cytometry. (H, I) Electrolyte imbalance in malignant ascites masks the inhibitory effect of immunoglobulins. (H) Pearson correlation of ascites IgG content to NK ADCC in the presence of unprocessed ascites. (I) Pearson correlation of ascites IgG content to NK ADCC in the presence of isolated ascites immunoglobulins. Each datapoint represents one healthy donor. The relative percentages are shown after normalization to normal medium control. For significance testing, two-tailed Pearson correlation (A, B, D, H, I), ordinary one-way ANOVA followed by Dunnett’s post-hoc test (E–G), and unpaired t-test (C) were used. ns, non-significant; *p < 0.05, **p < 0.01, ****p < 0.0001.

Similar articles

References

    1. Shih Ie M, Kurman RJ. Ovarian tumorigenesis: a proposed model based on morphological and molecular genetic analysis. Am J Pathol. (2004) 164:1511–8. doi: 10.1016/s0002-9440(10)63708-x - DOI - PMC - PubMed
    1. Szender JB, Emmons T, Belliotti S, Dickson D, Khan A, Morrell K, et al. . Impact of ascites volume on clinical outcomes in ovarian cancer: A cohort study. Gynecol Oncol. (2017) 146:491–7. doi: 10.1016/j.ygyno.2017.06.008 - DOI - PMC - PubMed
    1. Kajiyama H, Shibata K, Terauchi M, Yamashita M, Ino K, Nawa A, et al. . Chemoresistance to paclitaxel induces epithelial-mesenchymal transition and enhances metastatic potential for epithelial ovarian carcinoma cells. Int J Oncol. (2007) 31:277–83. doi: 10.3892/ijo.31.2.277 - DOI - PubMed
    1. Xiang LW, Xue H, Ha MW, Yu DY, Xiao LJ, Zheng HC. The effects of REG4 expression on chemoresistance of ovarian cancer. J Obstet Gynaecol. (2022) 42:3149–57. doi: 10.1080/01443615.2022.2106834 - DOI - PubMed
    1. Cohen M, Pierredon S, Wuillemin C, Delie F, Petignat P. Acellular fraction of ovarian cancer ascites induce apoptosis by activating JNK and inducing BRCA1, Fas and FasL expression in ovarian cancer cells. Oncoscience. (2014) 1:262–71. doi: 10.18632/oncoscience.31 - DOI - PMC - PubMed

Publication types

MeSH terms