. 2024 Apr 21;8(4):e584.
doi: 10.1002/pld3.584. eCollection 2024 Apr.

Pectin methylesterification state and cell wall mechanical properties contribute to neighbor proximity-induced hypocotyl growth in Arabidopsis

Affiliations

Pectin methylesterification state and cell wall mechanical properties contribute to neighbor proximity-induced hypocotyl growth in Arabidopsis

Fabien Sénéchal et al. Plant Direct. .

Abstract

Plants growing with neighbors compete for light and consequently increase the growth of their vegetative organs to enhance access to sunlight. This response, called shade avoidance syndrome (SAS), involves photoreceptors such as phytochromes as well as phytochrome interacting factors (PIFs), which regulate the expression of growth-mediating genes. Numerous cell wall-related genes belong to the putative targets of PIFs, and the importance of cell wall modifications for enabling growth was extensively shown in developmental models such as dark-grown hypocotyl. However, the contribution of the cell wall in the growth of de-etiolated seedlings regulated by shade cues remains poorly established. Through analyses of mechanical and biochemical properties of the cell wall coupled with transcriptomic analysis of cell wall-related genes from previously published data, we provide evidence suggesting that cell wall modifications are important for neighbor proximity-induced elongation. Further analysis using loss-of-function mutants impaired in the synthesis and remodeling of the main cell wall polymers corroborated this. We focused on the cgr2cgr3 double mutant that is defective in methylesterification of homogalacturonan (HG)-type pectins. By following hypocotyl growth kinetically and spatially and analyzing the mechanical and biochemical properties of cell walls, we found that methylesterification of HG-type pectins was required to enable global cell wall modifications underlying neighbor proximity-induced hypocotyl growth. Collectively, our work suggests that plant competition for light induces changes in the expression of numerous cell wall genes to enable modifications in biochemical and mechanical properties of cell walls that contribute to neighbor proximity-induced growth.


Conflict of interest statement

The authors did not report any conflict of interest.

Figures

FIGURE 1
FIGURE 1
Low R:FR induces fast growth in the middle part of the hypocotyl. Length of the hypocotyl epidermis cells in response to high and low R:FR treatments. After 4 days under high R:FR (black curve), Col‐0 seedlings were grown for 1 day under high R:FR (yellow curve) or low R:FR (blue curve). The length of the epidermis cells was plotted from the top to the bottom part of the hypocotyl. The curves show means in μm ± confidence intervals (shaded areas).
FIGURE 2
FIGURE 2
Low R:FR induces changes in mechanical and cell wall properties of the hypocotyl. (a) Elastic properties of hypocotyl assessed under high and low R:FR treatment. Hypocotyls were frozen and thawed then subjected to cycles of application and removal of 5 mN of force using an automated confocal micro extensometer (see Section 4). The average magnitude of strain incurred by seedlings grown in a high R:FR (yellow bars) or low R:FR (blue bars) light regime after 1 (4 days + 1 day) and 3 days (4 days + 3 days) is shown. Bright‐field images were collected every 645 ms and strain was computed from regions that were tracked in the images using the automated confocal micro‐extensometer (ACME) tracker software. The bars show means in % ± SD (n > 10 independent seedlings, at least five oscillations were made). Pairwise comparisons were made using Welch t‐test brackets indicated statistical tests that were made with significance p < .1*, p < .05**, and p < .01***. (b, c) Cell wall properties in the middle part of the hypocotyl under high and low R:FR treatments. Cell wall chemical bounds were analyzed by Fourier‐transform infrared (FTIR) microspectroscopy. For each hypocotyl, six spectra were collected in the middle part, avoiding the central cylinder, for at least five independent hypocotyls per condition. Baseline correction and data normalization were made for the absorbances between 1810 and 830 cm−1 (corresponding to the cell wall fingerprint, see Figure S1). Pairwise comparison between high and low R:FR was made after 1 and 3 days of treatments and significant differences were identified using Student's t‐test for each wavelength. (b) All Student's t‐values were plotted against wavelengths with horizontal lines referring to the significant threshold for p < .05. Student's t‐values above +2 or below −2 indicate, respectively, an enrichment or an impoverishment of cell wall components in low compared with high R:FR. (c) Student's t‐values for wavelengths assigned to cell wall components were used to build the heatmap with negative and positive t‐values, respectively, represented by a range of colors from blue to orange.
FIGURE 3
FIGURE 3
Low R:FR triggers changes in the expression of cell wall‐related genes. (a) Number of cell wall‐related genes identified as expressed in seedling and regulated by low R:FR in hypocotyl, cotyledon or both. From cell wall‐selected genes and RNA sequencing data (Kohnen et al., 2016), Venn diagrams highlight cell wall‐related genes expressed in seedling and that are regulated by low R:FR in hypocotyl, cotyledon or both. For each, a number of up and down‐regulated genes are shown along the kinetic of low R:FR treatment. Percentages of the low R:FR‐regulated genes were determined according to the total of cell wall‐related genes expressed in seedling. (b) Number of cell wall‐related genes expressed in seedling and regulated by low R:FR classified according to their putative function in cell wall synthesis, remodeling, and signaling as well as their related networks for synthesis and remodeling. Percentages were determined according to the total of cell wall‐related genes classified for each condition (values between brackets). CW, cell wall; Network 1, cellulose and hemicelluloses; Network 2, pectins; Network 3, structural proteins.
FIGURE 4
FIGURE 4
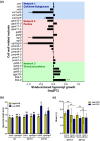
Analysis of mutants impaired in cell wall metabolism reveals the importance of CGR2 and CGR3 in the regulation of the hypocotyl growth and the elastic properties under low R:FR. (a) Length of the hypocotyls in response to low R:FR treatment. Seedlings were grown for 4 days in high R:FR and then for three additional days in low R:FR. Data of growth induced by low R:FR during the 3 days were normalized against the wild type and expressed in log2FC. Significant differences (p < .05*, p < .001***) were determined according to Student's t‐test. (b) Length of the hypocotyls in response to high and low R:FR treatments in Col‐0 and cgr2cgr3. Seedlings were grown for 4 days in high R:FR before being transferred under low R:FR (blue bars) or kept in high R:FR (yellow bars) for three additional days. The bars show means in mm ± confidence intervals measured at 4 (4 days), 5 (4 days + 1 day), and 7 (4 days + 3 days) days. Significant differences (indicated with letters) were determined according to one‐way ANOVA followed by multiple comparisons with Tukey's test. (c) Elastic properties of hypocotyl assessed under high and low R:FR treatment for Col‐0 and cgr2cgr3. Hypocotyls were frozen and thawed then subjected to cyclic loading at 5 mN of force and the strain compared with the data obtained for the wild‐type seedlings in Figure 2. The average magnitude of strain incurred by seedlings grown in a high R:FR or low R:FR light regime after 1 (4 days + 1 day) and 3 days (4 days + 3 days) is shown. The bars show means in % ± SD (n > 10 independent seedlings for Col‐0 and n > 5 independent seedlings for cgr2cgr3, at least five oscillations were made per seedling). Pairwise comparisons were made between the mutant and the wild‐type using Welch t‐test brackets indicated statistical tests that were made with significance p < .1*, p < .05**, and p < .01***.
FIGURE 5
FIGURE 5
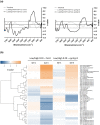
Changes of cell wall properties that occur in response to low R:FR are reduced in cgr2cgr3. (a, b) Cell wall properties in the middle part of the hypocotyl under high and low R:FR treatments for Col‐0 and cgr2cgr3. Cell wall chemical bounds were analyzed by Fourier‐transform infrared (FTIR) microspectroscopy. For each hypocotyl, six spectra were collected in the middle part, avoiding the central cylinder, for at least five independent hypocotyls per condition. Baseline correction and data normalization were made for the absorbances between 1810 and 830 cm−1 (corresponding to the cell wall fingerprint, see Figure S6). Pairwise comparison between high and low R:FR was made after 1 and 3 days of treatments for Col‐0 and cgr2cgr3 and significant differences were identified using Student's t‐test for each wavelength. (a) All Student's t‐values were plotted against wavelengths with horizontal lines referring to the significant threshold for p < .05 for Col‐0 (left panel) and cgr2cgr3 (right panel). Student's t‐values above +2 or below −2 indicate, respectively, an enrichment or an impoverishment of cell wall components in low compared with high R:FR. (b) Student's t‐values for wavelengths assigned to cell wall components were used to build the heatmap with negative and positive t‐values, respectively, represented by a range of colors from blue to orange.

Similar articles

References

    1. Alonso‐simón, A. , García‐angulo, P. , Mélida, H. , Encina, A. , Álvarez, J. M. , & Acebes, J. L. (2011). The use of FTIR spectroscopy to monitor modifications in plant cell wall architecture caused by cellulose biosynthesis inhibitors. Plant Signaling & Behavior, 6, 1104–1110. 10.4161/psb.6.8.15793 - DOI - PMC - PubMed
    1. Atmodjo, M. A. , Hao, Z. , & Mohnen, D. (2013). Evolving views of pectin biosynthesis. Annual Review of Plant Biology, 64, 747–779. 10.1146/annurev-arplant-042811-105534 - DOI - PubMed
    1. Ballaré, C. L. , & Pierik, R. (2017). The shade‐avoidance syndrome: Multiple signals and ecological consequences. Plant, Cell & Environment, 40, 2530–2543. 10.1111/pce.12914 - DOI - PubMed
    1. Bashline, L. , Lei, L. , Li, S. , & Gu, Y. (2014). Cell wall, cytoskeleton, and cell expansion in higher plants. Molecular Plant, 7, 586–600. 10.1093/mp/ssu018 - DOI - PubMed
    1. Bouton, S. (2002). QUASIMODO1 encodes a putative membrane‐bound glycosyltransferase required for normal pectin synthesis and cell adhesion in Arabidopsis. Plant Cell Online, 14, 2577–2590. 10.1105/tpc.004259 - DOI - PMC - PubMed