. 2023 Nov;2(11):1015-1031.
doi: 10.1038/s44161-023-00354-3. Epub 2023 Oct 30.

Trem2 promotes foamy macrophage lipid uptake and survival in atherosclerosis

Affiliations

Trem2 promotes foamy macrophage lipid uptake and survival in atherosclerosis

Michael T Patterson et al. Nat Cardiovasc Res. 2023 Nov.

Abstract

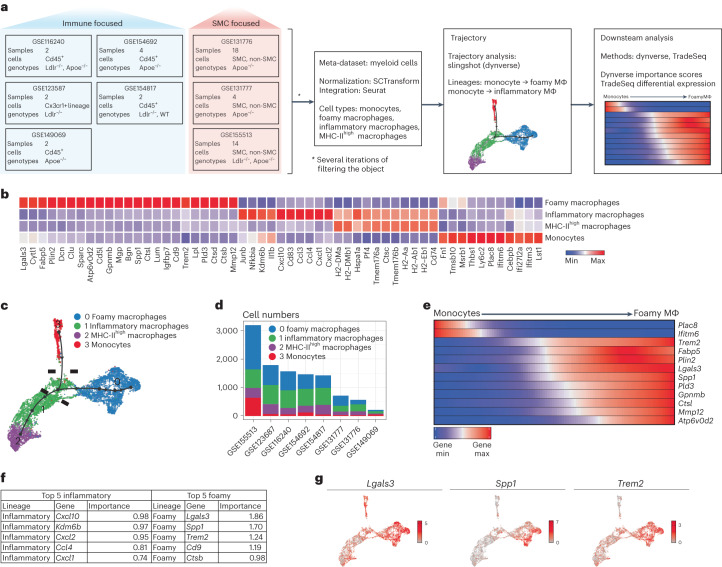
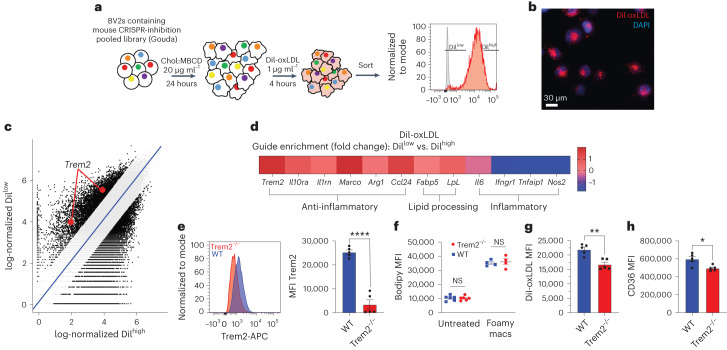
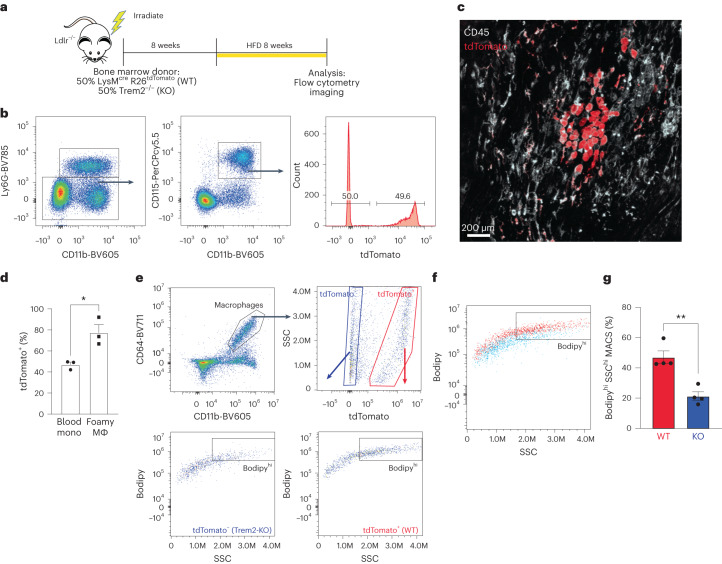
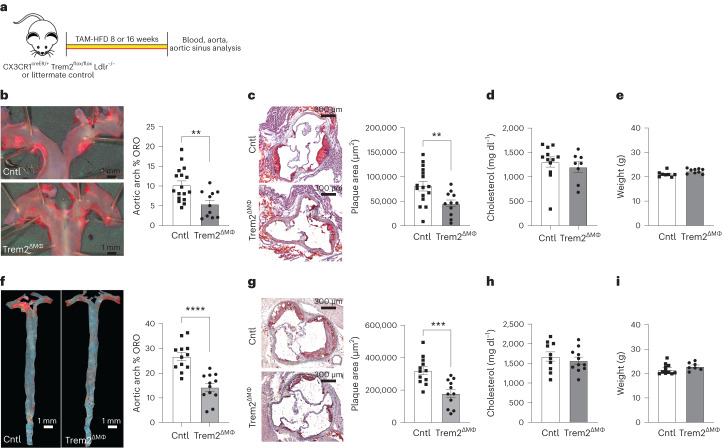
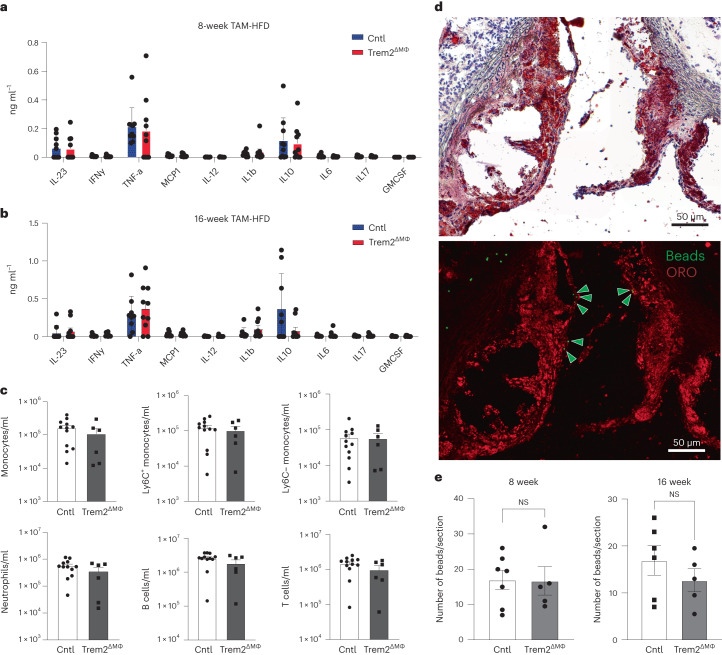
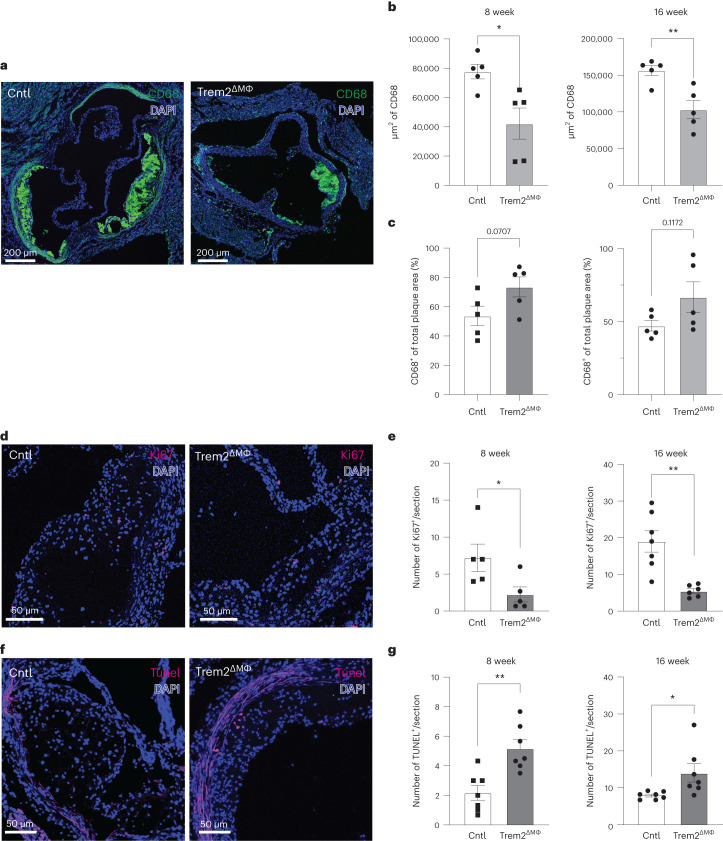
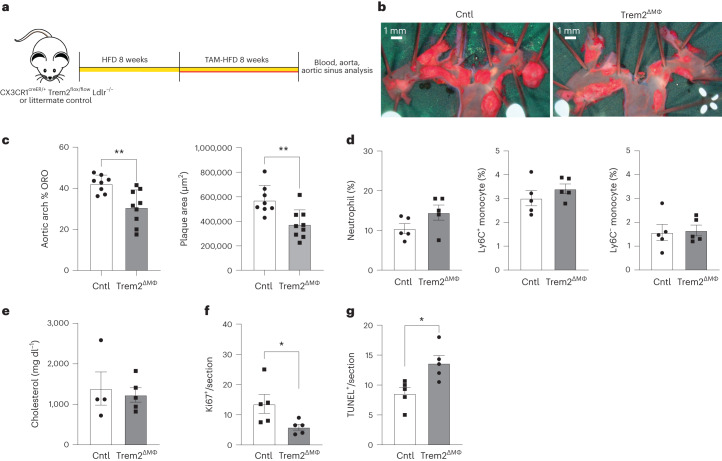
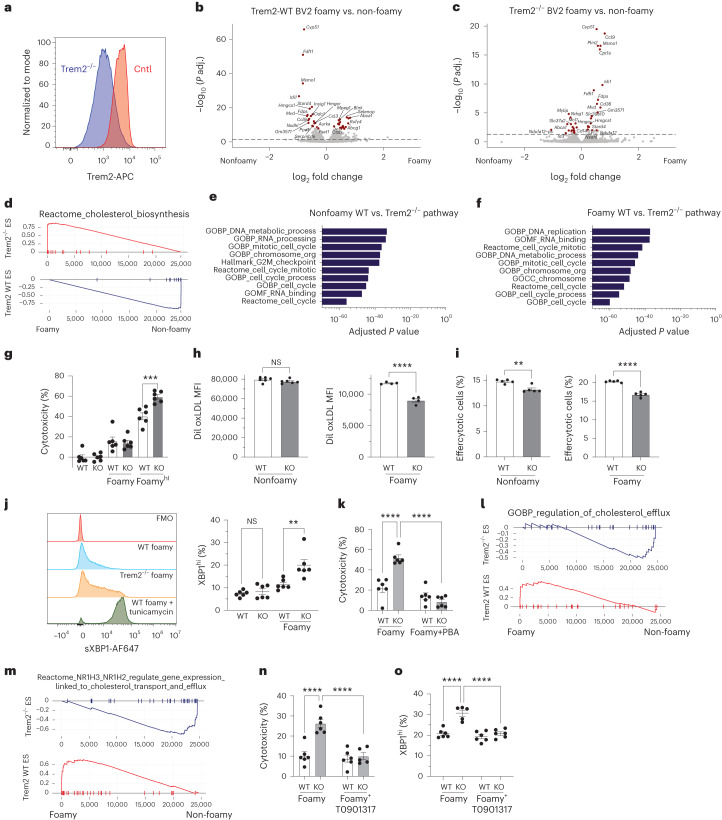
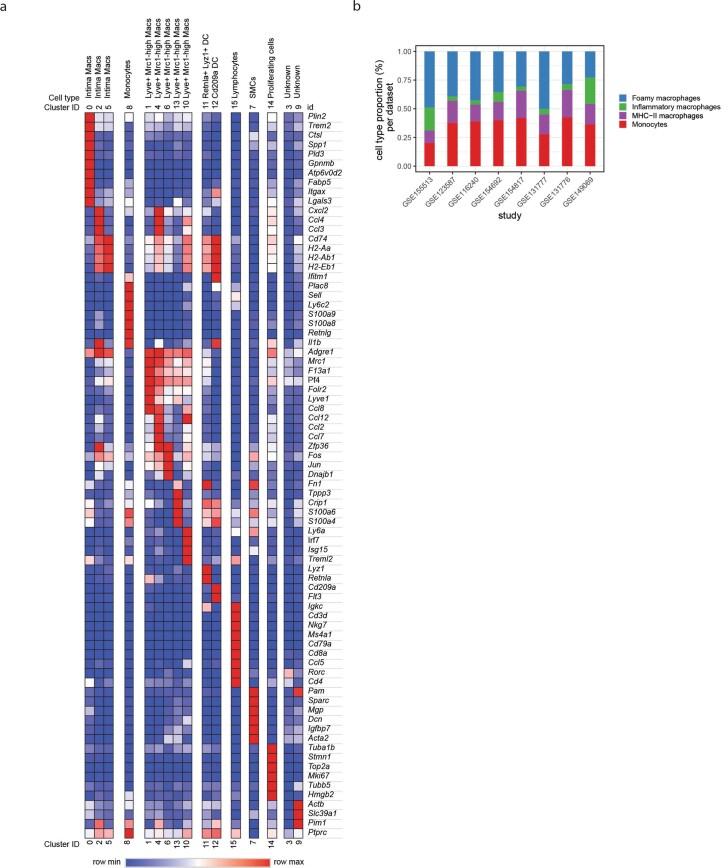
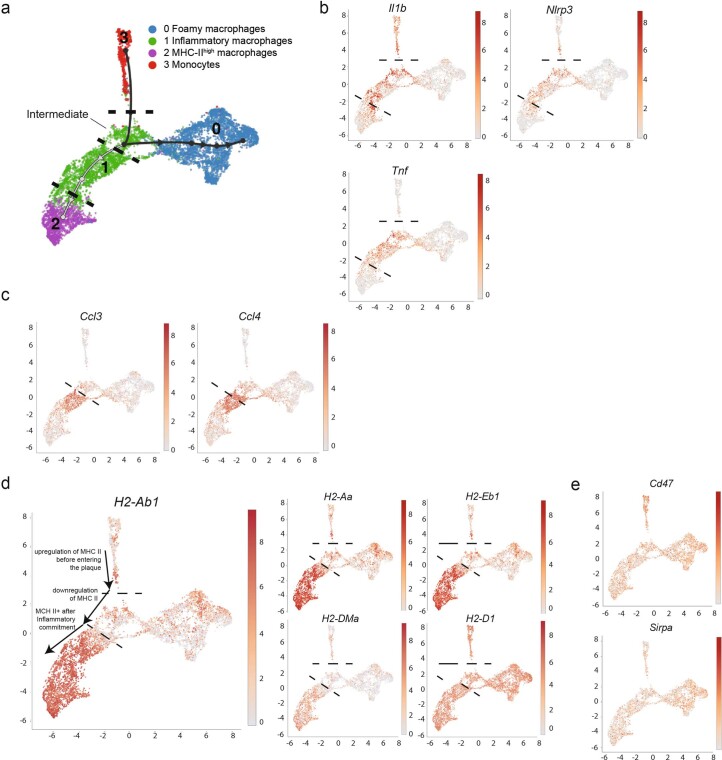
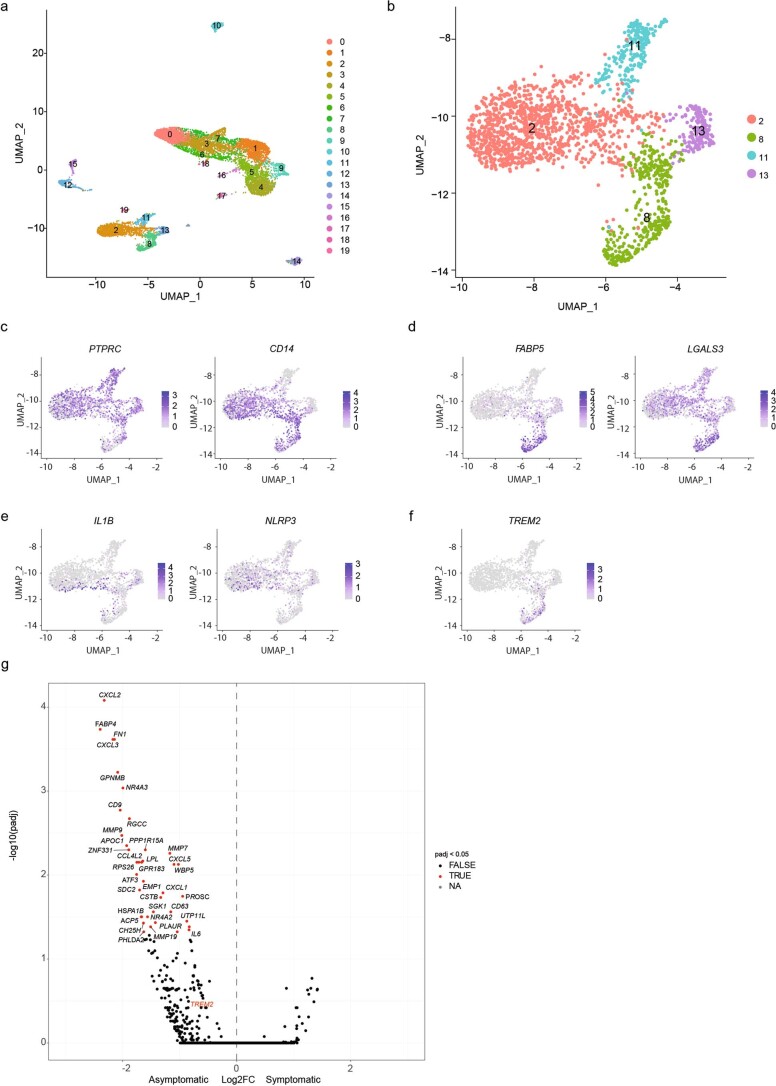
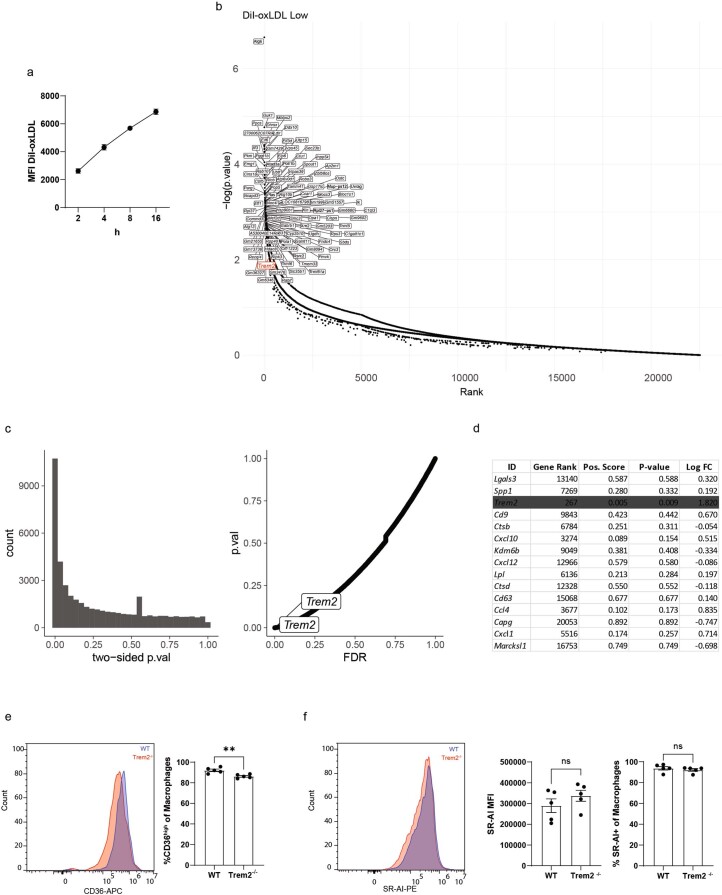
Atherosclerosis is driven by the expansion of cholesterol-loaded 'foamy' macrophages in the arterial intima. Factors regulating foamy macrophage differentiation and survival in plaque remain poorly understood. Here we show, using trajectory analysis of integrated single-cell RNA sequencing data and a genome-wide CRISPR screen, that triggering receptor expressed on myeloid cells 2 (Trem2) is associated with foamy macrophage specification. Loss of Trem2 led to a reduced ability of foamy macrophages to take up oxidized low-density lipoprotein (oxLDL). Myeloid-specific deletion of Trem2 showed an attenuation of plaque progression, even when targeted in established atherosclerotic lesions, and was independent of changes in circulating cytokines, monocyte recruitment or cholesterol levels. Mechanistically, we link Trem2-deficient macrophages with a failure to upregulate cholesterol efflux molecules, resulting in impaired proliferation and survival. Overall, we identify Trem2 as a regulator of foamy macrophage differentiation and atherosclerotic plaque growth and as a putative therapeutic target for atherosclerosis.


Conflict of interest statement

Competing interests The authors declare no competing interests.

Figures

Fig. 1
Fig. 1. Meta-scRNA-seq trajectory analysis identifies genes associated with foamy macrophage differentiation in atherosclerotic plaques.
a, scRNA-seq datasets from atherosclerosis studies were integrated into a single meta-dataset. Based on cluster gene enrichment signatures, cells were filtered to isolate intima-associated monocyte and macrophage clusters. Cells were examined for trajectory analysis and differential gene expression. b, Four main clusters of intima-associated monocytes/macrophages were identified and annotated based on enriched gene signatures. Top differentially expressed genes are displayed in association with the different clusters. c, Trajectory analysis was performed to determine the potential differentiation pathways used by foamy or inflammatory clusters. Data emphasize a monocyte origin and bifurcation toward terminal macrophage differentiation endpoints, with intermediate transition state marked with hash marks. d, Monocyte and macrophage cluster representation from original studies is displayed, emphasizing the presence of all clusters from each independent study. e, Pseudotime trajectory was plotted between monocyte (cluster 3, origin) and foamy macrophages (cluster 0, endpoint). Genes associated with monocyte lineage, including Plac8 and Ifitm6, were rapidly lost, and genes associated with foamy macrophage specification were enriched across pseudotime. f, Trade-seq analysis algorithm predicted genes most likely associated with lineage commitment, called importance index. Top predicted genes for inflammatory and foamy differentiation are outlined in the table. g, The top three genes associated with foamy cell ‘importance index’ were plotted on a tSNE project map for gene expression profile. SMC, smooth muscle cell.
Fig. 2
Fig. 2. Genome-wide CRISPR screen identifies Trem2 as a candidate regulator for foamy macrophage formation.
a, Schematic for CRISPR knockout screening approach for oxLDL uptake. BV2 macrophages were loaded with CRISPR pooled guide library (Gouda). Cells were made foamy by overnight treatment with soluble cholesterol and then challenged for 4 h with DiI-oxLDL and sorted for DiIhigh and DiIlow cells. Guides were sequenced from sorted populations. b, Confocal micrograph showing BV2 DiI uptake after 4-h incubation with DiI-oxLDL. Representative of two independent experiments. c, CRISPR guide enrichment comparing log-normalized enrichment in DiIhigh (x axis) versus DiIlow (y axis). Gray error bands delineate guides with log fold change < 1. d, Selected gene enrichments comparing DiIlow versus DiIhigh. e, Peritoneal macrophages were isolated from WT or Trem2−/− mice and treated with soluble cholesterol to induce foamy cell formation. After overnight culture, cells were analyzed for Trem2 expression by flow cytometry (n = 5 biologically independent replicates per group). Data are mean ± s.e.m. Student’s t-test, ****P < 0.0001. f, Bodipy staining for total neutral lipid accumulation was performed by flow cytometry on peritoneal macrophages from WT or Trem2−/− mice, cultured overnight in media alone or in media with soluble cholesterol (n = 6 biologically independent replicates for untreated and n = 4 biologically independent replicates for foamy). Data are mean ± s.e.m. Student’s t-test. g, Peritoneal macrophages were isolated from WT or Trem2−/− mice and treated with soluble cholesterol to induce foamy cell formation. After overnight culture, cells were treated with DiI-oxLDL for 4 h and assessed for uptake by flow cytometry (n = 5 biological replicates per group). Data are mean ± s.e.m. Student’s t-test, **P < 0.01. h, CD36 expression from peritoneal macrophages isolated from WT or Trem2−/− mice and treated with soluble cholesterol overnight to induce foamy cell formation (n = 5 biological replicates per group). Data are mean ± s.e.m. Student’s t-test, *P < 0.05. NS, not significant. Source data
Fig. 3
Fig. 3. Trem2-deficient macrophages are outcompeted by WT macrophages to form foamy cells in atherosclerotic plaque.
a, Schematic for mixed bone marrow chimera experiment. Ldlr−/− mice were lethally irradiated and rescued by donor bone marrow from (50%) LysMcre R26tdTomato (WT) and (50%) Trem2−/− mice. Recipient mice were rested for 8 weeks and then fed an HFD for an additional 8 weeks to induce atherosclerosis. b, Flow cytometry gating of blood immune cells (CD45+) after 8-week HFD feeding, showing ratio of monocytes derived from WT (tdTomato+) and Trem2−/− progenitors. c, Confocal micrograph of whole-mount aorta showing tdTomato labeling (red) and CD45 (white) staining to define cellular contributions to foamy macrophages. Representative image from two independent experiments. d, Quantification of tdTomato+ cells in blood compared to foamy macrophages from whole-mount aorta images (n = 3 mice per group). Data are mean ± s.e.m. Student’s t-test, *P < 0.05. e, Foamy FACS was performed on CD64+CD11b+ macrophages isolated from mixed bone marrow chimera aorta. Macrophages were separated into tdTomato+ and tdTomato populations and then assessed for foamy representation by SSC and Bodipy (neutral lipid) staining. f, Flow cytometric overlap between tdTomato+ (red) and Trem2−/− (blue) derived macrophages from digested atherosclerotic aorta. g, Quantification derived from flow cytometric foamy FACS comparing relative contribution to foamy macrophages (n = 4 mice per group). Data are mean ± s.e.m. Student’s t-test, **P < 0.01. KO, knockout. MACS, macrophage. Source data
Fig. 4
Fig. 4. Conditional deletion of Trem2 on macrophages attenuates atherosclerotic plaque progression.
a, CX3CR1creERTrem2flox/floxLdlr−/− (Trem2ΔMФ) or littermate control mice (which included Cre animals CX3CR1+/+Trem2fl/flLdlr−/− and Cre+ animals CX3CR1creER/+Trem2fl/+Ldlr−/−) were fed TAM-HFD for 8 weeks (be) or 16 weeks (fi). b, After 8 weeks of TAM-HFD, aortas were analyzed by en face analysis for percentage Oil Red O (ORO) staining on the arch (n = 17 mice per group for Cntl and n = 12 for Trem2ΔMФ). Data are mean ± s.e.m. Student’s t-test, **P < 0.01. c, Aortic sinus plaque area measured after ORO staining in 8-week TAM-HFD samples (n = 17 mice per group for Cntl and n = 12 for Trem2ΔMФ). Data are mean ± s.e.m. Student’s t-test, **P < 0.01. d, Serum cholesterol levels from 8-week TAM-HFD-fed mice (n = 11 mice per group for Cntl and n = 8 for Trem2ΔMФ). Data are mean ± s.e.m. e, Weight data from 8-week TAM-HFD-fed mice (n = 9 mice pergroup). Data are mean ± s.e.m. f, En face ORO staining of aorta after 16-week TAM-HFD feeding (n = 12 mice per group). Data are mean ± s.e.m. Student’s t-test, ****P < 0.0001. g, Aortic sinus plaque area after 16-week TAM-HFD feeding (n = 11 mice per group for Cntl and n = 12 for Trem2ΔMФ). Data are mean ± s.e.m. Student’s t-test, ***P < 0.001. h, Serum cholesterol after 16-week TAM-HFD feeding (n = 10 mice per group). Data are mean ± s.e.m. i, Weight of mice after 16-week TAM-HFD feeding (n = 10 mice per group for Cntl and n = 7 for Trem2ΔMФ). Data are mean ± s.e.m. Source data
Fig. 5
Fig. 5. Conditional deletion of Trem2 has no effect on monocyte recruitment or systemic inflammation.
a, Following the schematic in Fig. 4a, CX3CR1creERTrem2flox/floxLdlr−/− (Trem2ΔMФ) or littermate control mice were treated continuously with TAM-HFD for the indicated times. b, Serum from 8-week TAM-HFD-fed mice were assessed for cytokine levels by multiplex assay (n = 10 mice per group). Data are mean ± s.e.m. c, Serum from 16-week TAM-HFD-fed mice were assessed for cytokine levels by multiplex assay (n = 9 mice per group). Data are mean ± s.e.m. d, Blood immune cells were assessed after 16 weeks of TAM-HFD by flow cytometry (n = 12 mice per group for Cntl and n = 6 for Trem2ΔMФ). Data are mean ± s.e.m. e, Monocyte recruitment was assessed by bead labeling and recruitment experiment—images from representative histologic and immunofluorescence images with lipid content (red) and beads (green). Representative image from two independent experiments. f, Quantification of plaque-associated beads that were counted per section for 8-week or 16-week TAM-HFD experiments from experiments in Fig. 4 (n = 7 mice per group for Cntl and n = 5 for Trem2ΔMФ). Data are mean ± s.e.m. Student’s t-test. NS, not significant; ORO, Oil Red O. Source data
Fig. 6
Fig. 6. Trem2 regulates foamy macrophage survival and proliferation in atherosclerotic lesions.
a, Confocal micrograph showing CD68 staining (green) and DAPI (blue) for macrophage area in Cntl or Trem2-deficent mice after 16-week TAM-HFD feeding. Representative image from two independent experiments. b, Quantification of CD68+ macrophage area per section in 8-week or 16-week TAM-HFD samples (n = 5 mice per group). Data are mean ± s.e.m. Student’s t-test, *P < 0.05 and **P < 0.01. c, Quantification of the percentage of plaque that is macrophages (CD68+) in 8-week or 16-week TAM-HFD samples (n = 5 mice per group). Data are mean ± s.e.m. Student’s t-test. d, Confocal micrograph showing Ki67 staining (magenta) and CD68 staining (green) for proliferation in Cntl or Trem2-deficient mice after 16-week TAM-HFD feeding. Representative image from two independent experiments. e, Quantification of Ki67+ macrophages (CD68+) per section in 8-week or 16-week TAM-HFD samples (n = 5 mice per group for 8-week TAM-HFD, n = 7 mice per group for Cntl 16-week TAM-HFD and n = 6 mice per group for 16-week TAM-HFD Trem2ΔMФ). Data are mean ± s.e.m. Student’s t-test, *P < 0.05 and **P < 0.01. f, Confocal micrograph of TUNEL staining (magenta) and CD68 staining (green) for detection of dying cells within atherosclerotic lesions after 16-week TAM-HFD feeding. Representative image from two independent experiments. g, Quantification of TUNEL+ macrophages (CD68+) per section in 8-week or 16-week TAM-HFD samples (n = 6 mice per group for Cntl 8-week TAM-HFD, n = 7 mice per group for Trem2ΔMФ 8-week TAM-HFD, n = 7 mice per group for Cntl 16-week TAM-HFD and n = 7 mice per group for Trem2ΔMФ 16-week TAM-HFD). Data are mean ± s.e.m. Student’s t-test, *P < 0.05 and **P < 0.01. Source data
Fig. 7
Fig. 7. Deletion of Trem2 in established atherosclerotic lesions leads to enhanced foamy macrophage death and reduced atherosclerotic plaque size.
a, Schematic for intervention study where mice were fed an HFD for 8 weeks and then switched to TAM/HFD for an additional 8 weeks before being killed. b, En face aorta analysis of plaque area after 16 weeks of diet-switch intervention study. Representative image from two independent experiments. c, Quantification of plaque area in aorta and aortic sinus (n = 8 mice per group for Cntl and n = 9 for Trem2ΔMФ). Data are mean ± s.e.m. Student’s t-test, **P < 0.01. d, Blood immune population analysis after 16-week diet-switch intervention model (n = 5 mice per group). Data are mean ± s.e.m. e, Total serum cholesterol levels after 16-week diet-switch model (n = 4 mice per group for Cntl and n = 5 for Trem2ΔMФ). Data are mean ± s.e.m. f, Quantification of plaque macrophage proliferation analysis by Ki67+ macrophages (CD68+) (n = 5 mice per group). Data are mean ± s.e.m. Student’s t-test, *P < 0.05. g, Quantification of TUNEL+ macrophages (CD68+) in plaques after 16-week diet-switch model (n = 5 mice per group). Data are mean ± s.e.m. Student’s t-test, *P < 0.05. ORO, Oil Red O. Source data
Fig. 8
Fig. 8. Trem2-deficient foamy macrophages are susceptible to cell death and enhanced ER stress response through dysfunctional LXR signaling.
a, WT and Trem2−/− BV2s assessed for Trem2 expression by flow cytometry. WT (b) or Trem2−/− (c) BV2 macrophages DEGs from bulk RNA-seq determined by Wald test with DESeq2. d, GSEA plot of cholesterol biosynthesis pathways. ES, enrichment score. e, Pathway analysis of RNA-seq data comparing WT and Trem2−/− non-foamy BV2 cells. f, Pathway analysis of RNA-seq data comparing WT and Trem2−/− foamy BV2 cells. e,f, Significant pathways determined using weighted Kolmogorov–Smirnov test. g, WT or Trem2−/− cell supernatant assessed for cytotoxicity by LDH assay after 16 h (n = 6 biological replicates per group). Foamy: 20 µg ml−1 cholesterol; foamyhi: 80 µg ml−1 cholesterol. Data are mean ± s.e.m. Two-tailed ANOVA, ***P < 0.001. h, DiI-oxLDL uptake for WT or Trem2−/− non-foamy and foamy BV2 macrophages (n = 6 for non-foamy WT and Trem2−/− and n = 4 foamy WT and Trem2−/− biological replicates). Data are mean ± s.e.m. Student’s t-test, ***P < 0.001. i, WT or Trem2−/− non-foamy and foamy BV2 macrophage efferocytosis. Efferocytotic cells were determined by the percent of BV2s that were positive for CTV-labeled splenocytes (n = 5 biological replicates per group). Data are mean ± s.e.m. Student’s t-test, **P < 0.01 and ****P < 0.0001. j, WT or Trem2−/− non-foamy and foamy BV2 macrophage sXBP1 expression. Tunicamycin was used as a positive control (n = 6 biological replicates per group). FMO (fluorescence minus one) shows unstained control. Data are mean ± s.e.m. Two-tailed ANOVA, **P < 0.01. k, WT or Trem2−/− foamy BV2 macrophages (80 µg ml−1 cholesterol) plus 10 µM PBA. Cell supernatant was assessed for cytotoxicity by LDH assay after 16 h (n = 6 biological replicates per group). Data are mean ± s.e.m. Two-tailed ANOVA, ****P < 0.0001. l, GSEA plot of cholesterol efflux pathways from RNA-seq. m, GSEA plot of NR1H2 and NR1H3 gene target pathways from RNA-seq. n, WT or Trem2−/− foamy BV2 macrophages (80 µg ml−1 cholesterol) ± T0901317 percent cytotoxicity (n = 5 biological replicates per group). Data are mean ± s.e.m. Two-tailed ANOVA, ****P < 0.0001. o, WT or Trem2−/− foamy BV2 macrophages (80 µg ml−1 cholesterol) ± 10 µM T0901317, assessed for sXBP1 levels by flow cytometry. Tunicamycin was used as a positive control (n = 5 biological replicates per group). Data are mean ± s.e.m. Two-tailed ANOVA, ****P < 0.0001. KO, knockout; NS, not significant. Source data
Extended Data Fig. 1
Extended Data Fig. 1. Integrated scRNA-seq differential gene expression.
a) Heat map of cell clusters identified in META-scRNA-seq dataset, and top enriched genes for each cluster. b) Cell type proportion per each dataset from META-scRNA-seq dataset.
Extended Data Fig. 2
Extended Data Fig. 2. Trajectory analysis of META-scRNA-seq dataset.
a) Trajectory analysis revealed stages of differentiation following monocyte entry associated with inflammatory macrophage clusters. b) Upregulation of inflammation genes associated with entry into intima and commitment toward inflammatory macrophage differentiation. c) Ccl3 and Ccl4 were uniquely expressed by committed inflammatory cells, but not by intermediate inflammatory cells. d) MHC-II expression is gradually elevated along commitment toward inflammatory differentiation arm of the trajectory map. e) Cd47 and Sirpa expression on trajectory map.
Extended Data Fig. 3
Extended Data Fig. 3. Human atherosclerotic endarterectomy scRNA-seq.
a) Clustering of all cell subsets from human atherosclerotic endarterectomy samples (Fernandez et. al., Nat Med 2019). b) Clustering of monocyte/macrophage populations from human atherosclerotic endarterectomy samples (Fernandez et. al., Nat Med 2019). c) PTPRC and CD14 expression of clustered monocyte/macrophage populations from 3b. d) Foamy macrophage gene (FABP5, LGALS3) expression of clustered monocyte/macrophage populations from 3b. e) Inflammatory macrophage gene (IL1B, NLRP3) expression of clustered monocyte/macrophage populations from 3b. f) TREM2 expression of clustered monocyte/macrophage populations from 3b. g) Volcano plot of enrichment of genes from samples from either asymptomatic or symptomatic patients. TREM2 in red. DEGs were determined by Wald test with DESeq2.
Extended Data Fig. 4
Extended Data Fig. 4. CRISPR screen of foamy macrophage oxLDL uptake and scavenger receptor expression.
a) Time course analysis of DiI-oxLDL uptake in WT BV2 cells differentiated in media with 20 µg/mL of soluble cholesterol overnight prior to addition of DiI-oxLDL (n = 5 biological replicates/group). Data are mean ± S.E.M. b) CRISPR guide enrichment by rank-order was plotted against P-value for DiI-oxLDL-low compared against DiI-oxLDL-high to identify top enriched guides. Trem2 in red. P-values calculated using the negative-binomial model from MAGeCK package and adjusted using Benjamini-Hochberg procedure. c) Two sided P-value vs count and p value vs false discovery rate (FDR) for DiI-oxLDL-low compared against DiI-oxLDL-high to identify top enriched guides. p-values and FDR calculated using the negative-binomial model from MAGeCK package and adjusted using Benjamini-Hochberg procedure. d) Top 15 ‘importance index’ genes associated with foamy cell commitment by Trade-seq analysis (Fig. 1), were compared for gene rank and enrichment in CRISPR screen. Trem2 highlighted in gray. P-values calculated using the negative-binomial model from MAGeCK package and adjusted using Benjamini-Hochberg procedure. e) CD36 expression (left) and percent CD36 high (right) of foamy peritoneal macrophages cultured with soluble cholesterol overnight from WT (blue) and Trem2-/- mice (red). Gated on F4/80+ CD11b+ live cells (n = 5 biological replicates/group). Data are mean ± S.E.M. Student’s t-test, P = ** < 0.01. f) SR-AI expression (left), MFI (middle) and percent SR-AI positive (right) of foamy peritoneal macrophages cultured with soluble cholesterol overnight from WT (blue) and Trem2-/- mice (red). Gated on F4/80+ CD11b+ live cells (n = 5 biological replicates/group). Data are mean ± S.E.M. Student’s t-test Source data
Extended Data Fig. 5
Extended Data Fig. 5. Trem2 staining of human atherosclerotic plaques.
a) Cranial artery plaques were stained either for CD68 and Trem2 to identify co−expressing foamy macrophages within human plaques (top) or with CD68 and isotype control with secondary antibody (bottom). Representative image from 3 independent samples. b) Carotid artery endarterectomy samples from three patients stained for isotype control or Trem2 using DAB (3,3′-Diaminobenzidine) immunohistochemical staining. Representative images from 6 independent samples.
Extended Data Fig. 6
Extended Data Fig. 6. Trem2 deletion and immune profiling in atherosclerotic mice.
a) Trem2 expression and quantification from atherosclerotic aortae (n = 2 mice/group for Cntl and n = 3 for Trem2ΔMФ). Briefly, Cntl or Trem2ΔMФ mice were fed TAM-HFD for 16 weeks then aorta were harvested, digested and flow cytometry was run. Histogram was gated on live, CD45 + CD11b + CD64+ cells. b) Flow cytometric gating strategy for identifying major blood immune cell populations. c) Blood immune cell profiling by flow cytometry in indicated mice after 16 weeks TAM-HFD feeding (n = 12 mice/group for Cntl and n = 6 for Trem2ΔMФ). Data are mean ± S.E.M. Student’s t-test. d) Classical monocyte bead uptake in the blood was measured by flow cytometry 24 hours after i.v. bead injection in indicated strains after 16 weeks TAM-HFD feeding (n = 7 mice/group for Cntl and n = 5 for Trem2ΔMФ). Data are mean ± S.E.M. Student’s t-test. Source data
Extended Data Fig. 7
Extended Data Fig. 7. Plaque phenotypes of control or Trem2-deficent mice.
a) Aortic arch and sinus plaque quantification from 8-week TAM-HFD fed mice split by sex (n = 11 mice/group Cntl male, n = 5 Trem2ΔMФ male, n = 6 Cntl female, n = 6 Trem2ΔMФ female). Data are mean ± S.E.M. Two−tailed ANOVA, P = * < 0.05. b) Aortic arch and sinus plaque quantification from 16-week TAM-HFD fed mice split by sex (n = 4 mice/group Cntl male, n = 6 Trem2ΔMФ male, n = 8 Cntl female, n = 5 Trem2ΔMФ female). Data are mean ± S.E.M. Two−tailed ANOVA, P = * < 0.05, **<0.01. c) Representative imaging of smooth muscle cells, by SMA staining. d) Quantification of SMA staining percentage of plaque at 8 (left) and 16 weeks (right) of TAM-HFD (n = 4 mice/group). Data are mean ± S.E.M. Student’s t-test. e) Necrotic core quantification from 16 week TAM-HFD fed Cntl or Trem2ΔMФ (n = 11 mice/group for control and n = 9 for Trem2ΔMФ). Data are mean ± S.E.M. Student’s t-test. f) Representative imaging of iNOS+ macrophages (magenta) from Ctrl 16 week TAM-HFD mouse plaque. g) Quantification of the number of iNOS+ macrophages (CD68) from Ctrl and Trem2ΔMФ plaques after 16 week TAM-HFD (n = 5 mice/group). Data are mean ± S.E.M. Student’s t-test. h) Representative Bodipy staining (green) from Ctrl 16 week TAM-HFD mouse plaque. i) Quantification of the mean pixel intensity of Bodipy from Ctrl and Trem2ΔMФ plaques after 16 week TAM-HFD (n = 5 mice/group). Mean pixel intensity was determined via imageJ by outlining the plaque and calculating mean fluorescence intensity. Data are mean ± S.E.M. Student’s t-test. Source data
Extended Data Fig. 8
Extended Data Fig. 8. Bulk RNA-seq and cytokine production analysis of WT or Trem2−/− BV2 cells.
a) Heat map of nonfoamy macrophages comparing top enriched WT and Trem2-/- genes. b) Heat map of foamy macrophages comparing top enriched WT and Trem2-/- genes. c) Normalized enrichment scores for top pathways associated with WT BV2 compared to Trem2-/- BV2 in media alone (nonfoamy) or following foamy differentiation. Significant pathways were determined using Weighted-Kolmogorov-Smirnov (WKS) test. d) Heat map of nonfoamy and foamy macrophages comparing matrix metalloprotease genes from WT and Trem2-/- BV2. e) Cytokine supernatant analysis from cultured WT or Trem2-/- cells cultured with either media alone or media with 20 mg/ml soluble cholesterol overnight (n = 3 biological replicates/group). Data are mean ±S.E.M. Source data
Extended Data Fig. 9
Extended Data Fig. 9. Trem2-/- peritoneal macrophages recapitulate BV2 phenotypes.
a) WT or Trem2-/- peritoneal macrophages were differentiated in media control, media with 20 µg/mL or 80 µg/mL soluble cholesterol to induce foamy macrophage formation. Cell supernatant was assessed for cytotoxicity by LDH assay after 16 hours (n = 5 biological replicates/group). Data are mean ± S.E.M. Two-tailed ANOVA, P = * < 0.05. b) WT or Trem2-/- peritoneal macrophages were differentiated in media control or media with 20 µg/mL soluble cholesterol, then cultured with irradiated, cell trace violet (CTV) labeled splenocytes for 2 hours. Percentage of efferocytotic cells were determined by the % of peritoneal macrophages that were positive for CTV labeled splenocytes (n = 5 biological replicates/group). Data are mean ± S.E.M. Two-tailed ANOVA, P = *** < 0.001, ****<0.0001. c) WT or Trem2-/- peritoneal macrophages were differentiated in media control or media with 20 µg/mL soluble cholesterol, then assessed for activation of ER stress response by sXBP1 levels by flow cytometry. Tunicamycin was used as a positive control (n = 5 biological replicates/group). Data are mean ± S.E.M. Two-tailed ANOVA, P = *** < 0.001. Source data

References

    1. Benjamin EJ, et al. Heart disease and stroke statistics—2019 update: a report from the American Heart Association. Circulation. 2019;139:e56–e66. doi: 10.1161/CIR.0000000000000659. - DOI - PubMed
    1. Williams JW, Huang L-H, Randolph GJ. Cytokine circuits in cardiovascular disease. Immunity. 2019;50:941–954. doi: 10.1016/j.immuni.2019.03.007. - DOI - PMC - PubMed
    1. Glass CK, Witztum JL. Atherosclerosis: the road ahead. Cell. 2001;104:503–516. doi: 10.1016/S0092-8674(01)00238-0. - DOI - PubMed
    1. Hilgendorf I, Swirski FK, Robbins CS. Monocyte fate in atherosclerosis. Arterioscler. Thromb. Vasc. Biol. 2015;35:272–279. doi: 10.1161/ATVBAHA.114.303565. - DOI - PubMed
    1. Williams JW, et al. Limited proliferation capacity of aortic intima resident macrophages requires monocyte recruitment for atherosclerotic plaque progression. Nat. Immunol. 2020;21:1194–1204. doi: 10.1038/s41590-020-0768-4. - DOI - PMC - PubMed

LinkOut - more resources