. 2024 Apr 8;14(6):2605-2621.
doi: 10.7150/thno.92672. eCollection 2024.

IL4 receptor targeting enables nab-paclitaxel to enhance reprogramming of M2-type macrophages into M1-like phenotype via ROS-HMGB1-TLR4 axis and inhibition of tumor growth and metastasis

Affiliations

IL4 receptor targeting enables nab-paclitaxel to enhance reprogramming of M2-type macrophages into M1-like phenotype via ROS-HMGB1-TLR4 axis and inhibition of tumor growth and metastasis

Sri Murugan Poongkavithai Vadevoo et al. Theranostics. .

Abstract

Rationale: Nab-paclitaxel (Abx) is widely employed in malignant tumor therapy. In tumor cells and pro-tumoral M2-type macrophages, the IL4 receptor (IL4R) is upregulated. This study aimed to elucidate the selective delivery of Abx to M2-type macrophages by targeting IL4R and reprogramming them into an anti-tumoral M1-type. Methods: Abx was conjugated with the IL4R-binding IL4RPep-1 peptide using click chemistry (IL4R-Abx). Cellular internalization, macrophage reprogramming and signal pathways, and tumor growth and metastasis by IL4R-Abx were examined. Results: IL4R-Abx was internalized into M2 macrophages more efficiently compared to the unmodified Abx and control peptide-conjugated Abx (Ctrl-Abx), which was primarily inhibited using an anti-IL4R antibody and a receptor-mediated endocytosis inhibitor compared with a macropinocytosis inhibitor. IL4R-Abx reprogrammed the M2-type macrophages into M1-like phenotype and increased reactive oxygen species (ROS) levels and extracellular release of high mobility group box 1 (HMGB1) in M2 macrophages at higher levels than Abx and Ctrl-Abx. The conditioned medium of IL4R-Abx-treated M2 macrophages skewed M2 macrophages into the M1-like phenotype, in which an anti-HMGB1 antibody and a toll-like receptor 4 (TLR4) inhibitor induced a blockade. IL4R-Abx accumulated at tumors, heightened immune-stimulatory cells while reducing immune-suppressing cells, and hampered tumor growth and metastasis in mice more efficiently than Abx and Ctrl-Abx. Conclusions: These results indicate that IL4R-targeting allows enhancement of M2-macrophage shaping into M1-like phenotype by Abx through the ROS-HMGB1-TLR4 axis, improvement of antitumor immunity, and thereby inhibition of tumor growth and metastasis, presenting a new approach to cancer immunotherapy.

Keywords: IL4 receptor; M2-macrophage; immunotherapy; nab-paclitaxel; reprogramming.


Conflict of interest statement

Competing Interests: The authors have declared that no competing interest exists.

Figures

Figure 1
Figure 1
Preparation and characterization of IL4R-Abx. (A) Synthetic schemes of IL4RPep-1-conjugated Abx (IL4R-Abx). (B) MALDI-TOF-MS spectra of albumin part (64-72 kDa) in Abx (theoretical MWalbumin = 66348 g/mol) and IL4R-Abx. (C) Size distribution of Abx and IL4R-Abx by DLS. (D) TEM image of Abx and IL4R-Abx. Scale bars, 250 nm.
Figure 2
Figure 2
Internalization and cytotoxicity of IL4R-Abx in M2 macrophages. (A) Immunofluorescence analysis of the internalization. M2 macrophages were incubated using 2 μg/mL of fluorescein isothiocyanate (FITC) dye (green)-labeled Abx, Ctrl-Abx, and IL4R-Abx for 2 h with or without pre-treatment with 5-(n-ethyl-n-isopropyl) amiloride (EIPA) (50 μM), chlorpromazine (CPZ) (50 μM), anti-IL4R antibody (100 μM), and IgG (100 μM) for 30 min. Nucleus was stained with 4',6-diamidino-2-phenylindole (DAPI) (blue), and merging of images was performed. Scale bars, 20 μm. (B) Flow cytometry analysis of internalization. M2 macrophages were treated as described in (A), and the mean fluorescence intensity (MFI) was quantified using a flow cytometer. Data are expressed as mean ± standard deviation (SD) in the three separate experiments. P values of Ctrl-Abx and IL4R-Abx compared to Abx in each group are shown on the top of bars. *, P < 0.05; **, P < 0.01; ***, P < 0.001; n.s., not significant through one-way analysis of variance (ANOVA) followed by Tukey's multiple post hoc test. (C) Cytotoxicity assay. M2 macrophages were treated with 5 μg/mL of Abx, Ctrl-Abx, and IL4R-Abx for 24 h with or without pre-treatment with 500 nM of CLI095 for 30 min and subjected to cytotoxicity assays. Data are expressed as mean ± SD in the three separate experiments. P values compared to untreated control in each group are shown on the top of bars. *, P < 0.05; **, P < 0.01; ***, P < 0.001; n.s., not significant by two-way ANOVA followed by Bonferroni multiple post hoc test.
Figure 3
Figure 3
Reprogramming of M2 macrophages into M1-like phenotype by IL4R-Abx. (A-F) M2 macrophages were incubated with 5 μg/mL of Abx, Ctrl-Abx, and IL4R-Abx for 24 h without (-) or with pre-treatment with EIPA (50 μM), CPZ (50 μM), anti-IL4Rα antibody (100 μM), and IgG (100 μM) for 30 min. Relative mRNA levels of il12p40 (A), il6 (B), ifn-γ (C), fizz1 (D), tgf-β (E), and il10 (F) were analyzed using quantitative reverse transcription-polymerase chain reaction (qRT-PCR) using a real time cycler. (G, I) ELISA of the concentrations of IL12p70 (G) and TGF-β (I) secreted into the culture medium. (H, J) Flow cytometry analysis of CD86 (H) and CD206 (J) expression. Data are expressed as mean ± SD in the three separate experiments. P values compared to untreated M2-macrophage control (M2, black bar) are shown on the top of bars. *, P < 0.05; **, P < 0.01; ***, P < 0.001; n.s., not significant by one-way ANOVA followed by Tukey's multiple post hoc test.
Figure 4
Figure 4
IL4R-Abx reprograms M2 macrophages into M1-like phenotype via increase in ROS. (A) Suggested pathways and inhibitors of IL4R-Abx-induced M2-macrophage reprogramming. (B) ROS analysis. M2 macrophages were incubated with 5 μg/mL of Abx and IL4R-Abx for 2 and 6 h with or without pre-treatment with 50 mM of N-acetyl-l-cysteine (NAC) for 30 min. A fluorescent microscope was used to image the fluorescence of H2DCFDA generated by ROS. (C-H) M2 macrophages were incubated with 5 μg/mL of Abx and IL4R-Abx for 24 h with or without pre-treatment with 50 mM of NAC for 30 min. Relative mRNA levels of M1-macrophage markers, such as il12p40 (C), il-6 (D), and ifn-γ (E), and M2-macrophage markers, such as fizz-1 (F), tgf-β (G), and il-10 (H), were measured via qRT-PCR analysis. (-), untreated M2-macrophage control (black bar).
Figure 5
Figure 5
IL4R-Abx reprograms M2 macrophages into M1-like phenotype via the ROS-HMGB1-TLR4 axis. (A) M2 macrophages were incubated with 5 μg/mL of Abx and IL4R-Abx for 12 and 24 h. Concentrations of HMGB1 released into the conditioned medium were determined by ELISA. (B) M2 macrophages were incubated with 5 μg/mL of Abx and IL4R-Abx for 24 h with or without pre-treatment with 50 mM of NAC for 30 min. The conditioned medium was collected, concentrated, and subjected to western blotting using an anti-HMGB1 antibody. HMGB1 protein band intensity was quantified using Image J software. (C) M2 macrophages were incubated with Abx and IL4R-Abx for 24 h with or without pre-treatment with NAC. Cells were incubated with anti-HMGB1 antibody (red). Nucleus was stained with DAPI (blue), and images were merged. Boxes represent the enlarged area. Scale bars, 40 µm. (D-I) M2 macrophages were incubated using Abx or IL4R-Abx for 12 h with or without pre-treatment of anti-HMGB1 antibody (10 μg/mL, CM+αHMGB1) and CLI095 (500 nM, CM+CLI095) for 30 min. The CM of M2 macrophages was collected and treated to other sets of M2 macrophages for 24 h. Relative mRNA levels of M1-macrophage markers, such as il12p40 (D), il-6 (E), and ifn-γ (F), and M2-macrophage markers, such as fizz-1 (G), tgf-β (H), and il-10 (I), were measured via qRT-PCR analysis. Data are expressed as mean ± SD in the three separate experiments. *, P < 0.05; **, P < 0.01; ***, P < 0.001; n.s., not significant by one-way ANOVA followed by Tukey's multiple post hoc test. (-), untreated M2-macrophage control (black bar).
Figure 6
Figure 6
Tumor homing of IL4R-Abx in mice bearing 4T1 breast tumor and K-rasLA2 lung tumor. (A) Whole-body fluorescence imaging of mice bearing 4T1 tumor at 6 h after injection of near-infrared fluorescence dye-labeled Ctrl-Abx and IL4R-Abx (5 mg/kg body weight). Circles in cyan blue represent the region of interest (tumor site). (B, C) Ex vivo imaging of tumor and organs isolated after whole-body imaging (B) and total flux quantification (photon/s) of each organ (C). T, tumor; H, heart; L, lung; Li, liver; S, spleen; K, kidney. (D) Histochemical analysis. Tumor tissues isolated at 6 h after injection of FITC dye (green)-labeled Ctrl-Abx and IL4R-Abx underwent frozen section. Tissues were incubated using an anti-IL4R antibody or IgG (red) and with DAPI for nucleus staining (blue), and images were merged. Scale bars, 20 μm. (E) Amount of paclitaxel (ng/g tissue) in tumor and control organs were determined at 6 h after Abx, Ctrl-Abx, and IL4R-Abx injection (5 mg/kg body weight) in mice bearing 4T1 tumor. (F, G) Ex vivo imaging of tumor and organs isolated at 6 h after Ctrl-Abx and IL4R-Abx injection (5 mg/kg body weight) into K-rasLA2 mutant and wild-type (WT) littermate mice (F) and quantification of the total flux (photon/sec) of each organ (G). H, heart; L, lung; Li, liver; S, spleen; K, kidney. Circles (cyan blue) reflect tumor nodules in the lungs. (H) Histochemical analysis. Tumor tissues isolated at 6 h after injection of FITC dye (green)-labeled Ctrl-Abx and IL4R-Abx into K-rasLA2 mutant and WT littermate mice and then were subjected to frozen section. An anti-IL4R antibody (red) was used for tissue staining, with DAPI for nucleus staining (blue), and images were merged. Scale bars, 20 μm. Data are expressed as mean ± SD *, P < 0.05; ***, P < 0.001; n.s., not significant by two-way ANOVA followed by Bonferroni post hoc test (n = 3 per group).
Figure 7
Figure 7
Inhibition of tumor growth and metastasis and improvement of antitumor immunity by IL4R-Abx in mice bearing 4T1 breast tumor. (A-D) Mice bearing 4T1 tumor were injected with Abx, Ctrl-Abx, and IL4R-Abx (5 or 10 mg/kg body weight, weekly for 4 weeks). The tumor volume (A), tumor weight (B), spleen weight (C), and number of metastatic nodules in the lungs (D) after treatments were measured. (E-L) At the culmination of the treatments, tumor and spleen were isolated for immune cell analysis using flow cytometry. The population of CD45+F4/80+Ly6C-MHC II+ M1 macrophages (E), CD45+F4/80+Ly6C-MHC IIformula imageM2 macrophages (F), CD8/Treg ratio (G), and CD45+F4/80-Ly6C+CD11b+ MDSCs (H) in 0.1 g of tumor tissues and the population of M1 macrophages (I), M2 macrophages (J), CD8/Treg ratio (K), and MDSCs (L) in 105 cells of spleen were determined. Data are expressed as mean ± SD. P values compared to saline-treated group are shown on the top of bars. *, P < 0.05; **, P < 0.01; ***, P < 0.001; n.s., not significant by one-way ANOVA followed by Tukey's multiple post hoc test. (A, n = 10 per group; B-D, n = 6 per group; E-L, n = 4 per group).
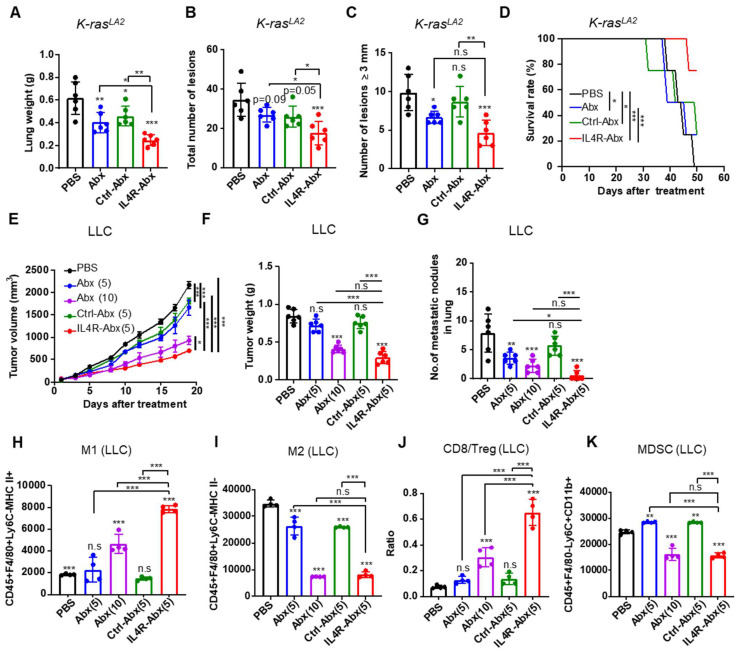
Figure 8
Figure 8
Therapeutic efficacy of IL4R-Abx in K-rasLA2 mutant and LLC lung tumor-bearing mice. (A-D) K-rasLA2 mutant mice bearing spontaneous lung tumors were intravenously injected with Abx, Ctrl-Abx, and IL4R-Abx (5 mg/kg body weight, weekly for 4 weeks). The lung weight (A), the total number of tumor lesions in the lungs (B), the number of tumor lesions above 3 mm in diameter (C), and survival rate (D) at the culmination of the treatments were determined. (E-K) Mice bearing subcutaneous LLC lung tumor were injected intravenously with Abx, Ctrl-Abx, and IL4R-Abx (5 or 10 mg/kg body weight, weekly for 4 weeks). The tumor volume (E), tumor weight (F), and the number of metastatic nodules in the lungs (G) were determined. The population of CD45+F4/80+Ly6C-MHC II+ M1 macrophages (H), CD45+F4/80+Ly6C-MHC II-M2 macrophages (I), CD8/Treg ratio (J), and CD45+F4/80-Ly6C+CD11b+ MDSCs (K) in 0.1 g of tumor tissues were determined via flow cytometry. Data are expressed as mean ± SD. P values compared to the saline-treated group are shown on the top of bars. *, P < 0.05; **, P < 0.01; ***, P < 0.001; n.s., not significant by one-way ANOVA followed by Tukey's multiple post hoc test. (A-D, n = 6 per group; E, n = 10 per group; F-G, n = 6 per group; H-K, n = 4 per group).

References

    1. Qian BZ, Pollard JW. Macrophage diversity enhances tumor progression and metastasis. Cell. 2010;141:39–51. - PMC - PubMed
    1. Mantovani A, Sica A. Macrophages, innate immunity and cancer: balance, tolerance, and diversity. Curr Opin Immunol. 2010;22:231–7. - PubMed
    1. Noy R, Pollard JW. Tumor-associated macrophages: from mechanisms to therapy. Immunity. 2014;41:49–61. - PMC - PubMed
    1. Komohara Y, Jinushi M, Takeya M. Clinical significance of macrophage heterogeneity in human malignant tumors. Cancer Sci. 2014;105:1–8. - PMC - PubMed
    1. Aapro MS, Von Minckwitz G. Molecular basis for the development of novel taxanes in the treatment of metastatic breast cancer. Eur J Cancer Suppl. 2008;6:3–11.

Publication types

MeSH terms