. 2024 Mar 25;14(6):2379-2395.
doi: 10.7150/thno.91572. eCollection 2024.

Hepatic progenitor cell-originated ductular reaction facilitates liver fibrosis through activation of hedgehog signaling

Affiliations

Hepatic progenitor cell-originated ductular reaction facilitates liver fibrosis through activation of hedgehog signaling

Yonghong Hu et al. Theranostics. .

Abstract

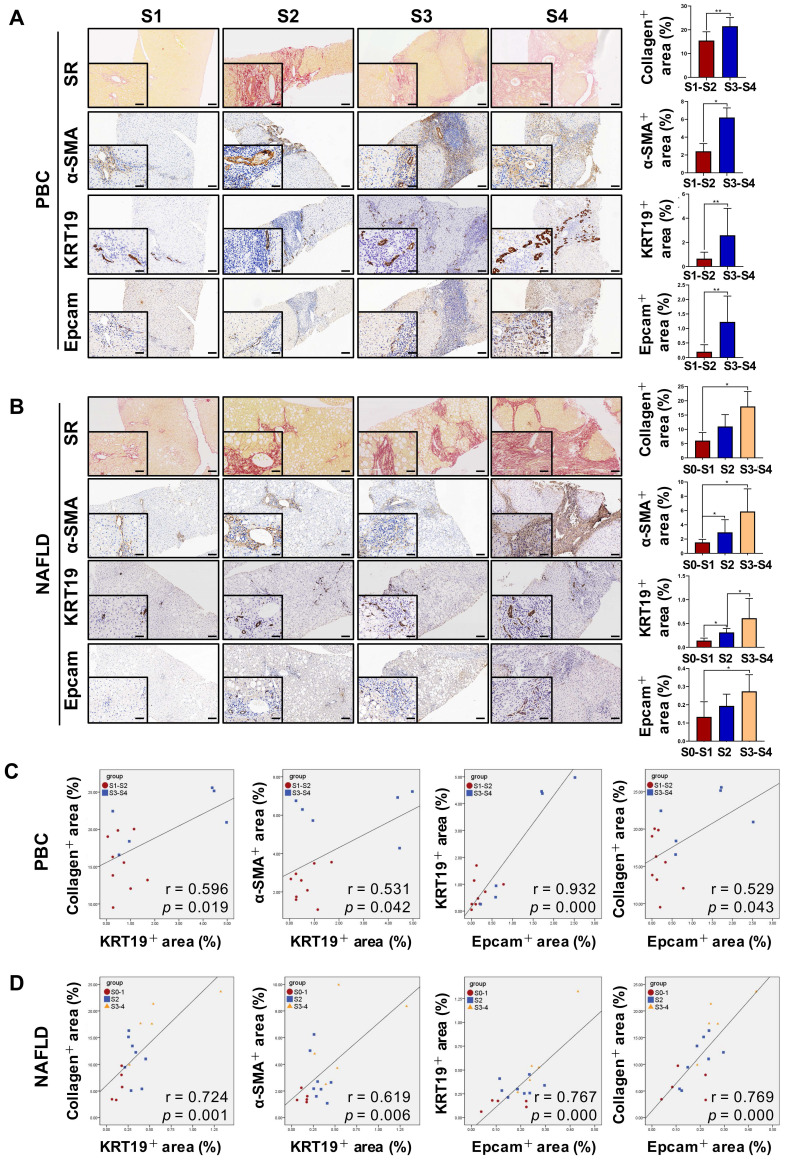
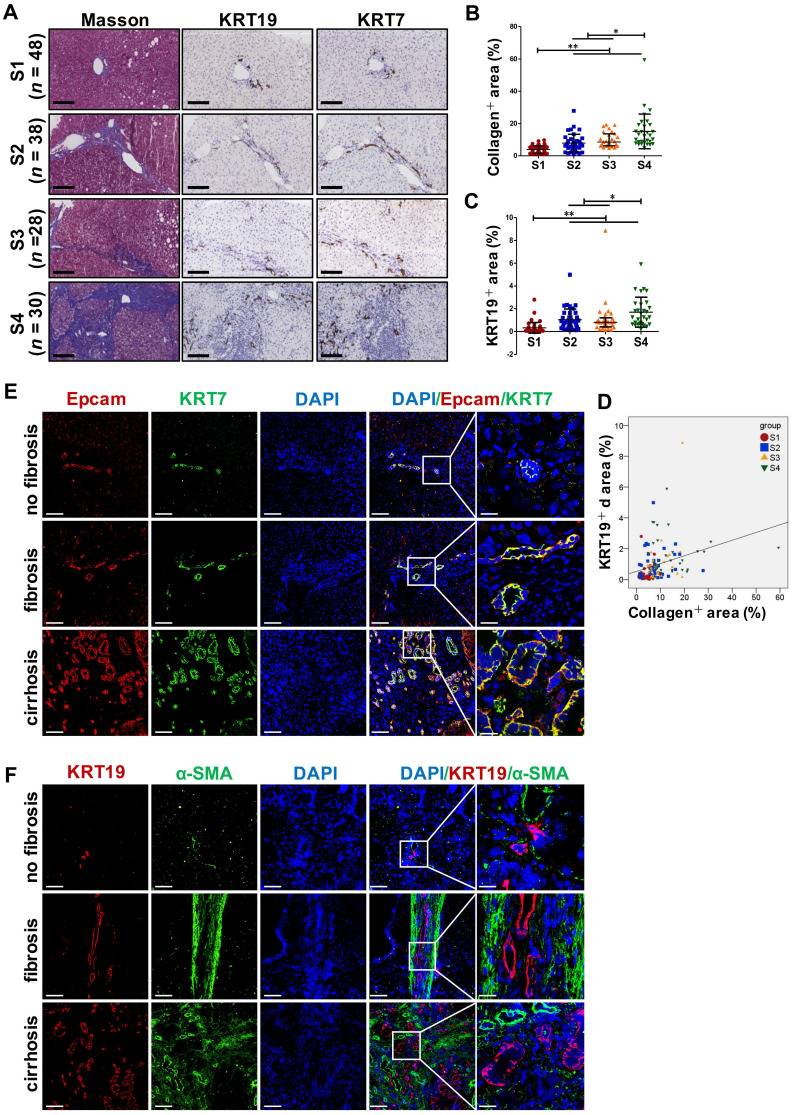
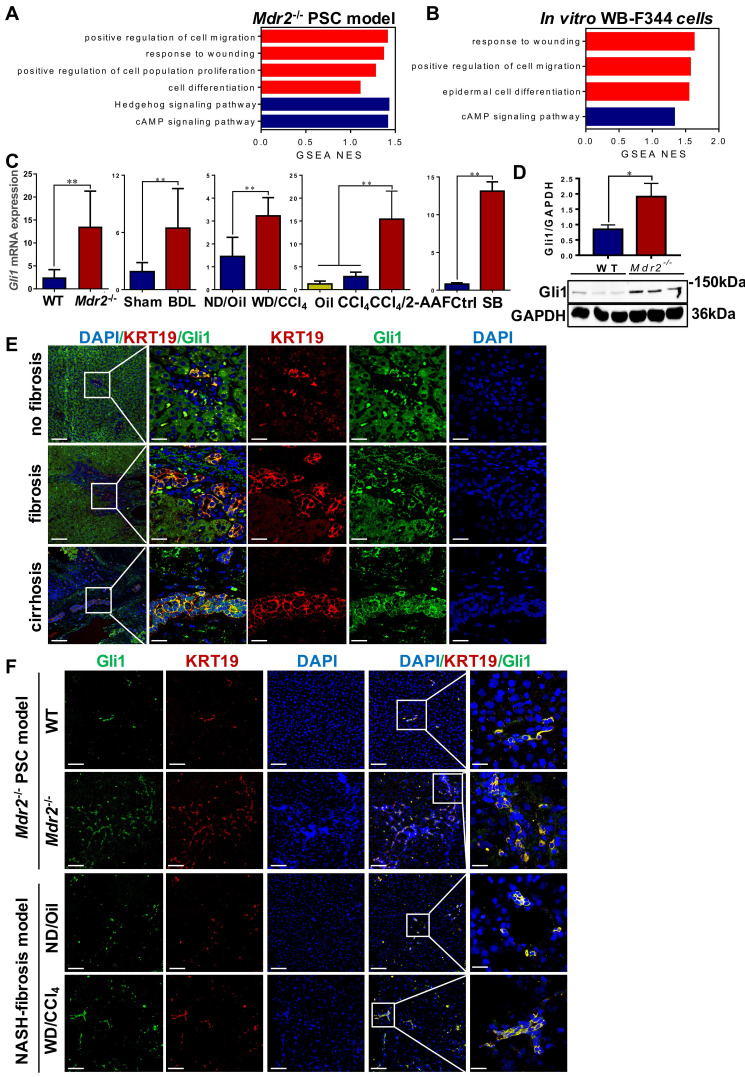
Background: It is poorly understood what cellular types participate in ductular reaction (DR) and whether DR facilitates recovery from injury or accelerates hepatic fibrosis. The aim of this study is to gain insights into the role of hepatic progenitor cell (HPC)-originated DR during fibrotic progression. Methods: DR in liver specimens of PBC, chronic HBV infection (CHB) or NAFLD, and four rodent fibrotic models by different pathogenic processes was evaluated. Gli1 expression was inhibited in rodent models or cell culture and organoid models by AAV-shGli1 or treating with GANT61. Results: Severity of liver fibrosis was positively correlated with DR extent in patients with PBC, CHB or NAFLD. HPCs were activated, expanded, differentiated into reactive cholangiocytes and constituted "HPC-originated DR", accompanying with exacerbated fibrosis in rodent models of HPC activation & proliferation (CCl4/2-AAF-treated), Μdr2-/- spontaneous PSC, BDL-cholestatic fibrosis or WD-fed/CCl4-treated NASH-fibrosis. Gli1 expression was significantly increased in enriched pathways in vivo and in vitro. Enhanced Gli1 expression was identified in KRT19+-reactive cholangiocytes. Suppressing Gli1 expression by administration of AAV-shGli1 or GANT61 ameliorated HPC-originated DR and fibrotic extent. KRT19 expression was reduced after GANT61 treatment in sodium butyrate-stimulated WB-F344 cells or organoids or in cells transduced with Gli1 knockdown lentiviral vectors. In contrast, KRT19 expression was elevated after transducing Gli1 overexpression lentiviral vectors in these cells. Conclusions: During various modes of chronic injury, Gli1 acted as an important mediator of HPC activation, expansion, differentiation into reactive cholangiocytes that formed DR, and subsequently provoked hepatic fibrogenesis.

Keywords: Gli1; ductular reaction; hepatic progenitor cells; liver fibrosis; reactive cholangiocytes.


Conflict of interest statement

Competing Interests: The authors have declared that no competing interest exists.

Figures

Figure 1
Figure 1
The correlation among the degree of liver fibrosis, HSC activation and DR in patients with PBC or NAFLD. (A) Representative images of liver sections stained with SR (scale bar = 200 µm), α-SMA (scale bar = 100 µm), KRT19 (scale bar = 100 µm) and Epcam (scale bar = 100 µm) and morphometric quantification of the SR+ area (%), α-SMA + area (%), KRT19+ area (%) and Epcam+ area (%) in patients with PBC (n = 15) (A) or NAFLD (n = 18) (B). The lower left in A and B is the higher magnification (scale bar = 50 µm). Correlation analysis among the collagen+ area (%), α-SMA + area (%), KRT19+ area (%) and Epcam+ area (%) in patients with PBC (C) or NAFLD (D). Data are represented as mean ± SD (represented by error bars). *, p < 0.05; **, p < 0.01. p values determined by Student's t test in (A), one-way ANOVA in (B), and Spearman's correlation analysis in (C), (D).
Figure 2
Figure 2
Collagen expression and immunohistochemical staining in the liver specimens of patients with HBV infection, or hemangioma/paracancerous tissues of patients with hepatic hemangioma and HCC. A-F showed the results of patients with HBV infection, (A) Representative images of liver serial sections from patients infected with HBV with different stages of liver fibrosis stained with Masson, KRT19 antibody and KRT7 antibody (scale bar = 100 µm) (S1, n = 48; S2, n = 38; S3, n = 28; S4, n = 30). (B) Morphometric quantification of the collagen+ area stained with Masson (%). (C) Morphometric quantification of the KRT19+ area (%). (D) Correlation analysis between the collagen+ area (%) and the percentage of KRT19+ area (%). E-F showed the results of the hemangioma/paracancerous tissues of patients with hepatic hemangioma and HCC (n = 3 per group), (E) Confocal analysis of co-staining for Epcam (red) and KRT7 (green) of frozen sections (scale bar = 100 µm). (F) Confocal analysis of co-staining for α-SMA (green) and KRT19 (red) of frozen sections (scale bar = 100 µm). Nuclei counterstained with DAPI (blue). The right-most column in A and B is the higher magnification of the white box area (scale bar = 25 µm). *, p < 0.05; **, p < 0.01. p values determined by one-way ANOVA in (B), (C), and Spearman's correlation analysis in (D).
Figure 3
Figure 3
In CCl4/2-AAF-treated rats, 2-AAF induced the activation, proliferation, and differentiation of HPC into cholangiocytes. (A) Schematic diagram of the experimental design of the HPC activation & proliferation model. (B) Gene expression of Epcam, Sox9, Krt7, Krt19, Ki67, and Ccnd1 was determined by qRT-PCR (n = 6 per group). (C) Representative staining for OV6, Epcam, KRT19, and KRT7 was performed on paraffin liver sections (scale bar = 100 µm), and morphometric quantification of the Epcam+ area (%). (D) Immunoblotting for KRT19. GAPDH was used as loading control (n=4 per group). (E) Confocal analysis of co-staining for KRT19 (red), OV6 (green) and DAPI (blue) of frozen sections (scale bar = 100 µm). Higher magnification of the white box area (scale bar = 25 µm) is shown in the right-most column. (F) Representative staining for Ki67 and Epcam in serial sections. The red arrow points to the cells co-expressed Ki67 and Epcam. (G) Representative SR (scale bar = 200 µm) staining and collagen morphometry (%) of SR+ area (n = 6 per group). *, p < 0.05; **, p < 0.01. p values determined by one-way ANOVA analysis.
Figure 4
Figure 4
Gli1 was up-regulated in patients' liver specimens, in vivo fibrotic models and in vitro. (A) GSEA of RNA-Seq from WT and Mdr2-/- mice liver (n = 3 mice/group). (B) GSEA of RNA-Seq from WB-F344 cells treated or not treated with SB (n = 3 independent replications). (C) Gene expression of Gli1 of liver samples in different fibrotic models and WB-F344 cells was determined by qRT-PCR (n = 6 per group). (D) Immunoblotting for Gli1 of WT and Mdr2-/- mice liver. GAPDH was used as loading control. (E) Confocal analysis of co-staining for KRT19 (red) and Gli1 (green) of paraffin sections in hemangioma/paracancerous tissues of patients with hepatic hemangioma and HCC (scale bar = 100 µm and 25 µm). (F) Confocal analysis of co-staining for KRT19 (red) and Gli1 (green) of paraffin sections in Mdr2-/- mice and WD-fed/CCl4-treated mice. Nuclei counterstained with DAPI (blue) (scale bar = 100 µm and 25 µm). *, p < 0.05; **, p < 0.01. p values determined by Student's t test or one-way ANOVA analysis.
Figure 5
Figure 5
Gli1 mediated the differentiation of WB-F344 cells into cholangiocytes in vitro. (A) Gene expression of Gli1, Dhh, Ptch2, Krt19, Ki67, Il-6 and Tnf-α was determined by qRT-PCR. (B) Representative images of WB-F344 cells stained with Gli1, KRT19 (scale bar = 33.3 µm) and Edu (scale bar = 100 µm) with or without GANT61. (C) Representative images of WB-F344 organoids stained with KRT7 (scale bar = 100 µm) with or without GANT61. (D) Immunoblotting and quantification for α-SMA and Col-I production of LX-2 cells in co-culture with WB-F344 cells. GAPDH was used as loading control. (E) Gene expressions of Gli1, Krt19, Tnfα, Ki67, and Ccnd1 after Gli1 knockdown. (F) Immunoblotting for KRT19 after Gli1 overexpression. GAPDH was used as loading control. (G) Gene expression of Gli1 and Krt19 after Gli1 overexpression. All cell experiments were repeated three times using independent cell cultures. *, p < 0.05; **, p < 0.01. p values determined by one-way ANOVA analysis.
Figure 6
Figure 6
The degree of DR and hepatic fibrosis in Mdr2-/- mice after injected with AAV-NC or AAV-shGli1. (A) Schematic diagram of the experimental design showed that Mdr2-/- mice were injected with AAV-NC or AAV-shGli1 by tail vein at the age of 9 weeks (n = 6 per group). (B) Immunoblotting and quantification for Gli1, Epcam, KRT19 and α-SMA. GAPDH was used as loading control (n = 3 per group). (C) Gene expressions of Gli1, Col1a1 and Krt7. (D) Representative H&E (scale bar = 100 µm), SR (scale bar = 200 µm) staining, and collagen morphometry (%) of SR+ area. (E) Representative images of liver sections stained with KRT7, Epcam, KRT19, and α-SMA (Scale bar = 100 µm). (F) Confocal analysis of co-staining for Epcam (red), KRT7 (green) and DAPI (blue) of frozen sections (scale bar = 100 µm). Higher magnification of the white box area (scale bar = 25 µm) is shown in the right-most column. *, p < 0.05; **, p < 0.01. p values determined by Student's t test analysis.
Figure 7
Figure 7
The effect of GANT61 on DR and liver fibrosis in CCl4/2-AAF-treated rats. (A) Schematic diagram of the experimental design of treatment with GANT61 in CCl4/2-AAF-treated rats (n = 6-8 per group). (B) Gene expressions of Gli1, Epcam, Krt19, Krt7, and Ki67. (C) Confocal analysis of co-staining for KRT19 (red) and OV6 (green) of frozen sections (scale bar = 100 µm). The right-most column is the higher magnification of the white box area (scale bar = 25 µm). (D) Immunoblotting for KRT19 and α-SMA. The quantification of KRT19 and α-SMA were measured employing histogram normalized to GAPDH protein based on the results of Western blot (n = 3 per group). (E) Serum ALT and AST activities. (F) Representative H&E (scale bar = 100 µm), SR (scale bar = 200 µm), and α-SMA (scale bar = 100 µm) staining. (G) Collagen morphometry (%) of SR+ area. *, p < 0.05; **, p < 0.01. p values determined by one-way ANOVA analysis.
Figure 8
Figure 8
The effect of GANT61 on DR and the degree of liver fibrosis in BDL rats. (A) Gene expression of Gli1, Ptch2, Krt19, Acta2 and Col1a1 was determined by qRT-PCR. All mRNA values were normalized against Gapdh levels and are shown relative to expression level in the control group (n = 6-8 per group). (B) Immunoblotting for KRT19 and Epcam. GAPDH was used as loading control (n = 3 per group). (C) Confocal analysis of co-staining for HNF4α (red) and OV6 (green) (scale bar = 100 µm). The white arrows indicated the HNF4α+/OV6+ cells. (D) Confocal analysis of co-staining for KRT19 (red) and OV6 (green) (scale bar = 100 µm). (E) Representative images of liver sections stained with SR (scale bar = 200 µm), and collagen morphometry (%) of SR+ area. (F) Serum ALT and AST activities, and ALB content. (G) Hepatic collagen content as determined biochemically via Hyp. *, p < 0.05; **, p < 0.01. p values determined by one-way ANOVA analysis.

References

    1. Marcellin P, Kutala BK. Liver diseases: A major, neglected global public health problem requiring urgent actions and large-scale screening. Liver Int. 2018;38(Suppl 1):2–6. - PubMed
    1. Kisseleva T, Brenner D. Molecular and cellular mechanisms of liver fibrosis and its regression. Nature reviews Gastroenterology & hepatology. 2021;18:151–66. - PubMed
    1. Roskams TA, Theise ND, Balabaud C, Bhagat G, Bhathal PS, Bioulac-Sage P. et al. Nomenclature of the finer branches of the biliary tree: canals, ductules, and ductular reactions in human livers. Hepatology. 2004;39:1739–45. - PubMed
    1. Sato K, Marzioni M, Meng F, Francis H, Glaser S, Alpini G. Ductular Reaction in Liver Diseases: Pathological Mechanisms and Translational Significances. Hepatology. 2019;69:420–30. - PMC - PubMed
    1. Raven A, Lu WY, Man TY, Ferreira-Gonzalez S, O'Duibhir E, Dwyer BJ. et al. Cholangiocytes act as facultative liver stem cells during impaired hepatocyte regeneration. Nature. 2017;547:350–4. - PMC - PubMed

Publication types

MeSH terms