Reference Data Set for Circular Dichroism Spectroscopy Comprised of Validated Intrinsically Disordered Protein Models
- PMID: 38646777
- PMCID: PMC11453034
- DOI: 10.1177/00037028241239977
Reference Data Set for Circular Dichroism Spectroscopy Comprised of Validated Intrinsically Disordered Protein Models
Abstract
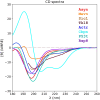
Circular dichroism (CD) spectroscopy is an analytical technique that measures the wavelength-dependent differential absorbance of circularly polarized light and is applicable to most biologically important macromolecules, such as proteins, nucleic acids, and carbohydrates. It serves to characterize the secondary structure composition of proteins, including intrinsically disordered proteins, by analyzing their recorded spectra. Several computational tools have been developed to interpret protein CD spectra. These methods have been calibrated and tested mostly on globular proteins with well-defined structures, mainly due to the lack of reliable reference structures for disordered proteins. It is therefore still largely unclear how accurately these computational methods can determine the secondary structure composition of disordered proteins. Here, we provide such a required reference data set consisting of model structural ensembles and matching CD spectra for eight intrinsically disordered proteins. Using this set of data, we have assessed the accuracy of several published CD prediction and secondary structure estimation tools, including our own CD analysis package, SESCA. Our results show that for most of the tested methods, their accuracy for disordered proteins is generally lower than for globular proteins. In contrast, SESCA, which was developed using globular reference proteins, but was designed to be applicable to disordered proteins as well, performs similarly well for both classes of proteins. The new reference data set for disordered proteins should allow for further improvement of all published methods.
Keywords: CD; CD prediction; Intrinsically disordered proteins; circular dichroism spectroscopy; protein ensemble refinement; reference data set; secondary structure estimation.
Conflict of interest statement
Declaration of Conflicting InterestsThe authors declared no potential conflicts of interest with respect to the research, authorship, and/or publication of this article.
Figures


Similar articles
-
SESCA: Predicting Circular Dichroism Spectra from Protein Molecular Structures.J Chem Theory Comput. 2019 Sep 10;15(9):5087-5102. doi: 10.1021/acs.jctc.9b00203. Epub 2019 Aug 28. J Chem Theory Comput. 2019. PMID: 31402660
-
Molecular Dynamics Ensemble Refinement of Intrinsically Disordered Peptides According to Deconvoluted Spectra from Circular Dichroism.Biophys J. 2020 Apr 7;118(7):1665-1678. doi: 10.1016/j.bpj.2020.02.015. Epub 2020 Feb 25. Biophys J. 2020. PMID: 32145192 Free PMC article.
-
DichroIDP: a method for analyses of intrinsically disordered proteins using circular dichroism spectroscopy.Commun Biol. 2023 Aug 8;6(1):823. doi: 10.1038/s42003-023-05178-2. Commun Biol. 2023. PMID: 37553525 Free PMC article.
-
Protein secondary structure analyses from circular dichroism spectroscopy: methods and reference databases.Biopolymers. 2008 May;89(5):392-400. doi: 10.1002/bip.20853. Biopolymers. 2008. PMID: 17896349 Review.
-
The role of circular dichroism spectroscopy in the era of integrative structural biology.Curr Opin Struct Biol. 2019 Oct;58:191-196. doi: 10.1016/j.sbi.2019.04.001. Epub 2019 May 8. Curr Opin Struct Biol. 2019. PMID: 31078334 Review.
Cited by
-
An origin for a eukaryotic lipid transfer protein fold in Asgard archaea.bioRxiv [Preprint]. 2025 Jun 8:2025.05.16.653879. doi: 10.1101/2025.05.16.653879. bioRxiv. 2025. PMID: 40475646 Free PMC article. Preprint.
-
Biochemical characterization and activity profiling of recombinant phospholipase A2 from Hemiscorpius lepturus expressed in E. coli with in vivo antibody response.Sci Rep. 2025 Apr 26;15(1):14609. doi: 10.1038/s41598-025-98261-z. Sci Rep. 2025. PMID: 40287457 Free PMC article.
-
Estimation of Peptide Helicity from Circular Dichroism Using the Ensemble Model.J Phys Chem B. 2024 Mar 21;128(11):2652-2663. doi: 10.1021/acs.jpcb.3c07511. Epub 2024 Mar 12. J Phys Chem B. 2024. PMID: 38470351 Free PMC article.
-
BeStSel: analysis site for protein CD spectra-2025 update.Nucleic Acids Res. 2025 Jul 7;53(W1):W73-W83. doi: 10.1093/nar/gkaf378. Nucleic Acids Res. 2025. PMID: 40357643 Free PMC article.
References
-
- Fasman G.D.. Circular Dichroism and the Conformational Analysis of Biomolecules. Boston, MA: Springer, 1996.
MeSH terms
Substances
LinkOut - more resources
Full Text Sources

