. 2024 May 15;151(10):dev202262.
doi: 10.1242/dev.202262. Epub 2024 May 17.

Two sequential gene expression programs bridged by cell division support long-distance collective cell migration

Affiliations

Two sequential gene expression programs bridged by cell division support long-distance collective cell migration

Jingjing Sun et al. Development. .

Abstract

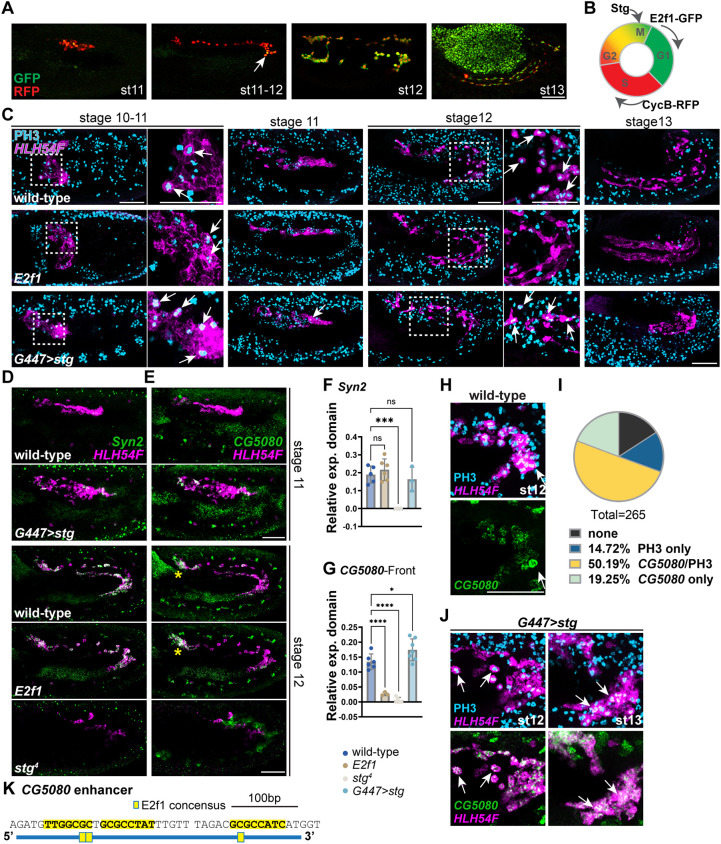
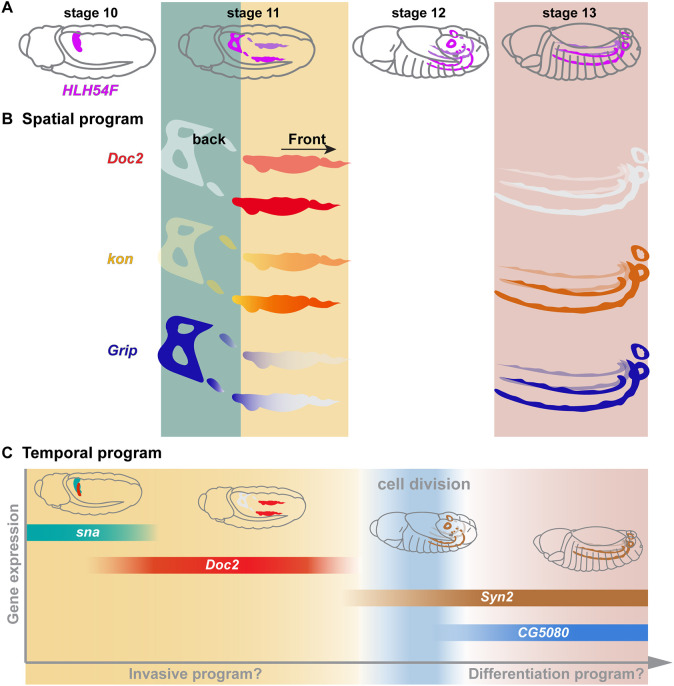
The precise assembly of tissues and organs relies on spatiotemporal regulation of gene expression to coordinate the collective behavior of cells. In Drosophila embryos, the midgut musculature is formed through collective migration of caudal visceral mesoderm (CVM) cells, but how gene expression changes as cells migrate is not well understood. Here, we have focused on ten genes expressed in the CVM and the cis-regulatory sequences controlling their expression. Although some genes are continuously expressed, others are expressed only early or late during migration. Late expression relates to cell cycle progression, as driving string/Cdc25 causes earlier division of CVM cells and accelerates the transition to late gene expression. In particular, we found that the cell cycle effector transcription factor E2F1 is a required input for the late gene CG5080. Furthermore, whereas late genes are broadly expressed in all CVM cells, early gene transcripts are polarized to the anterior or posterior ends of the migrating collective. We show this polarization requires transcription factors Snail, Zfh1 and Dorsocross. Collectively, these results identify two sequential gene expression programs bridged by cell division that support long-distance directional migration of CVM cells.

Keywords: Caudal visceral mesoderm; Cell cycle progression; Collective cell migration; Spatiotemporal gene expression; Transcription programs.


Conflict of interest statement

Competing interests The authors declare no competing or financial interests.

Figures

Fig. 1.
Fig. 1.
Enhancers supporting expression in CVM cells exhibit spatiotemporal differences in gene expression outputs. (A-B′) Drosophila embryo time series (stage 10-13) showing expression detected by in situ hybridization using a hybridization chain reaction (HCR) probe to HLH54F transcript (magenta) either alone (A) or when colocalized relative to zfh1 (green; B). B′ is a magnified view of CVM cells outlined in B. Anterior to the left and dorsal upwards. (C) ChIP data for the transcription factors Zfh1, Bin, Mef2 and Doc2. Regions assayed for enhancer activity are highlighted in green (Zfh1-binding enriched) or blue (Zfh1-binding not enriched). (D) Reporter outputs for indicated enhancer regions (C) using in situ hybridization with regular riboprobes to GAL4 and HLH54F or with HCR probes to lacZ and HLH54F. Scale bars: 50 μm.
Fig. 2.
Fig. 2.
Characterization of genes expressed in migrating CVM cells. (A-C) CVM-specific gene expression facilitated by colocalization of transcripts using hybridization chain reaction probes for indicated genes (green) and HLH54F (magenta) through in situ hybridization. Genes are either continuously expressed (A), expressed predominantly early but become restricted (B) or expressed late (C). Asterisks in C indicate initiation of late gene expression. Anterior to the left and dorsal upwards. Scale bars: 50 μm.
Fig. 3.
Fig. 3.
scRNA-seq data confirm gene expression dynamics; computational analysis of enhancer sequences identifies important inputs. (A-D) UMAP plots of single-cell transcriptomic data relating to embryos predominantly of stages 7-11 from a published study (Sun et al., 2023) in which CVM cells are contained in one particular cluster 10 (c10, red; A). (A′) Focused view of the UMAP plot of c10 cells (area outlined in A) analyzed by monocle pseudotime analysis in which younger versus older cells are colored in cyan and dark blue, respectively. Expression of the three categories of indicated CVM-expressed genes in c10 with red color intensity indicating the relative levels of gene expression (B-D). (E) UMAP plot showing byn and CG5953 expression suggesting that, although byn is expressed early, CG5953 is expressed late in the CVM (E, compare with C and D). (F) Hybridization chain reaction in situ hybridization confirms the CVM-specific expression of CG5953 at stage 11-12 (cyan) relative to HLH54F (magenta, marking CVM cells). (G) De novo PWM logos identified via XSTREME with comparisons to published motifs; E-value=6e-005 for each motif. (H) Locations of identified consensus binding motifs (de novo motifs from G) on identified enhancers generated by MAST. Block diagrams of enhancers named according to the genes they regulate; zCRM3419 relates to the zfh1.v enhancer that supports the late gene expression (see Fig. 1D). E value for each corresponding enhancer sequence is shown on the left. Anterior to the left and dorsal upwards. Scale bar: 50 μm.
Fig. 4.
Fig. 4.
Cell cycle progression influences expression dynamics of a subset of genes in the CVM, including CG5080. (A,B) Cell cycle progression shown by the Fly-FUCCI system (Zielke et al., 2014; Macabenta et al., 2022) in embryos when G447-GAL4 is used to drive CVM-specific reporter expression and antibodies are used to detect RFP and GFP signals. Anti-RFP indicates cells during S phase (red), anti-GFP shows cells at G1 phase (green), and merged signal (yellow) shows cells at G2 to M. (C) Anti-PH3 staining (light blue) indicates the cell division patterns in the CVM migrating cohort (stage 10-13) in wild-type and mutant embryos. Arrows indicate the dividing cells with nuclear PH3 signals, and HLH54F hybridization chain reaction (HCR) probe labeling CVM cells (magenta). Areas outlined are shown at higher magnification on the right. (D,E) CG5080 and Syn2 (green) colocalizing with HLH54F (magenta) by HCR in situ hybridization in wild-type and cell cycle-disrupted mutant embryos at stages 11-12. (F) Quantification of relative expression of Syn2 (D, green) in HLH54F-positive CVM cells (D, magenta) detected by HCR probes in control and mutant embryos. (G) Quantification of relative expression of CG5080 (E, green) in CVM cells at the front of the collective (E, magenta). Two-tailed one-way ANOVA with Dunnett's multiple comparisons test was performed (*P<0.05, ***P<0.001, ****P<0.0001). (H-J) Strong CG5080 expression (green) correlates with cell division (PH3, light blue) that takes place at the posterior turn of stage 12 embryos [arrows in H (wild type); quantified in I (265 cells, n=10 embryos); see Materials and Methods] or additionally at stage 13 in embryos overexpressing stg [arrows in J (G447>stg)]. (K) E2F1 consensus binding site matches within the CG5080 enhancer, supporting expression in CVM cells. Anterior to the left and dorsal upwards. Scale bars: 50 μm.
Fig. 5.
Fig. 5.
Phenotypes associated with mutants for TFs expressed early in development: snail, zfh1, Doc1, Doc2 and Doc3. (A-I) CVM cells are labeled with HLH54F probes in magenta; expression of sna, zfh1 and Doc2 are detected with hybridization chain reaction probes in green. (A,B,G,H) Deletion of the sna distal enhancer results in a loss of sna expression in the CVM cells (G) that is normally observed at stage 10 and restricted to the very posterior cells at stage 11 (A). Loss of zfh1 leads to an increased sna expression that persists to stage 11 (arrows, B; slightly older stage than A). (C,I) zfh1 expression is unaffected by loss of sna or Doc genes; see Fig. 1B for control. (D-F) Both zfh1 and sna are required for maintaining the expression of Doc2 in the migrating CVM cells. Magnified views of the outlined area are shown on the right. (J) Diagram showing the regulatory relationship between sna, zfh1 and Doc genes (Doc1, Doc2 and/or Doc3). (K-M) Quantification of Doc2 expression in the CVM cells (D-F, stage 11 early) as measured by its fluorescence intensity profile from the anterior (0%) to posterior (100%) of the migrating collective. Profile of HLH54F is also shown to locate CVM cells (see Materials and Methods). n=3, shaded area showing error bar calculated with standard deviation. Yellow color highlights the region of co-expression of Doc2 (green) and HLH54F (magenta) in the CVM cells. Anterior to the left and dorsal upwards. Scale bars: 50 μm.
Fig. 6.
Fig. 6.
sna, zfh1 and DocA mutants exhibit defects in polarized gene expression within the migrating CVM cell collective but have limited effects on timing of gene expression. (A-D) kon (A,A′,B) and Grip (C,C′,D) expression in the CVM cells (labeled by HLH54F), as detected by hybridization chain reaction in situ hybridization in wild-type, snaΔD1.8, zfh12 and DocA mutant backgrounds. A′ and C′ show individual kon and Grip localizations to the front or back of the migrating collective, respectively. (E-H) Quantification of transcript levels shown as fluorescence intensity measured from posterior (0%) to anterior (100%) in the migrating collective shown in wild type versus kon mutant. Yellow and green shaded areas indicate overlap between kon and HLH54F (E,F) or Grip and HLH54F (G,H) signals, respectively; gray shading indicates low to no expression (see Materials and Methods). kon expression in all mutants is expanded (B, also quantified in F for the zfh12 mutant), whereas Grip enrichment in the posterior domain is only affected in zfh12 and DocA mutants (D,H); see also Fig. S5. (I) CVM migration assayed using anti-GFP antibody staining in wild-type, zfh12 and DocA mutant backgrounds carrying the V2 transgene (HLH54F.v2-venus) or with HLH54F riboprobe and in situ hybridization in snaΔD1.8 mutant. Arrow indicates specific CVM cells in the zfh12 mutant that mismigrate, moving ventrally instead of anteriorly, whereas CVM migration in DocA mutants is severely and generally disrupted. At stage 13, asterisks indicate the boundary between the first and second thoracic segments (i.e. T1/T2 boundary), which is the normal anterior-most position that CVM cells migrate to (Urbano et al., 2011). Anterior to the left and dorsal upwards. Scale bars: 50 μm.
Fig. 7.
Fig. 7.
Disrupting cell cycle progression has little effect on polarized gene expression but cell cycle progression and loss of Doc genes accelerate CG5080 expression. (A,C) Expression of kon (green, A) or Doc2 (green, C) in CVM cells (HLH54F, magenta) detected by in situ hybridization with hybridization chain reaction (HCR) probes in wild-type and cell cycle mutants: stg mutant (lacks cell division) or ectopic expression of stg (i.e. G447>stg; supporting extra cell division). (B) Quantification of kon localization in the CVM (stage 11 late, shown in A) as measured by its fluorescence intensity profile from anterior (0%) to posterior (100%) along with HLH54F (see Materials and Methods). Yellow shaded areas indicate overlap between kon and HLH54F, whereas gray shading indicates low to no expression. (D) HCR in situ hybridization showing overexpression of stg (5053>stg) speeds up the transition from Doc2 (green) to CG5080 (red, D′) expression in CVM cells (magenta). The outlined areas are shown at higher magnification in the lower panels. Arrows indicate cells in which Doc2 expression is low but CG5080 is high. (E) Quantification of D indicates that Doc2 and CG5080 show opposite trends over time; the switch is earlier upon ectopic expression of stg (5053>stg). Two-tailed two-way ANOVA test was performed with corrections for multiple comparisons using statistical hypothesis testing. For CG5080-Front, n=8, 8, 8 and 6 (at stage 11 early, stage 11 late, stage 12 and stage 13, respectively, in wild type); n=6, 8, 6 and 5 (in 5053>stg). For Doc2, n=8, 8, 5 and 6 (in wild type); n=6, 6, 5 and 5 (in 5053>stg). *P<0.05; ***P<0.001. Individual data points are provided when n<5. (F,G,) CG5080 levels are decreased relative to wild type when continuing expression of Doc2 in the CVM is forced by 5053-GAL4 (F) and quantification measuring the difference (two-tailed unpaired t-test, P<0.0001, G). (H,I) In the DocA mutant, CG5080 is not expressed at stage 11; however, when stg is ectopically expressed in the CVM of DocA mutants using a HLH54F.v-GAL4 driver, then CG5080 expression is initiated early throughout the CVM (two-tailed unpaired t-test, ****P<0.0001, I). Anterior to the left and dorsal upwards. Scale bars: 50 μm.
Fig. 8.
Fig. 8.
Schematic summarizing spatial and temporal gene expression programs in migratory CVM cells demarcated by cell division and possible additional factors. (A) Schematic showing the course of HLH54F-expressing CVM cell migration. (B) Spatial program schematics illustrating polarized localization of CVM genes before cell division (stage 11) and uniform distribution after cell division (stage 13). (C) Schematic illustrating dynamic and temporally restricted expression of genes before and after cell division, which normally takes place at stage 12. Temporally restricted CG5080 expression is established by a combination of positive regulation by cell division and repression by Doc2.

Similar articles

Cited by

References

    1. Asp, P., Acosta-Alvear, D., Tsikitis, M., van Oevelen, C. and Dynlacht, B. D. (2009). E2f3b plays an essential role in myogenic differentiation through isoform-specific gene regulation. Genes Dev. 23, 37-53. 10.1101/gad.1727309 - DOI - PMC - PubMed
    1. Bae, Y.-K., Macabenta, F., Curtis, H. L. and Stathopoulos, A. (2017). Comparative analysis of gene expression profiles for several migrating cell types identifies cell migration regulators. Mech. Dev. 148, 40-55. 10.1016/j.mod.2017.04.004 - DOI - PMC - PubMed
    1. Bailey, T. L. and Gribskov, M. (1998). Combining evidence using p-values: application to sequence homology searches. Bioinformatics 14, 48-54. 10.1093/bioinformatics/14.1.48 - DOI - PubMed
    1. Broihier, H. T., Moore, L. A., Doren, M. V., Newman, S. and Lehmann, R. (1998). zfh-1 is required for germ cell migration and gonadal mesoderm development in Drosophila. Development 125, 655-666. 10.1242/dev.125.4.655 - DOI - PubMed
    1. Busch, H., Camacho-Trullio, D., Rogon, Z., Breuhahn, K., Angel, P., Eils, R. and Szabowski, A. (2008). Gene network dynamics controlling keratinocyte migration. Mol. Syst. Biol. 4, 199. 10.1038/msb.2008.36 - DOI - PMC - PubMed

MeSH terms

Substances