. 2024 May 22;52(9):4843-4856.
doi: 10.1093/nar/gkae294.

High-density generation of spatial transcriptomics with STAGE

Affiliations

High-density generation of spatial transcriptomics with STAGE

Shang Li et al. Nucleic Acids Res. .

Abstract

Spatial transcriptome technologies have enabled the measurement of gene expression while maintaining spatial location information for deciphering the spatial heterogeneity of biological tissues. However, they were heavily limited by the sparse spatial resolution and low data quality. To this end, we develop a spatial location-supervised auto-encoder generator STAGE for generating high-density spatial transcriptomics (ST). STAGE takes advantage of the customized supervised auto-encoder to learn continuous patterns of gene expression in space and generate high-resolution expressions for given spatial coordinates. STAGE can improve the low quality of spatial transcriptome data and smooth the generated manifold of gene expression through the de-noising function on the latent codes of the auto-encoder. Applications to four ST datasets, STAGE has shown better recovery performance for down-sampled data than existing methods, revealed significant tissue structure specificity, and enabled robust identification of spatially informative genes and patterns. In addition, STAGE can be extended to three-dimensional (3D) stacked ST data for generating gene expression at any position between consecutive sections for shaping high-density 3D ST configuration.


Figures

Graphical Abstract
Graphical Abstract
Figure 1.
Figure 1.
Overview of STAGE. (A) STAGE takes the normalized gene expression profiles of the measured spots as the input and the spatial locations as labels for the hidden layer and reconstructs the gene expression data of the measured spots in the output layer. After training, STAGE generates the gene expression profiles for arbitrary unmeasured spots with the decoder. (B) STAGE can be applied to generate high-density gene expression profiles, identify robust spatially variable genes, and generate gene expression data for blank sections between two ST sections to achieve high-resolution 3D reconstruction.
Figure 2.
Figure 2.
STAGE enables better recovery of gene expression profile in the human dorsolateral prefrontal cortex (DLPFC) tissue. (A) Manual annotation of cortical layers and white matter (WM) in section 151676. (B) Boxplot showing Pearson correlations between the raw and recovered data by STAGE, HisToGene, DeepSpaCE and ST-Net in all sections, respectively. (C) Spatial visualization of marker genes PCP4 and FABP4 for the down-sampled and recovered data by STAGE, HisToGene, DeepSpaCE and ST-Net in section 151676, respectively. (D) UMAP visualization and PAGA graphs for the down-sampled and recovered data by STAGE, HisToGene, DeepSpaCE and ST-Net in section 151676, respectively.
Figure 3.
Figure 3.
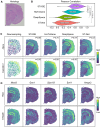
STAGE enhances gene expression patterns in the mouse brain tissue coronal section. (A) Histology image of the mouse brain tissue coronal section. (B) Boxplot showing Pearson correlations between the raw and recovered data by STAGE, HisToGene, DeepSpaCE and ST-Net, respectively. (C) Spatial visualization of marker genes Hpca and Camk2n1 for the down-sampled and recovered data by STAGE, HisToGene, DeepSpaCE and ST-Net, respectively. (D) Spatial visualization of marker genes Mast3, Gse1, Sipa1l3, Sorl1 and Hmgn2 for the raw and generated data, respectively.
Figure 4.
Figure 4.
STAGE can identify spatially variable genes and patterns in the pancreatic ductal adenocarcinoma (PDAC) tissue. (A) Manual annotation of histology image in the PDAC tissue. (B) Venn plot of informative genes and top 100 genes by Hotspot from the raw and generated data. (C) Commonly enriched KEGG pathways for top 100 genes by Hotspot in the raw and generated data. (D) Spatial visualization of marker genes DDIT4, COL1A1 and MUC6 among the top 100 genes by Hotspot only from the generated data. (E) KEGG pathways enriched for both Hotspot gene module 1 in the raw and generated data. (F) Spatial visualization of module scores for Hotspot gene module 1 in the raw and generated data. (G) Spatial visualization of marker genes CEL, CTRC, CTRB2 and GP2 from Hotspot gene module 1 in the generated data.
Figure 5.
Figure 5.
STAGE enables robust cell type prediction and tissue domain segmentation in human breast cancer tissue section 1. (A) Histology image of the human breast cancer tissue section 1. (B) Boxplot showing Pearson correlations between the raw and recovered data by STAGE, HisToGene, DeepSpaCE and ST-Net. (C) Spatial visualization of marker gene set scores for T-cells, Cancer Epithelium, CAFs, and Myeloid cells and tissue structure segmentations. (D) Spatial visualization of marker genes CD3E, KRT18, COL1A1 and LYZ, corresponding to T-cells, Cancer Epithelium, CAFs and Myeloid cells, respectively.
Figure 6.
Figure 6.
STAGE can generate gene expression data between consecutive ST sections for better 3D reconstruction. (A) Schematic diagrams showing the recovery and generation experiments of the mouse olfactory bulb tissue. (B) Diagrams of the first three slices used for training with each bead colored by the percentage of mitochondrial genes. (C) Spatial visualization of marker genes Pcp4 and Lrp1b for the raw and recovered data in sections 2, 4 and 7 by STAGE. (D) 3D visualization of marker genes Nrxn3, Pcp4, Nrsn1, Stmn2, Lrp1b and Doc2g for the recovered data in original ST sections and generated ones.

References

    1. Asp M., Giacomello S., Larsson L., Wu C., Fürth D., Qian X., Wärdell E., Custodio J., Reimegård J., Salmén F. et al. . A spatiotemporal organ-wide gene expression and cell atlas of the developing human heart. Cell. 2019; 179:1647–1660. - PubMed
    1. Chen W.-T., Lu A., Craessaerts K., Pavie B., Sala Frigerio C., Corthout N., Qian X., Laláková J., Kühnemund M., Voytyuk I. et al. . Spatial transcriptomics and in situ sequencing to study Alzheimer's disease. Cell. 2020; 182:976–991. - PubMed
    1. Cui G., Dong K., Zhou J.-Y., Li S., Wu Y., Han Q., Yao B., Shen Q., Zhao Y.-L., Yang Y. et al. . Spatiotemporal transcriptomic atlas reveals the dynamic characteristics and key regulators of planarian regeneration. Nat. Commun. 2023; 14:3205. - PMC - PubMed
    1. Ji A.L., Rubin A.J., Thrane K., Jiang S., Reynolds D.L., Meyers R.M., Guo M.G., George B.M., Mollbrink A., Bergenstråhle J. et al. . Multimodal analysis of composition and spatial architecture in human squamous cell carcinoma. Cell. 2020; 182:497–514. - PMC - PubMed
    1. Vickovic S., Eraslan G., Salmén F., Klughammer J., Stenbeck L., Schapiro D., Äijö T., Bonneau R., Bergenstråhle L., Navarro J.F. et al. . High-definition spatial transcriptomics for in situ tissue profiling. Nat. Methods. 2019; 16:987–990. - PMC - PubMed