. 2024 Apr 1;34(4):bhae120.
doi: 10.1093/cercor/bhae120.

The Subcortical Atlas of the Marmoset ("SAM") monkey based on high-resolution MRI and histology

Affiliations

The Subcortical Atlas of the Marmoset ("SAM") monkey based on high-resolution MRI and histology

Kadharbatcha S Saleem et al. Cereb Cortex. .

Abstract

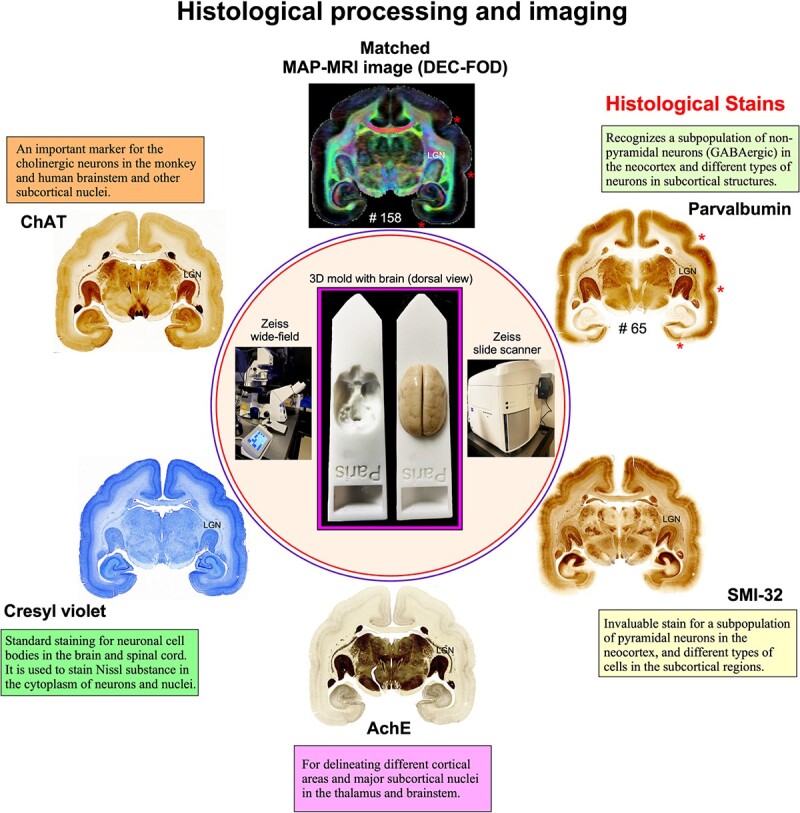
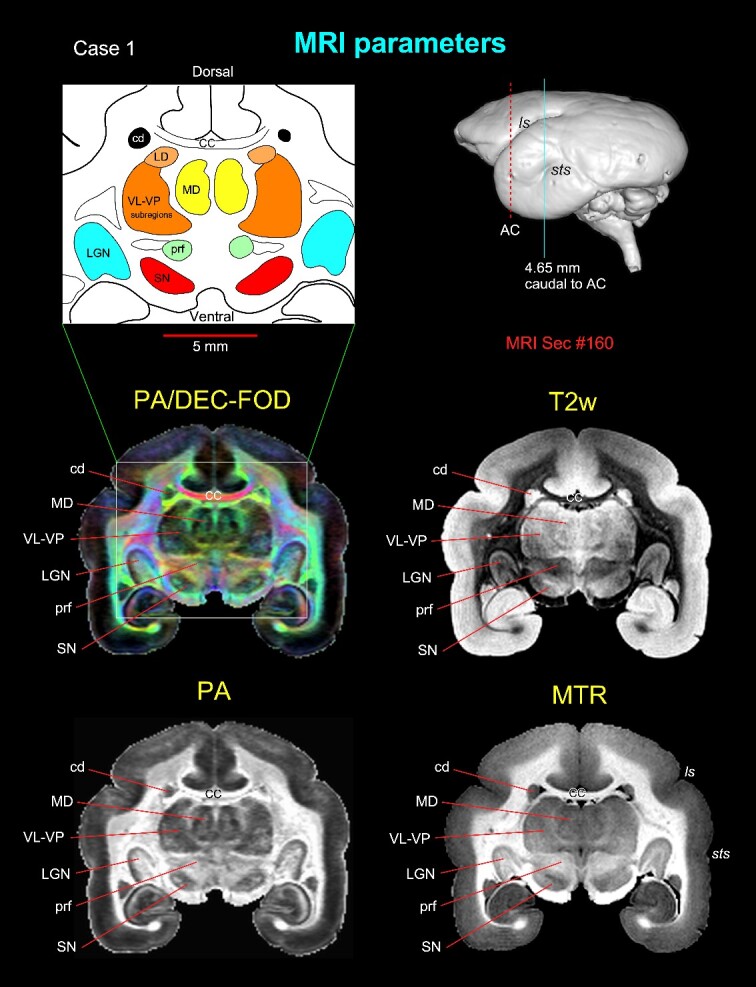
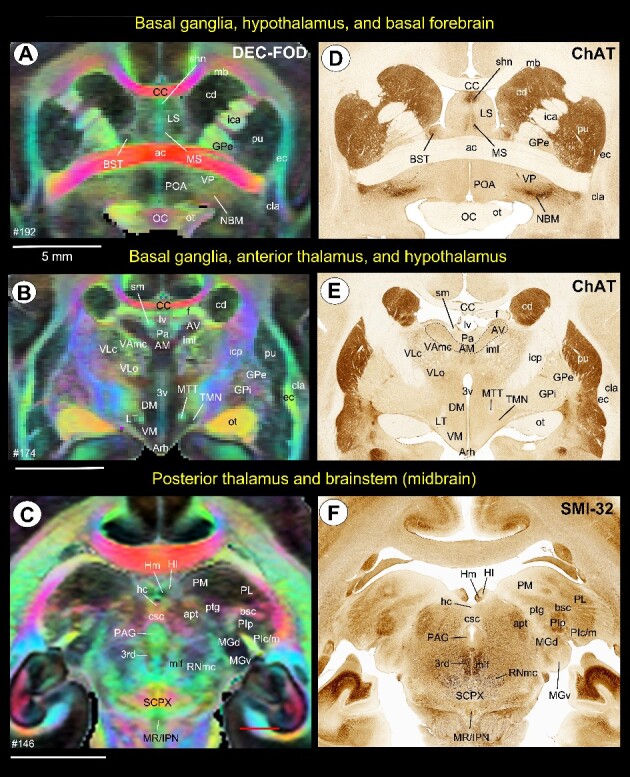
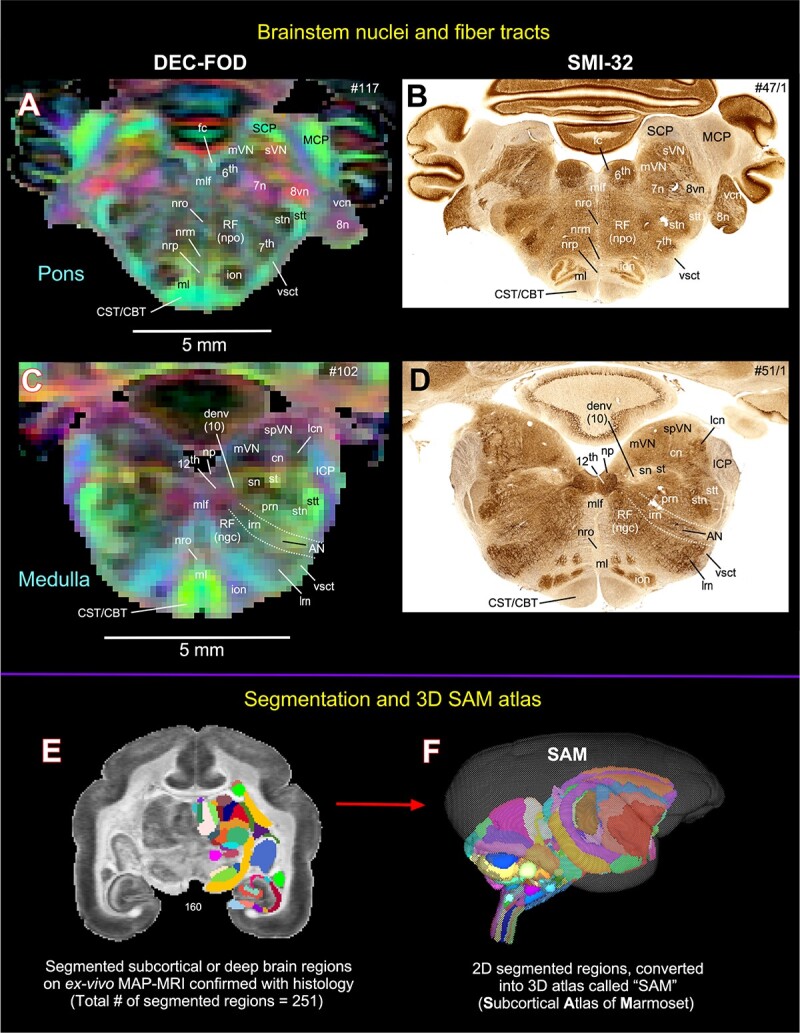
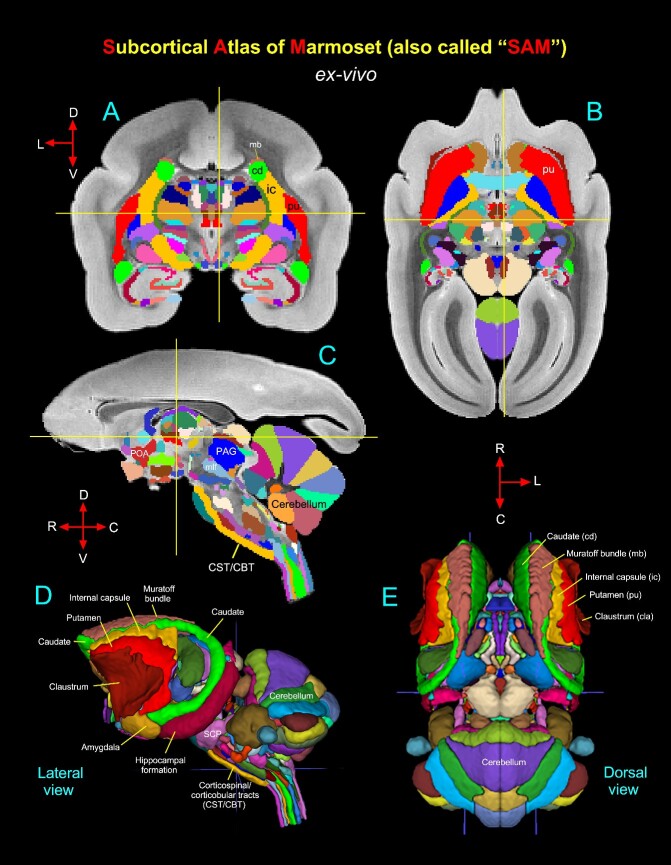
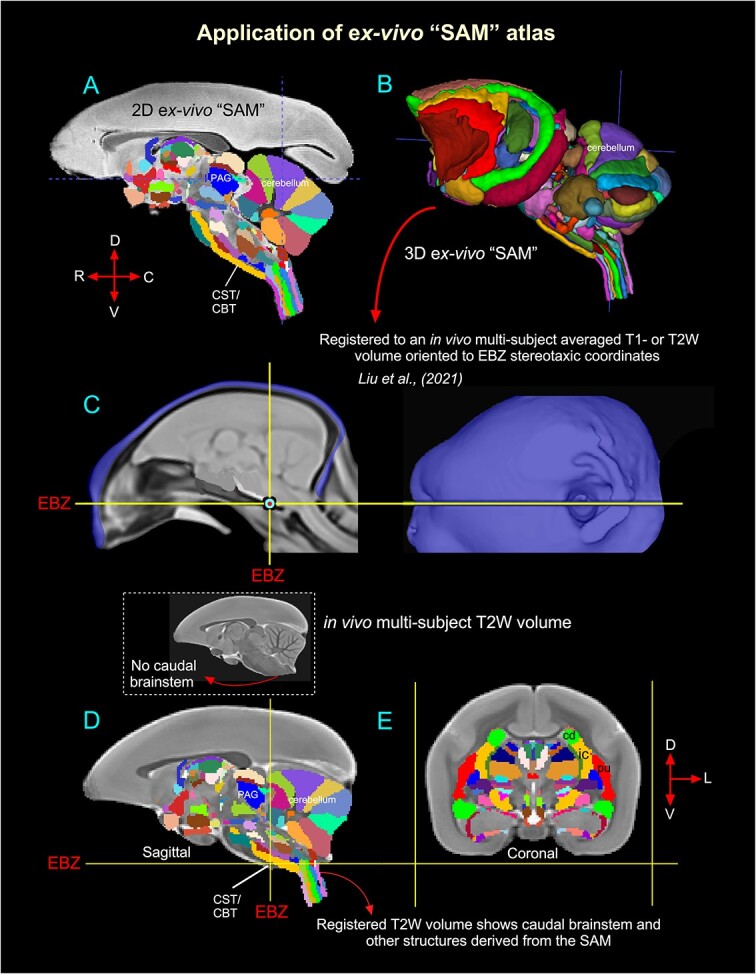
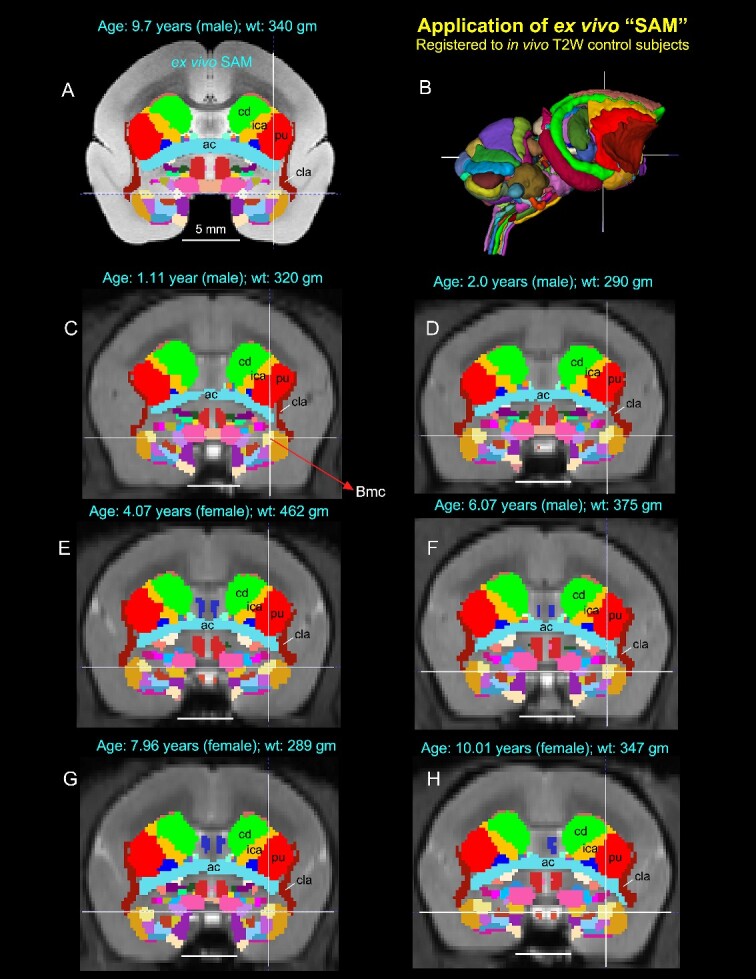
A comprehensive three-dimensional digital brain atlas of cortical and subcortical regions based on MRI and histology has a broad array of applications in anatomical, functional, and clinical studies. We first generated a Subcortical Atlas of the Marmoset, called the "SAM," from 251 delineated subcortical regions (e.g. thalamic subregions, etc.) derived from high-resolution Mean Apparent Propagator-MRI, T2W, and magnetization transfer ratio images ex vivo. We then confirmed the location and borders of these segmented regions in the MRI data using matched histological sections with multiple stains obtained from the same specimen. Finally, we estimated and confirmed the atlas-based areal boundaries of subcortical regions by registering this ex vivo atlas template to in vivo T1- or T2W MRI datasets of different age groups (single vs. multisubject population-based marmoset control adults) using a novel pipeline developed within Analysis of Functional NeuroImages software. Tracing and validating these important deep brain structures in 3D will improve neurosurgical planning, anatomical tract tracer injections, navigation of deep brain stimulation probes, functional MRI and brain connectivity studies, and our understanding of brain structure-function relationships. This new ex vivo template and atlas are available as volumes in standard NIFTI and GIFTI file formats and are intended for use as a reference standard for marmoset brain research.

Keywords: MAP-MRI; SAM; histology; marmoset monkey; subcortical atlas.


Figures

Fig. 1
Fig. 1
Histological staining and high-resolution imaging. Frozen sections were cut coronally from the frontal cortex to the occipital cortex at 50 μm thickness on a sliding microtome. In total, 670 sections were collected, and all sections were processed with different cell bodies and fiber stains. This example shows an adjacent series of 5 sections at the level of the anterior temporal cortex stained with PV, SMI-32, AchE, CV, and ChAT. The unique characteristics of each stain are described in the “Histological markers” in Results section. We obtained 134 stained sections in each series, and the interval between 2 adjacent sections in each series is 250 μm. High-resolution images of stained sections were captured using a Zeiss wide-field microscope and a Zeiss Axioscan Z1 high-resolution slide scanner (inset). These histological images were then aligned manually with the corresponding MAP-MRI (top) and other MRI parameters of the same specimen to allow visualization and delineation of subcortical structures in a specific ROI. In both MRI and histology sections, note the correspondence of sulci (“stars” on the top right), gyri, and deep brain structures (e.g. LGN). #65 refers to the section number in each set/series of stained sections, and #158 indicates the matched MRI slice number in 3D volume. The inset shows the 3D brain mold with and without the brain specimen for MRI.
Fig. 2
Fig. 2
Subcortical regions with different MRI parameters. Matched coronal MR images from 2 of the 8 MAP-MRI parameters, T2-weighted (T2W), and MTR images show selected subcortical regions: thalamic subregions (MD, LD, VL, VP, LGN), basal ganglia subregions (SN, cd), and a prerubral region (prf) anterior to the red nucleus. These areas are also illustrated in the corresponding drawing from the PA/DEC-FOD image on the top left (white box/inset). For mapping and a detailed description of the thalamic and other subcortical regions and other MAP-MRI parameters, see the Results section in Saleem et al. (2023). This MRI slice is located at the level of the rostral temporal cortex and 4.65 mm caudal to the AC, as illustrated by a blue vertical line on the lateral view of the 3D rendered brain image from this case. Note that the contrast between these subcortical areas is distinct in different MRI parameters. Abbreviations: CC, corpus callosum; cd, caudate nucleus; LD, lateral dorsal nucleus; LGN, lateral geniculate nucleus; MD, medial dorsal thalamic nuclei; prf, prerubral field; SN, substantia nigra; subregions of VL, ventral lateral and VP, ventral posterior nuclei. Sulci: ls, lateral sulcus; sts, superior temporal sulcus.
Fig. 3
Fig. 3
Subcortical areas for the 3D atlas (SAM). (A–F) Examples showing the basal ganglia, thalamus, hypothalamus, basal forebrain, and brainstem that are identified and segmented on the MAP-MRI (DEC-FOD) with reference to matched histological sections stained with ChAT and SMI-32, and other stained sections (not shown here). Abbreviations: 3rd, third cranial (oculomotor) nuclei; 3v, 3rd ventricle; ac, anterior commissure; AM, anterior medial nucleus; apt, anterior pretectal nucleus; Arh, arcuate hypothalamic nucleus; AV, anterior ventral nucleus; bsc, brachium of superior colliculus; BST, bed nucleus of stria terminals; CC, corpus callosum; cd, caudate nucleus; cla, claustrum; csc, commissure of superior colliculus; DM, dorsomedial hypothalamic area; ec, external capsule; f, fornix; GPe, globus pallidus, external segment; GPi, globus pallidus, internal segment; hc, habenular commissure; Hl, lateral habenular nucleus; Hm, medial habenular nucleus; ica, internal capsule, anterior limb; icp, internal capsule, posterior limb; iml, internal medullary lamina; IPN, interpeduncular nucleus; LS, lateral septum; LT, lateral hypothalamic area; lv, lateral ventricle; mb, Muratoff bundle; MGd, medial geniculate nucleus, dorsal division; MGv, medial geniculate nucleus, ventral division; mlf, medial longitudinal fasciculus; MR, median raphe; MS, medial septum; MTT, mammillothalamic tract; NBM, nucleus basalis of Myenert; oc, optic chiasm; ot, optic tract; Pa, paraventricular nucleus; PAG, periaqueductal gray; PIc, inferior pulvinar, caudal division; PIm, inferior pulvinar, medial division; PIp, inferior pulvinar, posterior division; PL, lateral pulvinar; PM, medial pulvinar; POA, preoptic area; ptg, posterior thalamic group; pu, putamen; RNmc, red nucleus, magnocellular division; SCPX, superior cerebellar peduncle decussation; shn, septo-hippocampal nucleus; Sm, stria medullaris; TMN, tuberomammillary nucleus; VAmc, ventral anterior nucleus, magnocellular division; VLc, ventral lateral caudal nucleus; VLo, ventral lateral oral nucleus; VM, ventromedial hypothalamic area; VP, ventral pallidum. Scale bars: 5 mm applies to A–F.
Fig. 4
Fig. 4
Subcortical areas for the 3D atlas (SAM). (A–D) More examples show the subcortical areas at the brainstem level (pons and medulla) that are identified and segmented on MAP-MRI (DEC-FOD) with reference to matched histological sections stained with SMI-32, and other stained sections (not shown here). Abbreviations: 6th, abducent nuclei; 7th, facial nuclei; 7n, facial nerve; 8n, vestibulocochlear nerve; 8vn, vestibular nerve; 12th, hypoglossal nucleus; AN, ambiguous nucleus; CBT, corticobulbar tract; cn, cuneate nucleus; CST, corticospinal tract; denv (10), dorsal motor nucleus of vagus; fc, facial colliculus; ICP, inferior cerebellar peduncle; ion, inferior olivary nucleus; irn, intermediate reticular nucleus; lcn, lateral cuneate nucleus; lrn, lateral reticular nucleus; MCP, middle cerebellar peduncle; ml, medial lemniscus; mlf, medial longitudinal fasciculus; mVN, medial vestibular nucleus; np, nucleus prepositus; nrm, nucleus raphe magnus; nro, nucleus raphe obscurus; nrp, nucleus raphe pallidus; prn, parvicelluar reticular nucleus; RF (ngc), reticular formation, nucleus gigantocellularis; RF (npo), reticular formation, nucleus pontis centralis oralis; SCP, superior cerebellar peduncle; sn, solitary nucleus; spVN, spinal vestibular nucleus; st, solitary tract; stn, spinal trigeminal nucleus; stt, spinal trigeminal tract; sVN, superior vestibular nucleus; vcn, ventral cochlear nucleus; vsct, ventral spinocerebellar tract. Subcortical segmentation and 3D ex vivo digital template atlas. (E) Two hundred and fifty-one deep brain regions, including the HF and cerebellum, were manually segmented through a series of 150 μm thick MAP-MRI sections using ITK-SNAP. (F) A 3D isosurface rendering of the individual regions within a volume rendering of the T2W dataset. This new MRI-histology-based segmented volume (called ex vivo “SAM”) is registered to an in vivo multi-subject population-based T1W MRI volume oriented to the EBZ stereotaxic coordinate system (Liu et al. 2021) or a range of in vivo T2W MRI volumes of marmoset monkeys with different age groups and genders. For more details, see Figs 6 and 7.
Fig. 5
Fig. 5
Symmetric ex vivo SAM atlas and template. (A–C) The “SAM” digital atlas overlaid on the coronal, horizontal, and sagittal ex-vivo T2W MRI templates, respectively. The crosshairs in A–C show the location of the midline thalamic subregion clc (central latocellular nucleus). (D–E) The spatial location of the segmented subcortical regions is shown on the lateral and dorsal views in 3D. The selected subcortical regions in (D–E) are also indicated in (A–C). Abbreviations: CBT, corticobulbar tract; CST, corticospinal tract; mlf, medial longitudinal fasciculus; PAG, periaqueductal gray; POA, preoptic area; SCP, superior cerebellar peduncle. Orientation: D, dorsal; V, ventral; R, rostral; C, caudal; L, lateral.
Fig. 6
Fig. 6
Validation of the ex vivo “SAM” digital template atlas. Two hundred and fifty-one deep brain regions, including the HF and cerebellum, were manually segmented through a series of 150 μm thick MAP-MRI or T2W images (A) using ITK-SNAP and the spatial location of these regions was derived in 3D (B). This new MRI-histology-based segmented volume (called “SAM”) is registered to an in vivo multisubject averaged or population-based T1- or T2W MRI volume (also called MBM template) oriented to EBZ stereotaxic coordinates (Liu et al. 2021) (C). The images in C were obtained and used with permission from the author Cirong Liu (slightly modified for this figure). The illustrations in D–E indicate the registered subcortical areas in the control subject (T2W). None of the registered regions in D and E were altered or adjusted. Note that this control brain specimen (T2W volume) lacks the caudal brainstem (inset with an arrow in D), but after registration with the SAM template, this volume (D) includes the caudal brainstem areas. Abbreviations: CBT, corticobulbar tract; cd, caudate nucleus; CST, corticospinal tract; EBZ, ear bar zero; ic, internal capsule; PAG, periaqueductal gray; pu, putamen. Orientation: D, dorsal; V, ventral; R, rostral; C, caudal; L, lateral.
Fig. 7
Fig. 7
Application of 3D atlas in control subjects. Registration of the SAM digital atlas (B) to various in vivo T2W test subjects of different age groups, genders, and weights using a novel processing pipeline developed within AFNI (see the Method section). (A) Mid-coronal section from the SAM atlas with delineated subcortical regions. (C–H) Coronal slices from 6 control animals, with the SAM atlas registered to the T2W MRI volume of each animal in its native space. None of the registered regions were altered or adjusted in these animals. Note that the corresponding location of the deep brain regions in the control subjects (e.g. ac, anterior commissure; Bmc, basal nucleus of the amygdala, magnocellular division, indicated by cross-hair; cd, caudate; cla, claustrum; ica, anterior limb of the internal capsule; pu, putamen) closely matched with the SAM (A). The MRI volumes of these 6 control subjects were obtained from a publicly shared multimodal brain MRI database covering marmosets with a wide age range (Hata et al. 2023). Scale bars in A–H = 5 mm.

Update of

References

    1. Abosch A, Yacoub E, Ugurbil K, Harel N. An assessment of current brain targets for deep brain stimulation surgery with susceptibility-weighted imaging at 7 tesla. Neurosurgery. 2010:67:1745–1756 discussion 1756. - PMC - PubMed
    1. Aggleton JP, O'Mara SM. The anterior thalamic nuclei: core components of a tripartite episodic memory system. Nat Rev Neurosci. 2022:23(8):505–516. 10.1038/s41583-022-00591-8. - DOI - PubMed
    1. Amaral DG, Bassett JL. Cholinergic innervation of the monkey amygdala: an immunohistochemical analysis with antisera to choline acetyltransferase. J Comp Neurol. 1989:281:337–361. - PubMed
    1. Araujo Gois Morais PL, Garcia-Amado M, Lima RRM, Cordoba-Claros A, Souza Cavalcante J, Clasca F, NascimentoES Jr. Cyto- and myelo-architecture of the amygdaloid complex of the common marmoset monkey (Callithrix jacchus). Front Neuroanat. 2019:13:36. - PMC - PubMed
    1. Avram AV, Guidon A, Song AW. Myelin water weighted diffusion tensor imaging. NeuroImage. 2010:53:132–138. - PubMed

Publication types