. 2024 Apr;28(8):e18341.
doi: 10.1111/jcmm.18341.

Single-cell analysis revealed a potential role of T-cell exhaustion in colorectal cancer with liver metastasis

Affiliations

Single-cell analysis revealed a potential role of T-cell exhaustion in colorectal cancer with liver metastasis

Tianlong Ling et al. J Cell Mol Med. 2024 Apr.

Abstract

Liver metastasis (LM) is an important factor leading to colorectal cancer (CRC) mortality. However, the effect of T-cell exhaustion on LM in CRC is unclear. Single-cell sequencing data derived from the Gene Expression Omnibus database. Data were normalized using the Seurat package and subsequently clustered and annotated into different cell clusters. The differentiation trajectories of epithelial cells and T cells were characterized based on pseudo-time analysis. Single-sample gene set enrichment analysis (ssGSEA) was used to calculate enrichment scores for different cell clusters and to identify enriched biological pathways. Finally, cell communication analysis was performed. Nine cell subpopulations were identified from CRC samples with LM. The proportion of T cells increased in LM. T cells can be subdivided into NK/T cells, regulatory T cells (Treg) and exhausted T cells (Tex). In LM, cell adhesion and proliferation activity of Tex were promoted. Epithelial cells can be categorized into six subpopulations. The transformation of primary CRC into LM involved two evolutionary branches of Tex cells. Epithelial cells two were at the beginning of the trajectory in CRC but at the end of the trajectory in CRC with LM. The receptor ligands CEACAM5 and ADGRE5-CD55 played critical roles in the interactions between Tex and Treg cell-epithelial cell, which may promote the epithelial-mesenchymal transition process in CRC. Tex cells are able to promote the process of LM in CRC, which in turn promotes tumour development. This provides a new perspective on the treatment and diagnosis of CRC.

Keywords: exhausted T cells; liver metastasis; primary colorectal cancer; regulatory T cells; single‐cell sequencing.


Conflict of interest statement

The authors declare that they have no conflicts of interest regarding this manuscript.

Figures

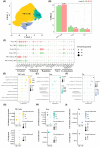
FIGURE 1
FIGURE 1
Cell types in primary colorectal cancer (CRC) and CRC liver metastatic tumour samples. (A) Nine cell subpopulations in primary CRC and CRC liver metastatic tumour samples. (B) Bubble diagram showing the highly expressed marker genes in the nine cell subpopulations. (C) Violin plot demonstrating highly expressed marker genes in nine cell subpopulations. (D) The proportion of nine cell subpopulations in primary CRC and liver metastasis (LM) samples.
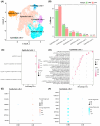
FIGURE 2
FIGURE 2
Landscape of T‐cells subpopulations in primary colorectal cancer (CRC) and liver metastasis (LM) tumour samples. (A) Three subpopulations in T cells, NK/T cells, Treg, and Tex. (B) The proportion of NK/T cells, Treg, and Tex in primary CRC and LM tumour samples. (C) The expression levels of cytotoxic factor, exhausted factor, regulation factor, naïve factor, and co‐stimulatory factor. (D) GO biological process involved in NK/T cells. (E) GO biological process involved in Treg. (F) GO biological process involved in Tex. (G) The expression levels of cell adhesion and apotosis‐related genes and cell proliferation‐related genes in NK/T cells. (H) The expression levels of cell adhesion and apotosis‐related genes and cproliferation‐related genes in Treg. (I) The expression levels of cell adhesion and profileraion‐related genes and cell migration‐related genes in Tex.
FIGURE 3
FIGURE 3
The subpopulations of epithelial cells in primary colorectal cancer (CRC) and liver metastasis (LM) tumour samples. (A) Six subpopulations in epithelial cells. (B) Proportion of the six subpopulations in primary CRC and LM tumour samples. (C) GO biological processes involved in epithelial cells 1. (D) GO biological process involved in epithelial cells 2. (E) The expression levels of protein metabolic activity‐related genes and transporter‐related genes. (F) The expression levels of epithelial cell igration‐related genes, epithelial mesenchymal transition‐related genes.
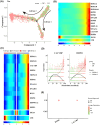
FIGURE 4
FIGURE 4
Pseudo‐time analysis for Tex cells. (A) Pseudo‐time differentiation trajectory of Tex cells. (B) Heatmap of the expression of tumour development‐related genes in the pseudo‐time trajectory of Tex cells. (C) Expression heatmap of tumour development‐related genes in cell fate 1 and cell fate 2 in the pseudo‐time trajectory of Tex cells. (D) Expression changes of CACYBP and HSPB1 in cell fate 1 and cell fate 2 with pseudo‐time progression. (E) Expression levels of CACYBP and HSPB1 in primary colorectal cancer (CRC) and liver metastasis (LM) samples.
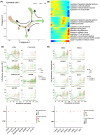
FIGURE 5
FIGURE 5
Pseudo‐time analysis for epithelial cells 2. (A) Pseudo‐time differentiation trajectory for epithelial cells 2. (B) Heatmap of tumour progression‐associated GO terms in the pseudo‐time trajectory for Epithelial cells 2. (C) Expression changes of genes related to cell adhesion, migration and mesenchymal transition with pseudo‐time progression in FATE 1 and FATE 2, different samples. (D) The expression changes of cell proliferation, differentiation‐related genes in the FATE 1 and FATE 2, different samples, with pseudo‐time progression.
FIGURE 6
FIGURE 6
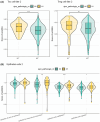
Functions involved in epithelial cells 2 and Tex cell fate 2. (A) Single‐sample gene set enrichment analysis (ssGSEA) enrichment scores for Tex cell fate 2 and Treg cell fate 2. (B) The ssGSEA enrichment score of Epithelial cells 2 in tumour metastasis‐related signalling pathways.
FIGURE 7
FIGURE 7
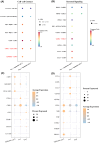
Epithelial cells 2 and Tex cell fate 2 cells exchange information. (A) Receptor‐ligand pairs in cell–cell contact, Tex and Treg in cell–cell contact with epithelial cells 2. (B) Secreted signalling, receptor‐ligand pairs for cell–cell contact of Tex and Treg with epithelial cells 2. (C) The expression of receptor‐ligand pairs for cell–cell contact of Tex and Treg with epithelial cells 2 in single‐cell data. (D) The expression of receptor‐ligand pairs of Tex and Treg for secreted signalling with epithelial cells 2 in single‐cell data.

References

    1. Sung H, Ferlay J, Siegel RL, et al. Global cancer statistics 2020: GLOBOCAN estimates of incidence and mortality worldwide for 36 cancers in 185 countries. CA Cancer J Clin. 2021;71(3):209‐249. - PubMed
    1. Xia C, Dong X, Li H, et al. Cancer statistics in China and United States, 2022: profiles, trends, and determinants. Chin Med J. 2022;135(5):584‐590. - PMC - PubMed
    1. Ma S, Zhu X, Xin C, et al. RCN3 expression indicates prognosis in colorectal cancers. Oncologie. 2022;24(4):823‐833.
    1. Weng J, Li S, Zhu Z, et al. Exploring immunotherapy in colorectal cancer. J Hematol Oncol. 2022;15(1):95. - PMC - PubMed
    1. Kalbasi A, Ribas A. Tumour‐intrinsic resistance to immune checkpoint blockade. Nat Rev Immunol. 2020;20(1):25‐39. - PMC - PubMed

Publication types

MeSH terms