. 2024 Apr;28(8):e18282.
doi: 10.1111/jcmm.18282.

Development of m6A/m5C/m1A regulated lncRNA signature for prognostic prediction, personalized immune intervention and drug selection in LUAD

Affiliations

Development of m6A/m5C/m1A regulated lncRNA signature for prognostic prediction, personalized immune intervention and drug selection in LUAD

Chao Ma et al. J Cell Mol Med. 2024 Apr.

Abstract

Research indicates that there are links between m6A, m5C and m1A modifications and the development of different types of tumours. However, it is not yet clear if these modifications are involved in the prognosis of LUAD. The TCGA-LUAD dataset was used as for signature training, while the validation cohort was created by amalgamating publicly accessible GEO datasets including GSE29013, GSE30219, GSE31210, GSE37745 and GSE50081. The study focused on 33 genes that are regulated by m6A, m5C or m1A (mRG), which were used to form mRGs clusters and clusters of mRG differentially expressed genes clusters (mRG-DEG clusters). Our subsequent LASSO regression analysis trained the signature of m6A/m5C/m1A-related lncRNA (mRLncSig) using lncRNAs that exhibited differential expression among mRG-DEG clusters and had prognostic value. The model's accuracy underwent validation via Kaplan-Meier analysis, Cox regression, ROC analysis, tAUC evaluation, PCA examination and nomogram predictor validation. In evaluating the immunotherapeutic potential of the signature, we employed multiple bioinformatics algorithms and concepts through various analyses. These included seven newly developed immunoinformatic algorithms, as well as evaluations of TMB, TIDE and immune checkpoints. Additionally, we identified and validated promising agents that target the high-risk mRLncSig in LUAD. To validate the real-world expression pattern of mRLncSig, real-time PCR was carried out on human LUAD tissues. The signature's ability to perform in pan-cancer settings was also evaluated. The study created a 10-lncRNA signature, mRLncSig, which was validated to have prognostic power in the validation cohort. Real-time PCR was applied to verify the actual manifestation of each gene in the signature in the real world. Our immunotherapy analysis revealed an association between mRLncSig and immune status. mRLncSig was found to be closely linked to several checkpoints, such as IL10, IL2, CD40LG, SELP, BTLA and CD28, which could be appropriate immunotherapy targets for LUAD. Among the high-risk patients, our study identified 12 candidate drugs and verified gemcitabine as the most significant one that could target our signature and be effective in treating LUAD. Additionally, we discovered that some of the lncRNAs in mRLncSig could play a crucial role in certain cancer types, and thus, may require further attention in future studies. According to the findings of this study, the use of mRLncSig has the potential to aid in forecasting the prognosis of LUAD and could serve as a potential target for immunotherapy. Moreover, our signature may assist in identifying targets and therapeutic agents more effectively.

Keywords: drug prediction; immunotherapy; lncRNA signature; lung adenocarcinoma; m6A/m5C/m1A; prognosis.


Conflict of interest statement

The authors declare no competing interests.

Figures

FIGURE 1
FIGURE 1
Research design and analysis process. AUC, area under the ROC curve; FP, false positive rate; HR, hazard ratio; lncRNA, long non‐coding RNA; LUAD, lung adenocarcinoma; mRLncSig, m6A/m5C/m1A‐regulated lncRNA signature; PC, principal component; ROC, receiver operating characteristic; TCGA, The Cancer Genome Atlas; TP, true positive rate.
FIGURE 2
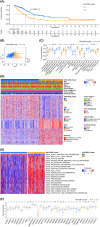
FIGURE 2
Batch effect removal of the validation cohort and mRG cluster establishment. (A) Comparison of UMAP plots before and after batch effect removal for the validation cohort. (B) Survival differences among different mRG clusters were assessed using KM curves. (C) The scatterplot generated from the principal component analysis indicates the degree of heterogeneity between the clusters, revealing a distinct segregation of the two clusters. (D) Bioinformatics algorithms were utilized to visualize the distribution of immune cells within two mRG clusters. (E) Displayed in the heatmap are the distribution patterns of 33 mRGs across mRG clusters, along with clinical parameter distribution within the clusters. The clinical parameters are represented in the upper portion while the lower part shows each gene represented as a row and each sample as a column. (F) KEGG analysis performed using GSVA to visualize pathways dominating in different clusters. Only the most significant pathways are plotted. DEGs, differentially expressed genes; GSVA, Gene set variation analysis; KEGG, Kyoto Encyclopedia of Genes and Genomes; KM, Kaplan–Meier estimator; mRG, m6A/m5C/m1A‐regulated gene; UMAP, uniform manifold approximation and projection; we considered a p‐value of less than 0.05 as statistically significant. The notation *, ** and *** indicate p‐values of <0.05, <0.01 and <0.001, respectively.
FIGURE 3
FIGURE 3
Establishment of mRG‐DEG clusters. (A) Survival predictions of different mRG‐DEG clusters were visualized by KM. (B) The relationship between different clusters can be visualized through principal component analysis. By observing the clustering of scattered points within each of the three clusters, it becomes evident that there is significant heterogeneity among them. (C) The distribution of immune cells across mRG‐DEG clusters was visualized through ssGSEA analysis. The results of this analysis revealed disparities in the distribution of 14 distinct types of immune cells. (D) The expression distribution of 256 mRG‐DEGs in various mRG‐DEG clusters, along with the clinical parameter distribution in those clusters, is depicted in the heatmap. The top section displays the clinical parameter distribution, while each row in the bottom section represents a gene and each column represents a sample. (E) The differential KEGG pathways of two mRG‐DEG clusters are compared visually using GSVA. The plot highlights the most significant pathways. (F) The distribution of the 33 mRGs in the mRG‐DEG cluster is presented through boxplots, with asterisks indicating significant differences. DEGs, differentially expressed genes; GSVA, gene set variation analysis; KEGG, Kyoto Encyclopedia of Genes and Genomes; KM, Kaplan–Meier estimator; mRG, m6A/m5C/m1A‐regulated gene; statistical significance was considered at a p‐value < 0.05, with ‘ns’ indicating not significant, ‘*’ indicating p‐value < 0.05, ‘**’ indicating p‐value < 0.01 and ‘***’ indicating p‐value < 0.001.
FIGURE 4
FIGURE 4
LASSO regression model built the signature mRLncSig. (A) This figure shows how the LASSO algorithm simplifies the data by reducing the number of important features (prognostic lncRNAs) needed to analyse cancer risk. It displays the strength of association (LASSO coefficient) between each lncRNA and the risk score. (B) The plot illustrates the LASSO regression process employing 10‐fold cross‐validation and minimal Lambda to identify 10 prognostic lncRNAs. (C) The relationship between mRG clusters, mRG‐DEG clusters, risks and vital status in general is illustrated by the Sankey diagram. The diagram reveals that a notable portion of the A cluster in mRG‐DEG display low‐risk scores, while most of its B cluster exhibit high‐risk scores. (D) The box plots demonstrate distinct statistical variations in the distributions of risk scores across the two mRG‐DEG cluster. (E) Box plots display expression pattern of the 33 mRGs in the high‐ and low‐risk groups. DEGs, differentially expressed genes; FDR, false discovery rate; KM, Kaplan–Meier estimator; LASSO, least absolute shrinkage and selection operator; mRG, m6A/m5C/m1A‐regulated gene; mRLncSig, m6A/m5C/m1A‐regulated lncRNA signature; statistical significance was determined if the p‐value was less than 0.05. Symbols were used to indicate varying levels of significance: * for p‐values < 0.05, ** for p‐values < 0.01 and *** for p‐values < 0.001.
FIGURE 5
FIGURE 5
Validation of the prognostic model mRLncSig in an independent research cohort. (A) The KM curve illustrates the variation in overall survival rates of the groups categorized as high and low risk. It was generated by utilizing the information from the training and validation cohorts, and the groups were differentiated using a median risk score. (B) The KM curve illustrates the variation in survival rates (PFI, DFI and DSS) of the groups categorized as high and low risk. It was generated by utilizing the information from the training cohort, and the groups were differentiated using a median risk score. (C) The Cox proportional hazards models determined the clinical prognostic ability, or independent predictive value, of the risk score and various clinical factors. The following variables were compared in the Cox proportional hazards models using the following methods: gender (male vs. female), race (white vs. non‐white), ethnicity (Hispanic or Latino vs. non‐Hispanic or Latino), prior malignancy (yes vs. no), tumour origin (upper lobe lung vs. non‐upper lobe lung) and smoking history (ever vs. never). (D) The accuracy of the risk score in predicting LUAD outcome at 1, 3 and 5 years is demonstrated by ROC curves. These curves are established using the data from both the training and validation cohorts. (E) By displaying continuous AUC comparisons between the risk score and other clinical factors, the tAUC curve provides insight into the accuracy of outcome predictions. Higher AUC values indicate greater accuracy. The clinical factors included in this analysis are those that demonstrated significant value in the multivariate Cox analysis. (F) The discriminative power of risk scores for cohort populations is illustrated by PCA scatterplots, which utilize data from both the training and validation cohorts. (G) A nomogram was created to potentially aid in clinical assessment of patient prognosis. The model comprises several clinical parameters, including age, grade, tumour stage and risk score. A p‐value below 0.05 was deemed statistically significant, with asterisks denoting levels of significance (* for p < 0.05 and *** for p < 0.001). (H) A calibration curve was constructed to assess the precision of the nomogram, and the depicted evaluation outcomes validated the predictive accuracy of the nomogram. (I) The correlations between mRLncSig and the enrichment scores of immunotherapy‐predicted pathways. (J) The correlations between mRLncSig and the oncogenic signature gene sets. AUC, area under the ROC curve; DFI, disease‐free interval; DSS, disease‐specific survival; H95%, 95% confidence interval higher; HR, hazard ratio; KM, Kaplan–Meier; L95%, 95% confidence interval lower; LUAD, lung adenocarcinoma; mRLncSig, m6A/m5C/m1A‐regulated lncRNA signature; OS, overall survival; PCA, principal component analysis; PFI, progression‐free interval; RL, risk level; ROC, receiver operating characteristic; SP, survival probability; tAUC, time‐dependent AUC; TCGA, The Cancer Genome Atlas.
FIGURE 6
FIGURE 6
Comprehensive investigations aimed at revealing the relationship between mRLncSig and LUAD tumour microenvironment status, immune cell infiltration and immune function. (A–C) On the left, the boxplots display the distributions of the immune score, stromal score and ESTIMATE score in both the high and low score groups of patients. On the right, the scatterplots illustrate the correlations of the scores with our model signature. (D) The heatmap exhibits the distribution of seven immune cell types in distinct high and low mRLncSig score groups. The relative infiltration of these immune cells was obtained by analysing the data of the training cohort using the ‘IOBR’ R language package. Only the immune cells with significant distribution are displayed. (E) The visualization displays Lollipop plots showcasing the correlation between mRLncSig scores and relative infiltration levels of seven immune cell types, using the Pearson coefficient as the correlation algorithm. Only the immune cells that are deemed significant are presented in the plot. (F) We combined the results of our difference and correlation analyses and visualized them using a Venn diagram and a word cloud. According to the results obtained from the intersection, our model had the highest correlation with immune cell types such as CD4 T cell, memory B cell, resting T cell, myeloid dendritic cell and CD8 T cell. (G) An asterisk indicates significant differences in the violin plot, which displays relative immune function scores distribution between high‐ and low‐risk score populations. mRLncSig, m6A/m5C/m1A‐regulated lncRNA signature; a statistically significant value was considered when p‐value < 0.05, while values with p‐value > 0.05 were not considered significant and represented as ‘ns’. Besides, * was used to indicate p‐values < 0.05, ** for p‐values < 0.01, *** for p‐values < 0.001 and **** for p‐values < 0.0001.
FIGURE 7
FIGURE 7
Identifying the relationship between the mRLncSig and immunotherapy. (A) A plot depicting the mutational landscape of the 20 most frequently mutated genes in LUAD is displayed in a waterfall format. The chart also illustrates the distribution of mutational disparities between high‐ and low‐risk groups. (B, C) The left‐side box plots in the panel indicate the variation in the distribution of TMB and TIDE between high‐risk and low‐risk patients. The Wilcoxon test was used to verify the difference. The right side of the figure represents the correlation of TMB and TIDE with the mRLncSig model, and the detection of correlation was based on the Pearson coefficient. (D) Lollipop plots were utilized to depict the correlations between the scores of the mRLncSig model and immune checkpoints. The Pearson coefficient was used to detect correlations, and only immune checkpoints that showed significant associations were included in the plot. (E) The distribution of the relative expression of immune checkpoint genes among high‐ and low‐risk patients were displayed using violin plots. The significance of the distribution was determined using the Wilcoxon rank‐sum test, and only immune checkpoints with significant distributions were included in the plot. (F) KM curves were generated to assess the prognostic significance of the immune checkpoint genes. Eight genes were found to have significant prognostic value. (G) The Cox proportional hazards model was employed to scrutinize all the checkpoint genes and single out those that possess prognostic significance. Our results exhibit only the indicators that were deemed statistically significant, and a total of 15 checkpoints were identified with prognostic power. (H) A Venn diagram was constructed to display the intersection of the outcomes obtained from correlation analysis, difference analysis, KM analysis and Cox analysis. (I) To visualize the impact of six checkpoint genes in immunotherapy, a heatmap was generated utilizing data from various published online datasets. mRLncSig, m6A/m5C/m1A‐regulated lncRNA signature; TIDE, Tumour Immune Dysfunction and Exclusion; TMB, Tumour mutational burden; a p‐value less than 0.05 was deemed to be statistically significant; results with a p‐value greater than or equal to 0.05 were considered non‐significant and denoted by ‘ns’; asterisks were used to indicate the level of significance: one asterisk (*) for p‐values < 0.05, two asterisks (**) for p‐values < 0.01, three asterisks (***) for p‐values < 0.001 and four asterisks (****) for p‐values < 0.0001.
FIGURE 8
FIGURE 8
Identification of drugs with therapeutic potential for patients with high‐risk scores based on multiple datasets. (A) The plot illustrates the databases utilized in our drug prediction study, namely CTRP and PRISM, through a Venn diagram. It depicts the number of compounds present in each database. (B) The general concept of our drug prediction study is demonstrated through a flowchart. We employed the Wilcoxon rank‐sum test and Spearman rank correlation based on the CTRP and PRISM databases, respectively, to identify potential drugs for treating high‐risk score populations. (C) The CTRP database yielded six compounds, with their respective Spearman correlation analysis results on the left and drug response AUC difference analysis results on the right. (D) The PRISM database identified six compounds, with the corresponding Spearman correlation analysis results displayed on the left and drug response AUC difference analysis results on the right. (E) The therapeutic potential of candidate drugs from CTRP and PRISM databases was assessed through CMap score, literature review and clinical trial evidence. The drugs obtained from the CTRP database are shown on the left, while those obtained from PRISM are on the right; a p‐value < 0.05 was deemed to be statistically significant; a p‐value < 0.001 was denoted by ‘***’.
FIGURE 9
FIGURE 9
Comparison of previous signatures, , , , , , with mRLncSig by performing Cox regression analysis for overall, disease‐specific and progression‐free survival using three formats of official TCGA data. mRLncSig, m6A/m5C/m1A‐regulated lncRNA signature.
FIGURE 10
FIGURE 10
Real‐time PCR identifying the mRLncSig lncRNAs expression patterns and multi analyses assessing their potential in pan‐cancer. (A) The expression levels of mRLncSig lncRNAs in the normal lung (n = 9) and LUAD (n = 9) tissues were visualized using box plots. Real‐time PCR was employed for detecting the expression levels. The statistical analysis was conducted using Student's t‐test. (B) A heatmap was constructed to depict the differential expression ability of mRLncSig lncRNAs in tumour and normal tissues. The ‘pan‐cancer TCGA TARGET GTEx’ database was used for the heatmap, where each column represented a cancer type, and each row represented a lncRNA. The ‘limma’ R language package was used for detecting the differences. (C) The prognostic ability of mRLncSig lncRNAs in tumours was evaluated by constructing a heatmap. The data were obtained from the ‘pan‐cancer TCGA TARGET GTEx’ database, and the Cox regression model was used for testing the prognostic ability. mRLncSig, m6A/m5C/m1A‐regulated lncRNA signature.

Similar articles

Cited by

References

    1. Bade BC, Dela Cruz CS. Lung cancer 2020: epidemiology, etiology, and prevention. Clin Chest Med. 2020;41(1):1‐24. doi:10.1016/j.ccm.2019.10.001 - DOI - PubMed
    1. Barta JA, Powell CA, Wisnivesky JP. Global epidemiology of lung cancer. Ann Glob Health. 2019;85(1):8. doi:10.5334/aogh.2419 - DOI - PMC - PubMed
    1. Denisenko TV, Budkevich IN, Zhivotovsky B. Cell death‐based treatment of lung adenocarcinoma. Cell Death Dis. 2018;9(2):117. doi:10.1038/s41419-017-0063-y - DOI - PMC - PubMed
    1. Bronte G, Rizzo S, La Paglia L, et al. Driver mutations and differential sensitivity to targeted therapies: a new approach to the treatment of lung adenocarcinoma. Cancer Treat Rev. 2010;36(Suppl 3):S21‐S29. doi:10.1016/S0305-7372(10)70016-5 - DOI - PubMed
    1. Ladanyi M, Pao W. Lung adenocarcinoma: guiding EGFR‐targeted therapy and beyond. Mod Pathol. 2008;21(Suppl 2):S16‐S22. doi:10.1038/modpathol.3801018 - DOI - PubMed

Publication types

MeSH terms