. 2024 Jun;11(24):e2309725.
doi: 10.1002/advs.202309725. Epub 2024 Apr 22.

Lactobacillus Reuteri Vesicles Regulate Mitochondrial Function of Macrophages to Promote Mucosal and Cutaneous Wound Healing

Affiliations

Lactobacillus Reuteri Vesicles Regulate Mitochondrial Function of Macrophages to Promote Mucosal and Cutaneous Wound Healing

Yuan Chen et al. Adv Sci (Weinh). 2024 Jun.

Abstract

The interplay between bacteria and their host influences the homeostasis of the human immune microenvironment, and this reciprocal interaction also affects the process of tissue damage repair. A variety of immunomodulatory commensal bacteria reside in the body, capable of delivering membrane vesicles (MVs) to host cells to regulate the local immune microenvironment. This research revealed, for the initial time, the significant enhancement of mucosal and cutaneous wound healing by MVs secreted by the human commensal Lactobacillus reuteri (RMVs) through modulation of the inflammatory environment in wound tissue. Local administration of RMVs reduces the proportion of pro-inflammatory macrophages in inflamed tissues and mitigates the level of local inflammation, thereby facilitating the healing of oral mucosa and cutaneous wounds. The elevated oxidative stress levels in activated pro-inflammatory macrophages can be modulated by RMVs, resulting in phenotypic transformation of macrophages. Furthermore, 3-hydroxypropionaldehyde present in RMVs can decrease the mitochondrial permeability of macrophages and stabilize the mitochondrial membrane potential, thereby promoting the conversion of macrophages to an anti-inflammatory phenotype. This study pioneers the significance of commensal bacterial MVs in tissue injury repair and presents a novel concept for the repair of tissue damage.

Keywords: Lactobacillus reuteri DSM 20016; extracellular vesicles; macrophages; mitochondria; wound healing.


Conflict of interest statement

The authors declare no conflict of interest.

Figures

Scheme 1
Scheme 1
Schematic diagram demonstrates how RMVs shift macrophages to the M2 phenotype, aiding in the wound healing process. (By Figdraw).
Figure 1
Figure 1
Characterization of RMVs. Lactobacillus reuteri DSM 20 016 biofilm development after 48 h of incubation. A) RMVs isolation procedure. B) SEM image showing biofilm with attached vesicles on cells (indicated by arrows). Scale bar, 500 nm. C) TEM showing the bilayer structure of RMVs. Scale bar, 50 nm. The DLS distribution of RMVs particle size is shown in D). E) Representative immunofluorescence staining images of vesicles taken up by the skin over time. i: 6, ii: 12, iii: 24, and iv: 48 h. Scale bar, 100 µm.
Figure 2
Figure 2
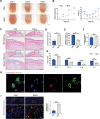
RMVs accelerated the healing of oral mucosal wounds. A) Images showing wounds treated with PBS and RMVs on days 4 and 7 after being wounded. Scale bar, 1 mm. B) The mice's weight and the speed of wound healing at specified intervals. n = 6 per group. C) Representative images of H&E staining and Masson's trichrome staining of wound sections were taken 7 days after wound was created. Single arrows indicate regions of inflammatory infiltration. Scale bar, 1 mm in low‐magnification pictures, 200 µm in high‐magnification images. D) Quantification of epidermal thickness. n = 3 per group. E) Infiltration number of inflammatory cells. n = 3 per group. F) Intensity of collagen staining of newly formed oral mucosal tissue. n = 3 per group. G) ELISA was used to analyze the expression of cytokines in wounds of the oral mucosal. n = 6 per group. H) In vivo, F4/80‐positive macrophages (green) were observed engulfing RMVs (red) through immunofluorescence staining. Scale bar, 20 µm. I) Representative images and quantification of the CD206 expression (green) in the tongue tissue. Scale bar, 50 µm in low‐magnification images, 20 µm in high‐magnification images. n = 4 per group. The data is presented as the mean ± SD. ** P < 0.01; *** P < 0.001; ns, not significant. RMVsDil, RMVs labeled with Dil.
Figure 3
Figure 3
RMVs regulated macrophage function in vitro. A) The immunofluorescence images and quantification of concentration‐dependent uptake of RMVs (red) by RAW 264.7 cells (green). Scale bar, 50 µm. B) Representative flow cytometry histogram and quantification of the distribution of RAW 264.7 cells engulfing RMVsDil. C,D) Cytokines expression in cell supernatant was analyzed by ELISA. n = 6 per group. E) RAW 264.7 cells were treated with varying concentrations of RMVs and the cytokine gene expression levels were analyzed using qPCR. n = 3 per group. F) Flow cytometry histograms and quantification of CD80, CD86, and CD206 expression levels in RAW 264.7 cells. G) Western blot analysis of the phenotypic markers in RAW 264.7 cells. Proinflammatory macrophage marker, iNOS; anti‐inflammatory macrophage markers, Arg‐1. Data shown as mean ± SD. * P < 0.05; ** P < 0.01; *** P < 0.001; ns, not significant.
Figure 4
Figure 4
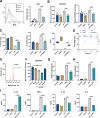
RMVs accelerated the healing of cutaneous wound healing by regulating macrophage phenotype in vivo. A) Representative images of skin injuries in different groups at different time points during the wound healing procedure. B) Quantification of the wound healing rate and the body weight. Each mouse was administered 200 µg of RMVs or 50 µg of 3‐HPA on Day0 and Day7, respectively. C) Representative images of the H&E staining and the Masson staining of the skin samples. The red arrows indicate areas of inflammatory infiltration, while the black arrows highlight nascent hair follicle structures. Scale bar,1 mm in low‐magnification images, 200 µm in high‐magnification images. D) Infiltration number of inflammatory cells. n = 3 per group. E) Quantification of epidermal thickness. n = 3 per group. F) Quantification of the hair follicles. n = 3 per group. G) Collagenvolume fraction of newly formed skin tissue. n = 3 per group. H) Representative images and quantification of the CD206 expression in the skin tissue. Scale bar, 50 µm. n = 6 per group. I) Cytokines expression and the level of transforming growth factor in cutaneous wounds was analyzed by ELISA. n = 6 per group. Data shown as mean ± SD. *** P < 0.001; ns, not significant.
Figure 5
Figure 5
3‐HPA in RMVs relieved the oxidative stress state of activated macrophages. A) Flow cytometry histograms and quantification of expression levels of ROS in RAW 264.7 cells. B) Mitochondrial ROS levels in cells treated with LPS and RMVs. n = 6 per group. C) Mitochondrial complex I (CI) and complex II (CII) activities and their ratio CI/CII. n = 3 per group. D) The level of mitochondrial membrane potential change. n = 3 per group. E) Representative LC‐MS plot of RMVs. F) Mitochondrial ROS levels in macrophages following the addition of 3‐HPA to the medium. n = 6 per group. G,H) The levels of MDA and NO. These reflect the cellular oxidative damage. n = 3 per group. I) Levels of cytokines secreted by RAW 264.7 cells after the addition of 3‐HPA. n = 3 per group. Data shown as mean ± SD. ** P < 0.01; *** P < 0.001.
Figure 6
Figure 6
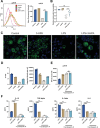
Mitochondrial permeability transition is crucial for the functionality of 3‐HPA. A) Flow cytometry histogram and quantification of mitochondrial permeability in RAW 264.7 cells after addition of 3‐HPA. B) Statistics of relative mitochondrial permeability in RAW 264.7 cells detected by fluorescent microplate reader. n = 6 per group. C) Representative fluorescence images of mitochondrial permeability in RAW 264.7 cells. Scale bars, 10 µm. D) Statistics of fluorescence area percentage and integrated density of RAW 264.7 cells. n = 6 per group. E) Mitochondrial permeability after addition of cyclosporin A, an inhibitor of cyclophilin D (CypD). F) Cytokines expression in cell supernatant was analyzed by ELISA. n = 3 per group. ** P < 0.01; *** P < 0.001; ns, not significant.
Figure 7
Figure 7
3‐HPA promoted cutaneous wound healing in vivo by promoting alternative conversation of macrophages. A) Representative images of skin injuries in different groups at different time points during the wound healing procedure. B) Quantification of the wound healing rate and the body weight. Each mouse was administered 200 µg of RMVs or 50 µg of 3‐HPA on Day0 and Day7, respectively. C) Representative images of the H&E staining and the Masson staining of the skin samples. The red arrows indicate areas of inflammatory infiltration, while the black arrows highlight nascent hair follicle structures. Scale bar,1 mm in low‐magnification images, 200 µm in high‐magnification images. D) Infiltration number of inflammatory cells. n = 3 per group. E) Quantification of epidermal thickness. n = 3 per group. F) Quantification of the hair follicles. n = 3 per group. G) Collagenvolume fraction of newly formed skin tissue. n = 3 per group. H) Representative images and quantification of the CD206 expression in the skin tissue. Scale bar, 50 µm. n = 6 per group. I) Cytokines expression in cutaneous wounds was analyzed by ELISA. n = 6 per group. J) The level of transforming growth factor‐beta in cutaneous wounds was analyzed by ELISA. n = 6 per group. Data shown as mean ± SD. *** P < 0.001; ns, not significant.

References

    1. Pickard J. M., Zeng M. Y., Caruso R., Nunez G., Immunol. Rev. 2017, 279, 70. - PMC - PubMed
    1. Brestoff J. R., Artis D., Nat. Immunol. 2013, 14, 676. - PMC - PubMed
    1. Cohen L. J., Esterhazy D., Kim S.‐H., Lemetre C., Aguilar R. R., Gordon E. A., Pickard A. J., Cross J. R., Emiliano A. B., Han S. M., Chu J., Vila‐Farres X., Kaplitt J., Rogoz A., Calle P. Y., Hunter C., Bitok J. K., Brady S. F., Nature 2017, 549, 48. - PMC - PubMed
    1. Zheng Y., Hunt R. L., Villaruz A. E., Fisher E. L., Liu R., Liu Q., Cheung G. Y. C., Li M., Otto M., Cell Host Microbe 2022, 30, 301. - PMC - PubMed
    1. Arpaia N., Campbell C., Fan X., Dikiy S., van der Veeken J., deRoos P., Liu H., Cross J. R., Pfeffer K., Coffer P. J., Rudensky A. Y., Nature 2013, 504, 451. - PMC - PubMed

LinkOut - more resources