. 2024 Jun;11(24):e2304848.
doi: 10.1002/advs.202304848. Epub 2024 Apr 22.

Statistical Genomics Analysis of Simple Sequence Repeats from the Paphiopedilum Malipoense Transcriptome Reveals Control Knob Motifs Modulating Gene Expression

Affiliations

Statistical Genomics Analysis of Simple Sequence Repeats from the Paphiopedilum Malipoense Transcriptome Reveals Control Knob Motifs Modulating Gene Expression

Yingyi Liang et al. Adv Sci (Weinh). 2024 Jun.

Abstract

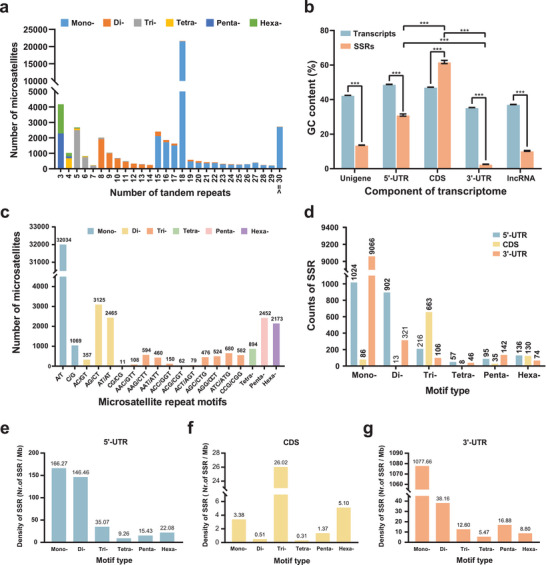
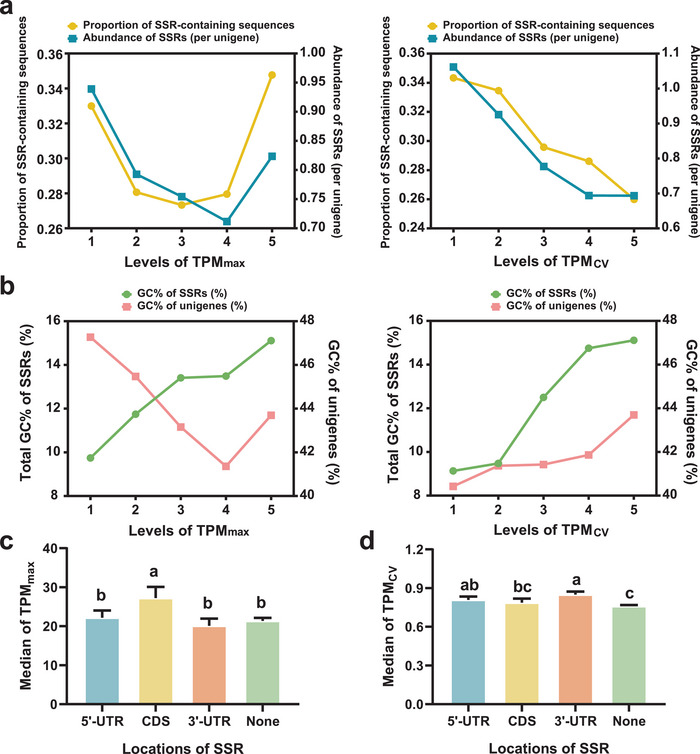
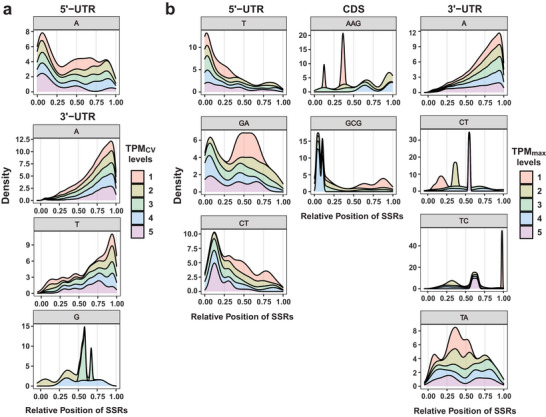
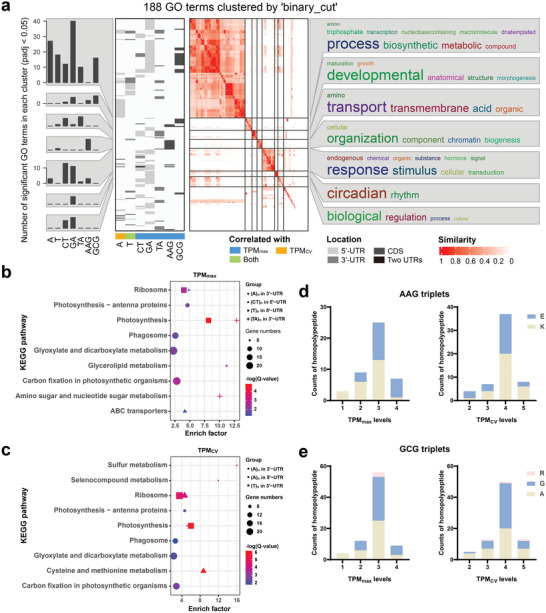
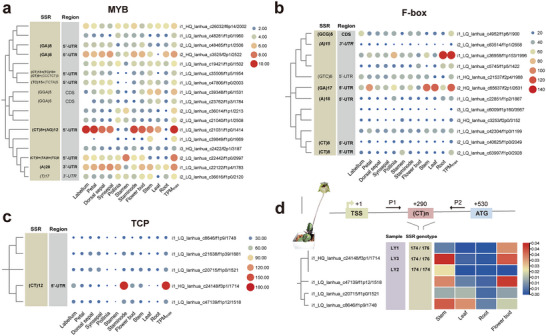
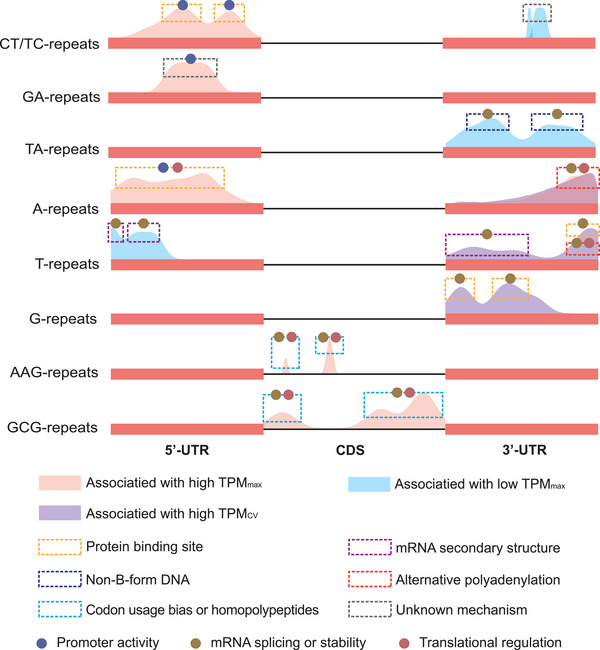
Simple sequence repeats (SSRs) are found in nonrandom distributions in genomes and are thought to impact gene expression. The distribution patterns of 48 295 SSRs of Paphiopedilum malipoense are mined and characterized based on the first full-length transcriptome and comprehensive transcriptome dataset from 12 organs. Statistical genomics analyses are used to investigate how SSRs in transcripts affect gene expression. The results demonstrate the correlations between SSR distributions, characteristics, and expression level. Nine expression-modulating motifs (expMotifs) are identified and a model is proposed to explain the effect of their key features, potency, and gene function on an intra-transcribed region scale. The expMotif-transcribed region combination is the most predominant contributor to the expression-modulating effect of SSRs, and some intra-transcribed regions are critical for this effect. Genes containing the same type of expMotif-SSR elements in the same transcribed region are likely linked in function, regulation, or evolution aspects. This study offers novel evidence to understand how SSRs regulate gene expression and provides potential regulatory elements for plant genetic engineering.

Keywords: Paphiopedilum malipoense; full‐length transcriptomes; gene expression; motif types; simple sequence repeats (SSRs).


Conflict of interest statement

The authors declare no conflict of interest.

Figures

Figure 1
Figure 1
Statistics of SSRs in the P. malipoense transcriptome. a) Distribution of tandem repeat number of SSRs in the P. malipoense transcriptome. b) GC contents of different components in the P. malipoense transcriptome. The error bars show the standard error of the mean. *** indicates p < 0.001 (Wilcoxon rank sum test or Dunn's pairwise test). c) Distribution of SSR motif types. d) Counts of six SSR motif sizes in three transcribed regions. e–g) Density (SSR counts per Mb) of six SSR motif sizes in the 5’‐UTR (e), CDS (f), and 3’‐UTR (g).
Figure 2
Figure 2
SSR characteristics and location of unigenes with different expression levels. a) Trends of the proportion of SSR‐containing sequences and SSR abundance (SSR counts per unigene) as TPMmax (left) and TPMCV (right) decreased. b) Trends of the GC contents of SSRs and their sequence contexts as TPMmax (left) and TPMCV (right) decrease. c,d) TPMmax (c) and TPMCV (d) of unigenes with SSRs in the different genic regions. The error bar indicates 95% CI. Different letters represent significant differences, and the same letters represent no significant difference (one‐sided test, BH adjusted p value < 0.05).
Figure 3
Figure 3
The stacking probability density curves of the relative position of expMotifs within transcribed regions. a) intra‐transcribed region distribution of expMotifs correlated to TPMCV within the 5’‐UTR (top) and 3’‐UTR (bottom). b) Intra‐transcribed region distribution of expMotifs correlated to TPMmax within the 5’‐UTR (left), CDS (middle), and 3’‐UTR (right). Different colors indicate different TPMCV and TPMmax levels, and the values decrease from level 1 to 5. The ordinate represents probability density, and the abscissa represents the position of SSRs relative to the starting position of the transcribed regions.
Figure 4
Figure 4
Potential functions of expMotif‐SSRs. a) GO analysis for biological processes of each type of expMotif‐SSR. GO terms representing each cluster were displayed as a word cloud, with the size of the word indicating the frequency of appearance in the terms. b,c) Significantly enriched KEGG pathways of each type of expMotif correlated to TPMmax (b) and TPMCV (c). d,e) Predominant amino acids of homopolypeptides coded by AAG repeats (d) and GCG repeats (e) with different TPMmax (left) and TPMCV (right).
Figure 5
Figure 5
Validation of expression‐modulating effects of expMotif‐SSR. a) Heatmap of TPM values of expMotif‐SSR containing MYB genes and their paralogs. The SSR distribution of all genes was listed on the left. The NJ tree based on unigene sequences depicts the phylogenetic relationships among the genes. b) Heatmap of TPM values of expMotif‐SSR containing F‐box genes and their paralogs. c) Heatmap of TPM values of expMotif‐SSR containing TCP gene and their paralogs. d) The qRTPCR validation of TCP genes. The heatmap shows the 2−ΔCT values. The 2−ΔCT of each sample and their genotype at expMotif‐SSR loci are displayed separately, and the 2−ΔCT of the remaining SSR‐free paralogs are averaged. The schematic representation of expMotif‐SSR in i1_HQ_lanhua_c24148/f3p1/1714 is above the graph. The relative position of CT repeat locus (red, +290), translation start site (ATG, blue, +530) to transcriptional start site (TSS, green, +1) are drawn. Primers P1 and P2 (expected size 177 bp) were used for the genotyping of the expMotif‐SSR locus. The photo shows the morphology of P. malipoense. The scale bar represents 10 cm.
Figure 6
Figure 6
An intra‐transcribed region scale model to explain the expression regulatory effects of expMotif‐SSRs according to our findings and previous experimental studies. Probability density curves show distribution peaks of each expMotif (from Figure 3). The dashed‐line boxes indicate potential regulatory mechanisms of expMotif‐SSRs in corresponding peaks. Dots represent processes of gene expression impacted by expMotif‐SSRs.

Similar articles

Cited by

References

    1. Gymrek M., Willems T., Guilmatre A., Zeng H., Markus B., Georgiev S., Daly M. J., Price A. L., Pritchard J. K., Sharp A. J., Erlich Y., Nat. Genet 2016, 48, 22. - PMC - PubMed
    1. Bakhtiari M., Park J., Ding Y.‐C., Shleizer‐Burko S., Neuhausen S. L., Halldórsson B. V., Stefánsson K., Gymrek M., Bafna V., Nat. Commun. 2021, 12, 2075. - PMC - PubMed
    1. Erwin G. S., Gürsoy G., Al‐Abri R., Suriyaprakash A., Dolzhenko E., Zhu K., Hoerner C. R., White S. M., Ramirez L., Vadlakonda A., Vadlakonda A., Von Kraut K., Park J., Brannon C. M., Sumano D. A., Kirtikar R. A., Erwin A. A., Metzner T. J., Yuen R. K. C., Fan A. C., Leppert J. T., Eberle M. A., Gerstein M., Snyder M. P., Nature 2023, 613, 96. - PMC - PubMed
    1. Fotsing S. F., Margoliash J., Wang C., Saini S., Yanicky R., Shleizer‐Burko S., Goren A., Gymrek M., Nat. Genet 2019, 51, 1652. - PMC - PubMed
    1. Verbiest M., Maksimov M., Jin Y., Anisimova M., Gymrek M., Bilgin Sonay T., J. Evolution. Biol. 2023, 36, 321. - PMC - PubMed

MeSH terms

LinkOut - more resources