

Viewing early life without labels: optical approaches for imaging the early embryo†
- PMID: 38647415
- PMCID: PMC11180623
- DOI: 10.1093/biolre/ioae062
Viewing early life without labels: optical approaches for imaging the early embryo†
Abstract
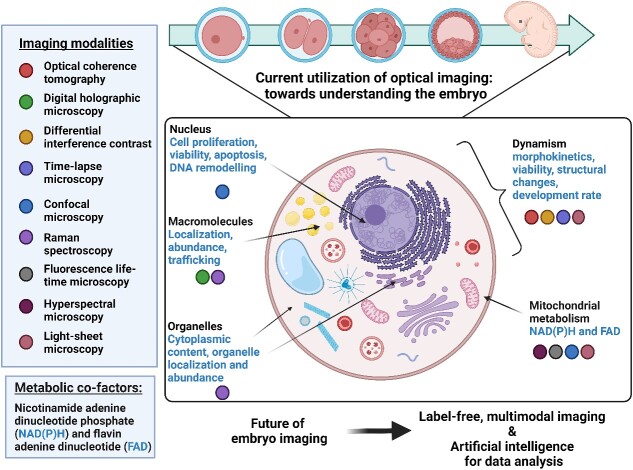
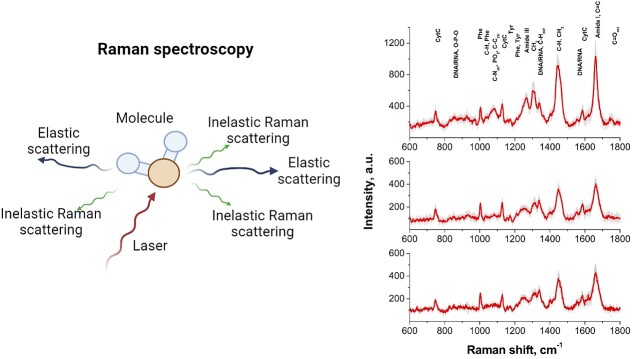
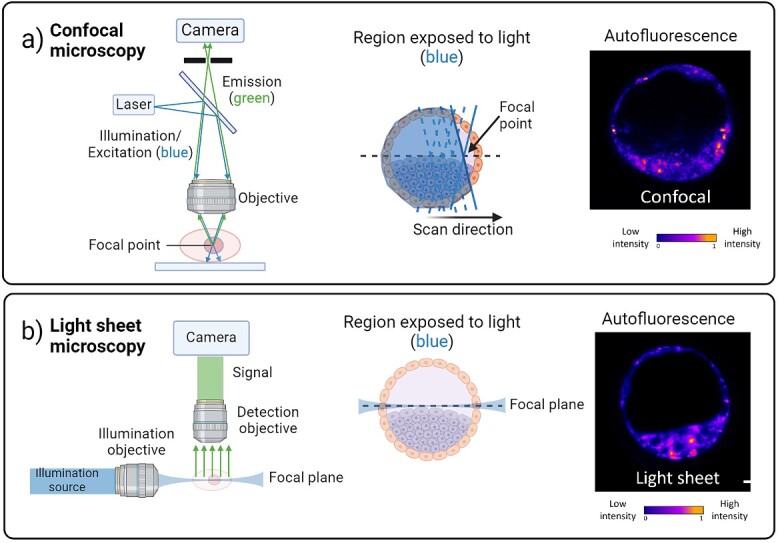
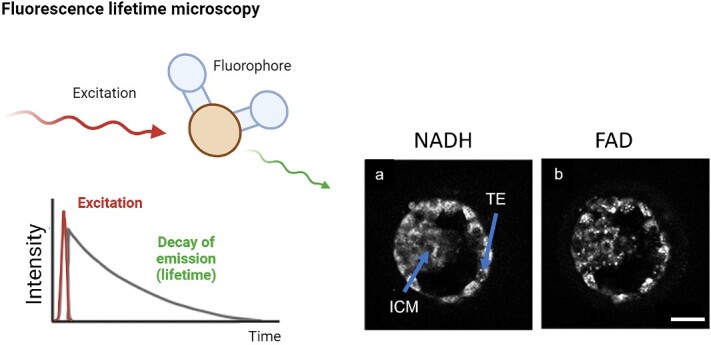
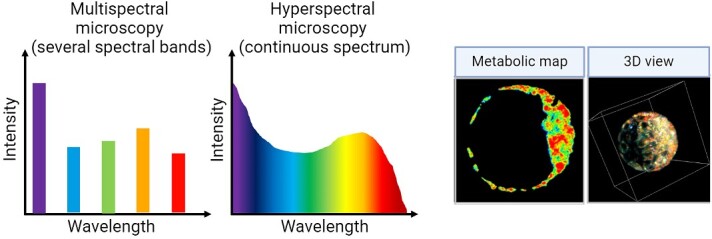
Embryo quality is an important determinant of successful implantation and a resultant live birth. Current clinical approaches for evaluating embryo quality rely on subjective morphology assessments or an invasive biopsy for genetic testing. However, both approaches can be inherently inaccurate and crucially, fail to improve the live birth rate following the transfer of in vitro produced embryos. Optical imaging offers a potential non-invasive and accurate avenue for assessing embryo viability. Recent advances in various label-free optical imaging approaches have garnered increased interest in the field of reproductive biology due to their ability to rapidly capture images at high resolution, delivering both morphological and molecular information. This burgeoning field holds immense potential for further development, with profound implications for clinical translation. Here, our review aims to: (1) describe the principles of various imaging systems, distinguishing between approaches that capture morphological and molecular information, (2) highlight the recent application of these technologies in the field of reproductive biology, and (3) assess their respective merits and limitations concerning the capacity to evaluate embryo quality. Additionally, the review summarizes challenges in the translation of optical imaging systems into routine clinical practice, providing recommendations for their future development. Finally, we identify suitable imaging approaches for interrogating the mechanisms underpinning successful embryo development.
Keywords: autofluorescence; embryo assessment; fluorescent lifetime microscopy; hyperspectral imaging; label-free imaging; light sheet microscopy; metabolic imaging; non-invasive; optical imaging.
© The Author(s) 2024. Published by Oxford University Press on behalf of Society for the Study of Reproduction.
Figures
Similar articles
-
Hyperspectral microscopy can detect metabolic heterogeneity within bovine post-compaction embryos incubated under two oxygen concentrations (7% versus 20%).Hum Reprod. 2017 Oct 1;32(10):2016-2025. doi: 10.1093/humrep/dex261. Hum Reprod. 2017. PMID: 28938734
-
Optical imaging of cleavage stage bovine embryos using hyperspectral and confocal approaches reveals metabolic differences between on-time and fast-developing embryos.Theriogenology. 2021 Jan 1;159:60-68. doi: 10.1016/j.theriogenology.2020.10.012. Epub 2020 Oct 10. Theriogenology. 2021. PMID: 33113445
-
Oocyte and embryo evaluation by AI and multi-spectral auto-fluorescence imaging: Livestock embryology needs to catch-up to clinical practice.Theriogenology. 2020 Jul 1;150:255-262. doi: 10.1016/j.theriogenology.2020.01.061. Epub 2020 Feb 19. Theriogenology. 2020. PMID: 32088032 Review.
-
Non-invasive, label-free optical analysis to detect aneuploidy within the inner cell mass of the preimplantation embryo.Hum Reprod. 2021 Dec 27;37(1):14-29. doi: 10.1093/humrep/deab233. Hum Reprod. 2021. PMID: 34741175
-
Label-free, high-throughput holographic imaging to evaluate mammalian gametes and embryos†.Biol Reprod. 2024 Jun 12;110(6):1125-1134. doi: 10.1093/biolre/ioae057. Biol Reprod. 2024. PMID: 38733568 Free PMC article. Review.
Cited by
-
The role of light sheet microscopy for non-invasive imaging of live embryos.Hum Reprod. 2025 Jul 1;40(7):1377-1378. doi: 10.1093/humrep/deaf091. Hum Reprod. 2025. PMID: 40373285 Free PMC article. No abstract available.
-
Novel imaging and biophysical approaches to study tissue hydraulics in mammalian folliculogenesis.Biophys Rev. 2024 Oct 7;16(5):625-637. doi: 10.1007/s12551-024-01231-4. eCollection 2024 Oct. Biophys Rev. 2024. PMID: 39618785 Free PMC article. Review.
-
Quantifying DNA damage following light sheet and confocal imaging of the mammalian embryo.Sci Rep. 2024 Sep 5;14(1):20760. doi: 10.1038/s41598-024-71443-x. Sci Rep. 2024. PMID: 39237572 Free PMC article.
References
-
- Infertility prevalence estimates: 1990-2021 . Geneva: World Health Organization; 2023. Licence: CC BY-NC-SA 3.0 IGO.
-
- Zegers-Hochschild F, Nygren KG, Adamson GD, de Mouzon J, Lancaster P, Mansour R, Sullivan E, International Committee Monitoring Assisted Reproductive Technologies . The international committee monitoring assisted reproductive technologies (ICMART) glossary on ART terminology. Fertil Steril 2006; 86:16–19. - PubMed
-
- Inhorn MC, Patrizio P. Infertility around the globe: new thinking on gender, reproductive technologies and global movements in the 21st century. Hum Reprod Update 2015; 21:411–426. - PubMed
-
- Newman JE, Paul RC, Chambers GM. Assisted reproductive technology in Australia and New Zealand 2021. Sydney, Australia: National Perinatal Epidemiology and Statistics Unit, The University of New South Wales; 2023.
-
- van Loendersloot LL, van Wely M, Limpens J, Bossuyt PM, Repping S, van der Veen F. Predictive factors in in vitro fertilization (IVF): a systematic review and meta-analysis. Hum Reprod Update 2010; 16:577–589. - PubMed
