. 2024 Jun;11(23):e2310120.
doi: 10.1002/advs.202310120. Epub 2024 Apr 22.

Molecular Determinant Underlying Selective Coupling of Primary G-Protein by Class A GPCRs

Affiliations

Molecular Determinant Underlying Selective Coupling of Primary G-Protein by Class A GPCRs

Qingya Shen et al. Adv Sci (Weinh). 2024 Jun.

Erratum in

Abstract

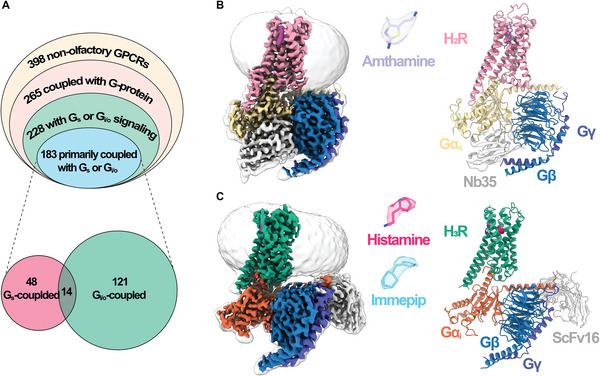
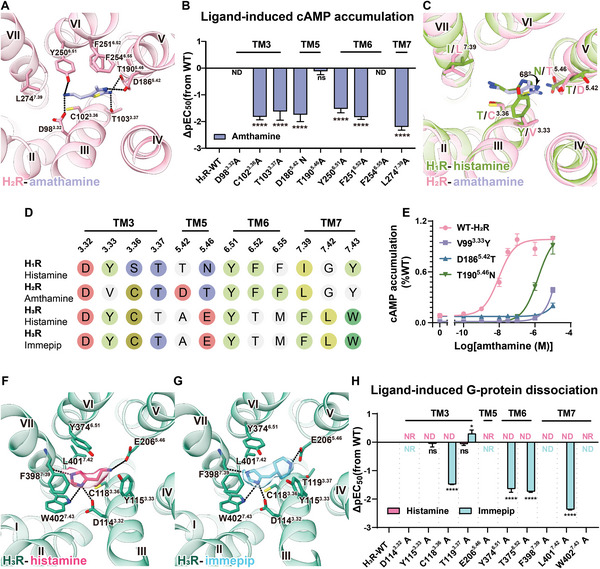
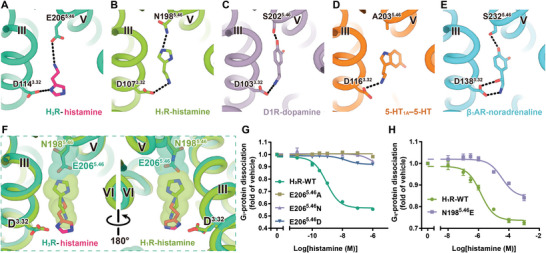
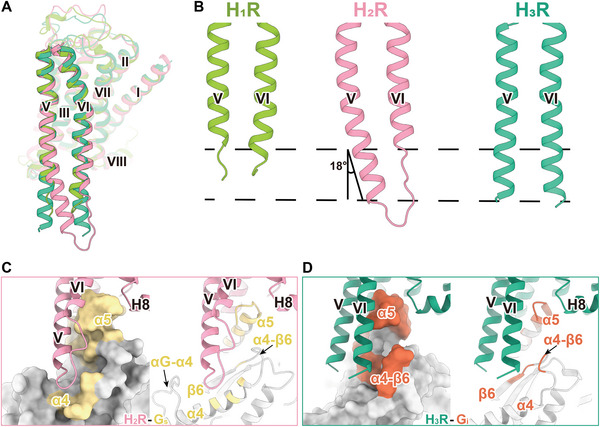
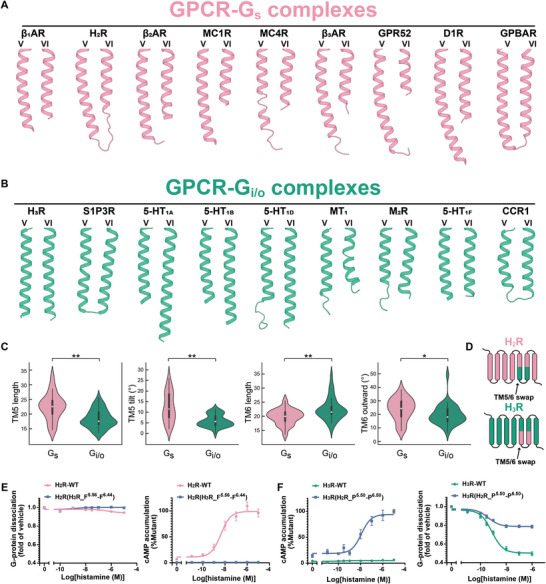
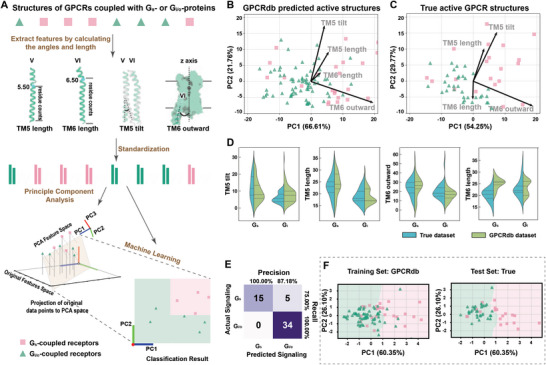
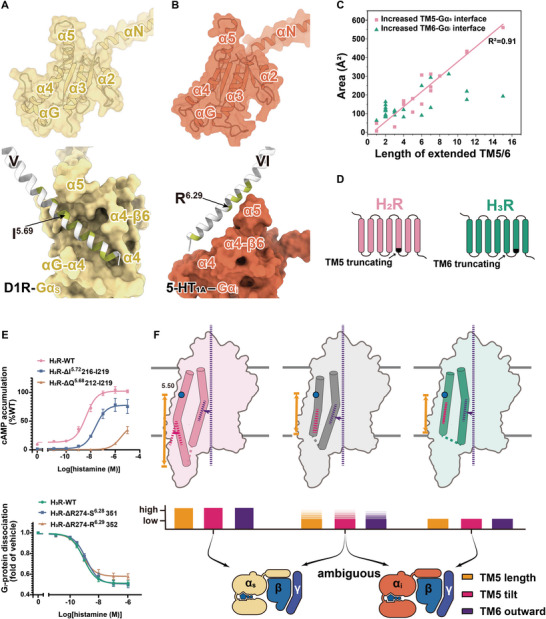
G-protein-coupled receptors (GPCRs) transmit downstream signals predominantly via G-protein pathways. However, the conformational basis of selective coupling of primary G-protein remains elusive. Histamine receptors H2R and H3R couple with Gs- or Gi-proteins respectively. Here, three cryo-EM structures of H2R-Gs and H3R-Gi complexes are presented at a global resolution of 2.6-2.7 Å. These structures reveal the unique binding pose for endogenous histamine in H3R, wherein the amino group interacts with E2065.46 of H3R instead of the conserved D1143.32 of other aminergic receptors. Furthermore, comparative analysis of the H2R-Gs and H3R-Gi complexes reveals that the structural geometry of TM5/TM6 determines the primary G-protein selectivity in histamine receptors. Machine learning (ML)-based structuromic profiling and functional analysis of class A GPCR-G-protein complexes illustrate that TM5 length, TM5 tilt, and TM6 outward movement are key determinants of the Gs and Gi/o selectivity among the whole Class A family. Collectively, the findings uncover the common structural geometry within class A GPCRs that determines the primary Gs- and Gi/o-coupling selectivity.

Keywords: G protein selectivity; GPCR; H2R; H3R; cryo‐EM structure; machine learning; signaling complex.


Conflict of interest statement

The authors declare no conflict of interest.

Figures

Figure 1
Figure 1
Cryo‐EM structures of H2R‐Gs and H3R‐Gi complexes. A) (Up) Proportion of Gs‐ or Gi/o‐coupled receptors in the non‐olfactory GPCRs. (Down) Number of receptors primarily coupling with Gs‐ or Gi/o‐proteins. B) The cryo‐EM density map (left) and atomic model (right) of amthamine‐bound H2R‐Gs complex. The amthamine is depicted as stick within a transparent EM density map. C) The cryo‐EM density map (left) and atomic model (right) of H3R‐Gi complex. The ligands histamine and immepip are depicted as sticks within a transparent EM density map.
Figure 2
Figure 2
Ligand recognition of histamine receptors. A) Detailed interaction of amthamine with H2R. Dashed lines represent hydrogen bonds. B) Amthamine induced cAMP accumulation in HEK293 cells expressing H2R mutants of the residues in orthosteric pocket (n = 3, ordinary one‐way ANOVA, ****P < 0.0001, ND, not determinable, which refers to cannot be established over the tested concentration range, ns refers to no significance between the WT and mutant). C) Structural comparisons of ligand recognition between histamine‐H1R and amthamine‐H2R structures. D) Sequence alignment of the orthosteric pocket of histamine receptors. Residues that interact with ligands are highlighted with colored circles. E) Dose‐dependent curves for amthamine induced cAMP accumulation in HEK293 cells expressing the H2R mutants (V993.33Y, D1865.42T, T1905.46N) that are not conserved in H1R (n  = 3). F‐G) Detailed interactions of histamine F) and immepip G) with H3R. H) Agonists induced Gi dissociation in HEK293 cells expressing H3R mutants of the residues in orthosteric pocket by NanoBiT assays (n = 3, ordinary one‐way ANOVA, *P = 0.0456, ****P < 0.0001, NR refers to no response to the ligand, ND, not determinable, which refers to cannot be established over the tested concentration range, ns refers to no significance between the WT and mutant).
Figure 3
Figure 3
Endogenous ligand binding poses of aminergic receptors. A–E) Binding poses of H3R (A), H1R (B), D1R (C), 5‐HT1A (D), and β1AR (E) with its endogenous ligands. F) Superimposition of H3R‐hisatime and H1R‐histamine structures. G,H) Effects of histamine‐induced G‐protein dissociation in HEK293 cells expressing histamine receptor mutants at 5.46 position. Dose‐response curves for H3R E2065.46 mutants (G) and H1R N1965.46E mutant (H) were measured using the NanoBiT assay (n  = 3).
Figure 4
Figure 4
Structural comparison of histamine receptor–G‐protein complexes. A) Structural superposition of the active models of H1R, H2R, and H3R. B) Comparison of TM5 and TM6 in H1R‐Gq, H2R‐Gs, and H3R‐Gi complexes. C,D) Surface (left) and cartoon (right) representation of binding area of H2R (C) and H3R (D) with their respective coupled Gα subunit. Residues within 4Å of H2R or H3R in Gαs or Gαi are highlighted in yellow or orange, respectively.
Figure 5
Figure 5
TM5 and TM6 are responsible for Gs and Gi selectivity. A) Representative of the TM5/TM6 structural geometry of Gs‐coupled receptors. B) Representation of the TM5/TM6 structural geometry of Gi‐coupled receptors. C) Violin plots depicting four distinct features of TM5/TM6 in Gs‐ and Gi/o‐coupled receptors. The white dot denotes the median. The interquartile range is shown by the broad black bar in the middle. Except for points considered to be “outliers” using an interquartile range‐based technique, the thin line reflects the remainder of the distribution. n = 54, ns P > 0.05, *P < 0.05, **P < 0.01 by Mann‐Whitney U test. D) Schematic representation of the “TM5/TM6 swap” experiments. E–F) Dose‐dependent curves for histamine induced G‐protein dissociation and cAMP accumulation in HEK293 cells expressing chimera receptors (n  = 3). E) Replacement of I5.56‐F6.44 of H2R with F5.56‐F6.44 of H3R did not confer the ability to dissociate Gi‐protein (left), but resulted in loss of the ability to activate the Gs signal pathway (right). F) Replacement of P5.50‐P6.50 of H3R with P5.50‐P6.50 of H2R resulted in gain of the ability to activate the Gs signal pathway (left), but loss of the ability to dissociate Gi‐protein (right).
Figure 6
Figure 6
Machine learning‐based classification of GPCRs into Gs and Gi signaling pathway. A) Workflow for GPCR classification utilizing machine learning and feature pre‐processing. The length and tilt of TM5, as well as the length and outward movement of TM6 are extracted from active GPCR structures obtained from GPCRdb homology models and True structures. The resulting data of these four geometries are standardized, and then subjected to PCA. Subsequently, a Random Forest classifier is employed to classify GPCRs based on the PCA results. B,C) PCA biplots were generated for the four geometries of GPCRdb homology models (B) and True GPCR structures (C) individually. The contributions of each variable to the principal components are depicted as vectors on the plot, where the vertical component of a vector on a given PC illustrates the respective contribution of that variable to the PC. The angle between two vectors reflects the correlation between the corresponding features, while the length of a vector represents the significance of the corresponding feature. D) Comparison of violin plots depicting four geometries of TM5/TM6 in GPCRdb structures and True GPCR structures. Here the median and interquartile range are depicted as dashes. E) Confusion matrix for the True GPCR structures given by the best classifier. F) Decision boundary visualization via PCA given by the best classifier and scatter plot of GPCRdb homology models (left) and True GPCR structures (right) based on GPCRdb homology models.
Figure 7
Figure 7
Contributions to G‐protein signaling of extended TM5/TM6. A) (Up) Surface and cartoon representations of Gαs are shown, with the surface of Gαs depicted as transparent. (Down)The binding surface of TM5 with Gαs of D1R is shown, with TM5 beyond I5.69 noted as extended helix. Residues that interact with Gα are highlighted in green. B) (Up)Surface and cartoon representations of Gαi are shown, with the surface of Gαi depicted as transparent. (Down) The binding surface of TM6 with Gαi/o of 5‐HT1A. TM6 beyond R6.29 was considered as extended helix. C) The additional contact areas of Gs‐ or Gi/o‐coupled receptors between the extended TM5/TM6 with Gαs/Gαi/o, respectively. D) Schematic representation of the TM5‐ (up) or TM6‐ (down) breaking mutants. E) Dose‐dependent curves for histamine induced cAMP accumulation or G‐protein dissociation in HEK293 cells expressing the truncated receptors (n  = 3). (Up) The TM5 of H2R was respectively truncated by four amino acids and eight amino acids. The cAMP assay validated that the length of TM5 was closely related to the activation of the Gs signal pathway. (Down) The TM6 of H3R was respectively truncated by eight amino acids and nine amino acids. The NanoBit assay validated that the length of TM6 did not correlate with the dissociation of the Gi‐protein. F) Schematic representation of the geometry determinants for G‐protein selectivity of GPCRs.

References

    1. a) Bjarnadottir T. K., Gloriam D. E., Hellstrand S. H., Kristiansson H., Fredriksson R., Schioth H. B., Genomics 2006, 88, 263; - PubMed
    2. b) Flock T., Hauser A. S., Lund N., Gloriam D. E., Balaji S., Babu M. M., Nature 2017, 545, 317. - PMC - PubMed
    1. a) Hauser A. S., Avet C., Normand C., Mancini A., Inoue A., Bouvier M., Gloriam D. E., Elife 2022, 11, 74107; - PMC - PubMed
    2. b) Neves S. R., Ram P. T., Iyengar R., Science 2002, 296, 1636. - PubMed
    1. Wacker D., Stevens R. C., Roth B. L., Cell 2017, 170, 414. - PMC - PubMed
    1. Wisler J. W., Rockman H. A., Lefkowitz R. J., Circulation 2018, 137, 2315. - PMC - PubMed
    1. a) Inoue A., Raimondi F., Kadji F. M. N., Singh G., Kishi T., Uwamizu A., Ono Y., Shinjo Y., Ishida S., Arang N., Kawakami K., Gutkind J. S., Aoki J., Russell R. B., Cell 2019, 177, 1933; - PMC - PubMed
    2. b) Sandhu M., Cho A., Ma N., Mukhaleva E., Namkung Y., Lee S., Ghosh S., Lee J. H., Gloriam D. E., Laporte S. A., Babu M. M., Vaidehi N., Nat. Commun. 2022, 13, 7428. - PMC - PubMed

MeSH terms

LinkOut - more resources