. 2022 Sep 26;9(1):104.
doi: 10.1186/s40643-022-00589-1.

Transcriptomic and proteomic analyses provide insights into the adaptive responses to the combined impact of salinity and alkalinity in Gymnocypris przewalskii

Affiliations

Transcriptomic and proteomic analyses provide insights into the adaptive responses to the combined impact of salinity and alkalinity in Gymnocypris przewalskii

Fulei Wei et al. Bioresour Bioprocess. .

Abstract

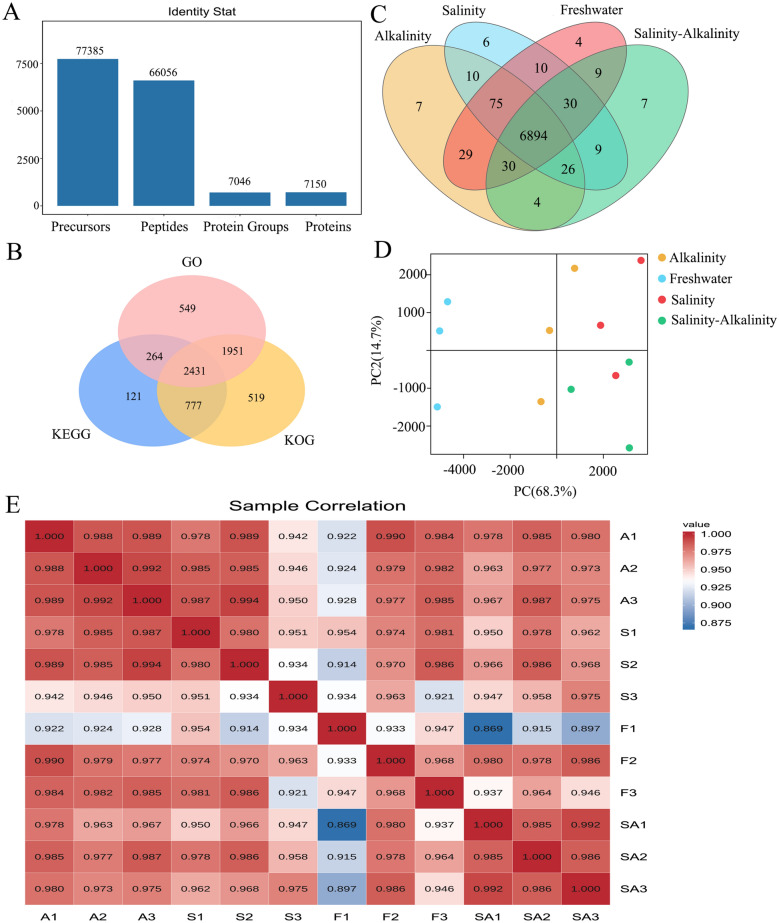
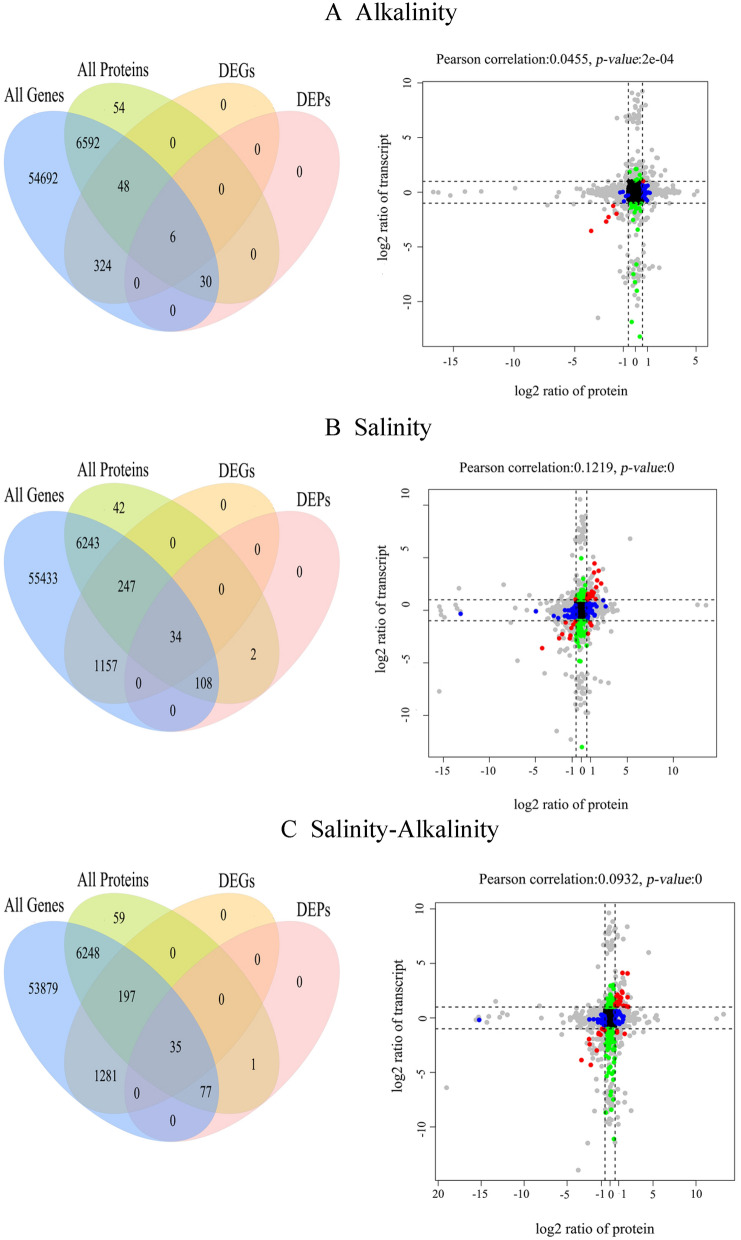
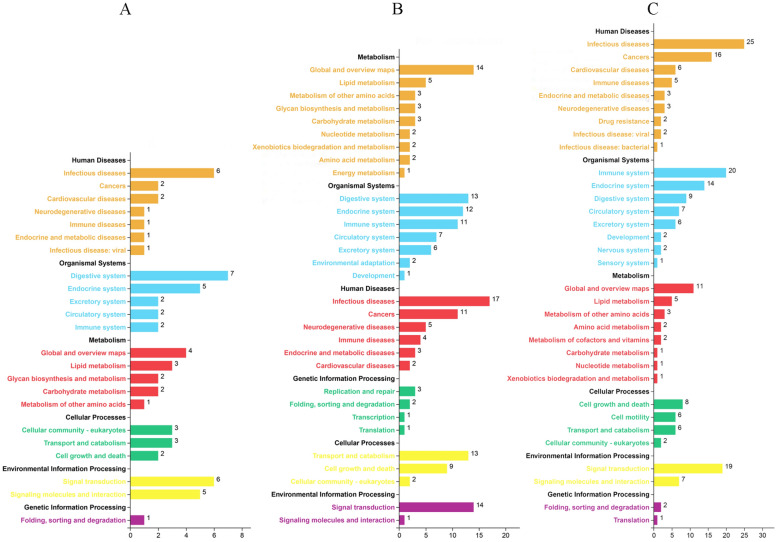
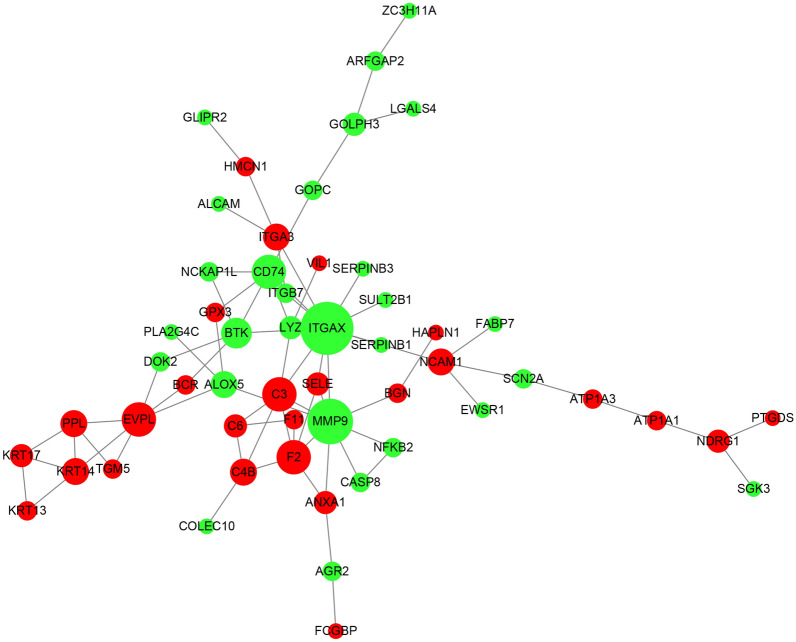
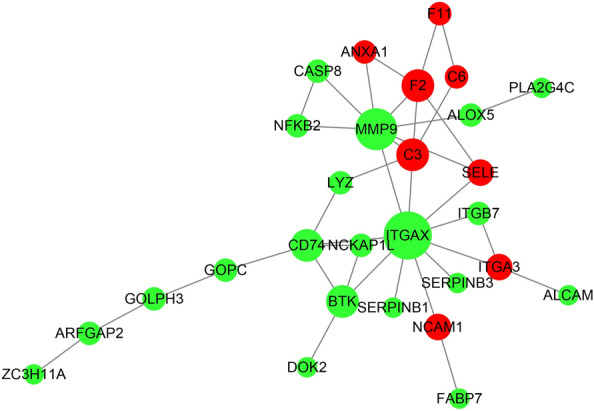
Gymnocypris przewalskii is the only high-land endemic teleost living in Qinghai Lake, the largest saline-alkaline lake in China. Its osmoregulatory physiology remains elusive due to a lack of precise identification of the response proteins. In the present study, DIA/SWATH was used to identify differentially expressed proteins (DEPs) under alkaline (pH = 10.1, carbonate buffer), saline (12‰, sodium chloride), and saline-alkaline [carbonate buffer (pH = 10.1) plus 11‰ sodium chloride] stresses. A total of 66,056 unique peptides representing 7,150 proteins and 230 DEPs [the false discovery rate (FDR) ≤ 0.05, fold change (FC) ≥ 1.5] were identified under different stresses. Comparative analyses of the proteome and transcriptome indicated that over 86% of DEPs did not show consistent trends with mRNA. In addition to consistent enrichment results under different stresses, the specific DEPs involved in saline-alkaline adaptation were primarily enriched in functions of homeostasis, hormone synthesis and reactions of defense response, complement activation and reproductive development. Meanwhile, a protein-protein interaction (PPI) network analysis of these specific DEPs indicated that the hub genes were ITGAX, MMP9, C3, F2, CD74, BTK, ANXA1, NCKAP1L, and CASP8. This study accurately isolated the genes that respond to stress, and the results could be helpful for understanding the physiological regulation mechanisms regarding salinity, alkalinity, and salinity-alkalinity interactions.

Keywords: Gymnocypris przewalskii; Alkalinity; DIA/SWATH; Salinity.


Conflict of interest statement

The authors declare no competing interests.

Figures

Fig. 1
Fig. 1
Protein identification and sample relationship analysis. A The statistics of protein and peptide identification; B Venn diagram of overlap of the proteins with annotation in the GO, KEGG, or KOG databases; C number and Venn diagram of overlap of Salinity, Alkalinity, Freshwater and Salinity–Alkalinity groups; D principal components analysis (PCA) of different individuals. E Correlation analysis of replicates among different groups. S indicates replicate in Salinity stress, A for Alkalinity, F for Freshwater and SA for Salinity–Alkalinity
Fig. 2
Fig. 2
Overlap and the correlation between transcriptome and proteome under Alkalinity (A), Salinity (B) and Salinity–Alkalinity stresses (C). Venn diagrams indicate overlap and quantities of detected genes, proteins, differential genes (DEGs) (the fold change (FC) ≥ 2.0, the false discovery rate (FDR) ≤ 0.05) and proteins (DEPs) (fold change ≥ 1.5, FDR ≤ 0.05). Dotted line in nine-quadrant diagrams means the fold change threshold for the DEGs and DEPs. Each dot represents a gene/protein. Black dots represent non-differential proteins and genes; red dots represent DEGs and DEPs showing consistent or opposite change trends; green dots represent genes differentially expressed but proteins none differentially expressed; blue dots represent genes none differentially expressed but proteins differentially expressed; gray dots represent genes (FC ≥ 2, FDR > 0.05) or proteins (FC ≥ 1.5, FDR > 0.05)
Fig. 3
Fig. 3
KEGG classification of differential expression genes under Alkalinity (A), Salinity (B) and Salinity–Alkalinity stresses (C). Numbers on column chart represent the number of genes enriched on different KEGG classes
Fig. 4
Fig. 4
Regulated network analysis of saline–alkaline stress induced genes. Red and green nodes in the network present up-regulation or downregulation of proteins. Names of the nodes are symbols of proteins. The size of a node is proportional to its degree. Nodes with higher degrees, which means having more neighbors, will have a stronger capacity to modulate adjacent genes than genes with lower degrees
Fig. 5
Fig. 5
Regulated network analysis of specific saline–alkaline stress induced genes. Red and green nodes in the network present up-regulation or downregulation of proteins. Names of the nodes are symbols of proteins. The size of a node is proportional to its degree. Nodes with higher degrees, which means having more neighbors, will have a stronger capacity to modulate adjacent genes than genes with lower degrees
Fig. 6
Fig. 6
The identified differentially expressed proteins using DIA/SWATH method (A) and western blotting verification (B). S indicates replicate in Salinity stress, A for Alkalinity, F for Freshwater and SA for Salinity–Alkalinity

Similar articles

Cited by

References

    1. Ali M, et al. Mapping and quantifying mammalian transcriptomes by RNA-Seq. Nat Methods. 2008;5(7):621–628. doi: 10.1038/nmeth.1226. - DOI - PubMed
    1. Aruna A, et al. Differential expression of hypothalamic and Gill-crh system with osmotic stress in the euryhaline black porgy Acanthopagrus Schlegelii. Front Physiol. 2021;12:768122. doi: 10.3389/fphys.2021.768122. - DOI - PMC - PubMed
    1. Benarous R, Elion J, Labie D. Ca++ binding properties of human prothrombin. Biochimie. 1976;58(4):391–394. doi: 10.1016/S0300-9084(76)80247-7. - DOI - PubMed
    1. Benjamini Y, Hochberg Y. Controlling the false discovery rate: a practical and powerful approach to multiple testing. J Royal Statistical Society Series b: Methodol. 1995;57(1):289–300.
    1. Betts J, et al. Anatomy and Physiology. Houston: Rice University; 2013.