. 2024 Aug;40(3):351-367.
doi: 10.1007/s12550-024-00532-7. Epub 2024 Apr 22.

Maize Aspergillus section Flavi isolate diversity may be distinct from that of soil and subsequently the source of aflatoxin contamination

Affiliations

Maize Aspergillus section Flavi isolate diversity may be distinct from that of soil and subsequently the source of aflatoxin contamination

Bwalya Katati et al. Mycotoxin Res. 2024 Aug.

Abstract

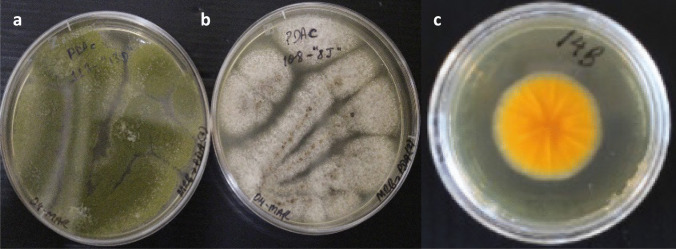
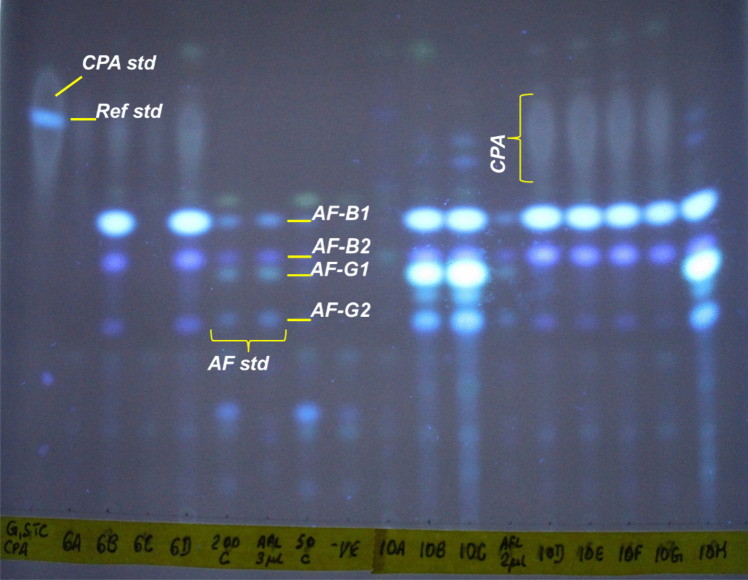
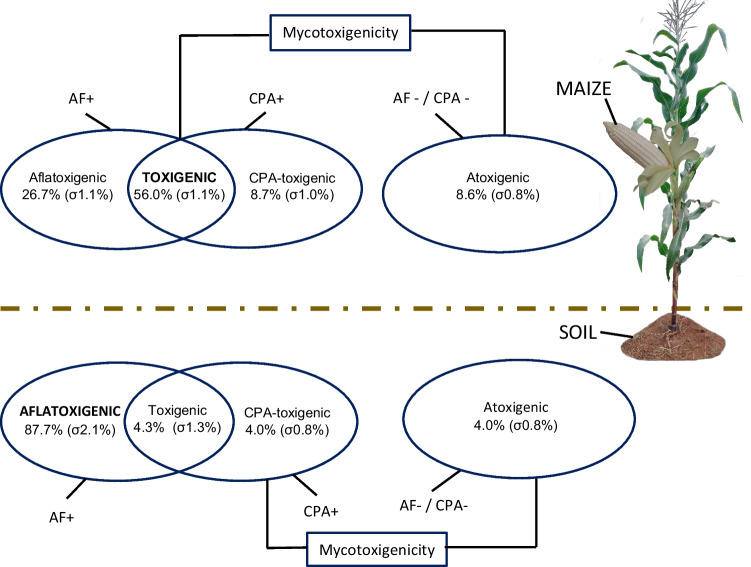
Aspergillus section Flavi (Flavi) is a diverse group of fungal species whose common members include A. flavus and A. parasiticus. These are well-known for the production of aflatoxin (AF) B and G and other toxic metabolites, like cyclopiazonic acid (CPA). They are saprophytic soil dwellers and also become crop opportunistic epiphytes. The consequence is contamination of the crop with mycotoxins, such as carcinogenic AF. We investigated the Flavi community structure of maize and that of their surrounding soil, including their mycotoxigenicity. Furthermore, we investigated the link of the maize Flavi diversity with preharvest maize AF levels. The study was carried out in four selected districts of Zambia, in a low rainfall zone. The Flavi characterisation was triphasic, involving morphological (colony colour and sclerotia formation), metabolic (AF and CPA production) and genetic (calmodulin gene polymorphism) analyses. Flavi abundance was determined by dilution plate technique on modified rose Bengal agar. Results showed that Flavi communities on maize and in soil differed. Maize had a higher Flavi species diversity than soil. A. parasiticus dominated the soil community by frequency of field appearance (85%), while maize was dominated by A. minisclerotigenes (45%). CPA-producers with or without AF production dominated the maize (65%) while producers of only AF (B/G) dominated the soil (88%). The ratio between maize A. parasiticus and A. minisclerotigenes abundance seemed to have had a bearing on the levels of AF in maize, with a ratio close to 1:1 having higher levels than a pure community of either A. parasiticus or A. minisclerotigenes.

Keywords: Aspergillus; Aflatoxin; Cyclopiazonic acid; Maize; Soil.


Conflict of interest statement

The authors declare no competing interests.

Figures

Fig. 1
Fig. 1
The map of Zambia showing sampling locations of maize and soil under 2018/2019 maize growth season from the southerly districts (Kalomo, Kazungula, Livingstone, Mulobezi)
Fig. 2
Fig. 2
Sampling scheme for soil samples. Black boundary shows an example of a maize field perimeter (not drawn to scale; fields varied in size between 1.0 and 2.5 acres) within which soil (and concurrently maize) samples were collected. ‘D1’ and ‘D2’ with black and red arrows are a schematic representation of the transects from which soil portions were collected to generate a composite sample for the field. Blue arrow heads indicate stop point from which a scoop of soil (along with a maize ear) was collected (not drawn to exact number of steps), avoiding collecting soil/maize from the field edges. The Two blue dots indicate the start points for counting of steps before collecting a soil portion/maize ear. A total of 15 scoops per transect were collected. We presume transect D1 an D2 are same
Fig. 3
Fig. 3
Passaged Aspergillus section Flavi isolates from MRB onto PDA medium 90-mm petri dishes (a and b). Macro-morphology shows the end of a 7-day incubation (25 °C, dark) on the PDA. a A. parasiticus isolate MLV13D (short code 13D), with characteristic green shade). b A. minisclerotigenes isolate MKZ08J, with characteristic cream-white colour and visible brown sclerotia. c AFPA medium (36-h incubation, 31 °C, dark) on a 35-mm petri dish. Orange reverse characteristic of macro-morphology of all isolated species in maize belonging to Aspergillus section Flavi. Picture shows A. parasiticus isolate MLV14B
Fig. 4
Fig. 4
Assignment of mycotoxigenicity to isolates. AF, aflatoxin B and/or G; CPA, cyclopiazonic acid; positive ( +) sign indicates production, while negative sign ( −) indicates non-production of the metabolite
Fig. 5
Fig. 5
Example of a developed Thin Layer Chromatography plate visualised under UV (312 nm) to qualitatively determine aflatoxin (AF) B1, G1, B2, G2 as well as cyclopiazonic acid (CPA) from metabolite extracts of maize Flavi. A. parasiticus bands of AF-B and -G toxins without CPA are shown in lane ‘10B’ and ‘10C.’ A. minisclerotigenes bands are shown in lanes ‘10F’ and ‘10G,’ producing AF-B and -G (faint) and CPA bands. Lane ‘200_C’ is a spiked AF standard in medium that was not inoculated with spores. Lane ‘Afl_3μl’ contains pure AFB1, AFG1, AFB2, AFG2 standard, mixed. Lane ‘G,STC_CPA’ is a pure CPA standard spotted together with a griseofulvin standard (griseofulvin is normally used for the determination of the Retardation factor of the metabolites on a TLC plate). Mycotoxigenicity of soil isolates was similarly analysed
Fig. 6
Fig. 6
Phylogeny of Aspergillus species isolates detected in soil (brown with starting letter ‘E,’ n = 25) and maize (green with starting letter ‘M,’ n = 33) of selected southerly districts of Zambia in the 2018/2019 maize growth season. Blue solid lines (n = 2) show corresponding soil and maize isolates from the same field (same numerical value) having no phenotypic (metabolic/morphological) differences and no sequence divergence on the partial calmodulin gene. Purple dotted lines (n = 2) show corresponding soil and maize isolates from the same field having no sequence divergence on the partial calmodulin gene but with phenotypic difference recorded. Rest of isolates had some form of within field differences between the soil and maize Aspergillus species. The metabolic characteristics of each species based on AFB1 and/or AFB2, AFG1 and/or AFG2 and CPA are qualitatively indicated as blue (produced by the species) or white (not produced by the species). Morphological characteristics on the tree are indicated as L, with brown signifying conspicuous brown sclerotia characteristic of L-morphotype, and CC for colony colour with light yellow signifying cream white morphology or green shade signifying green morphology. Unclustered species on the tree include MKA03D—A. flavus and MML17A—A. krugeri. Black for tree branch indicate a longer branch on x -axis than light red. Isolates EKA04B, EKA05A and MKZ06A are highly divergent with branch lengths truncated. The soil isolates (including clones), being dominated by A. parasiticus, mainly produced the AFB and AFG, without detectable CPA (Fig. 6). Only two (non-clonal) CPA producers were detected in soil (Fig. 7). The proportion of CPA producers on maize was significantly higher than in soil (P = 0.020)
Fig. 7
Fig. 7
Proportion of mycotoxigenicity of Flavi detected in soil and on maize kernel. The proportions are expressed as percentages and are based on the geometric mean and geometric standard error (σ). Bold in caps shows the larger percentage of the mycotoxigenicity in the given niche
Fig. 8
Fig. 8
Most frequently detected Aspergillus section Flavi species on maize and in soil. Frequency is expressed as a percentage of the number of fields in which a particular species is detected over total number of fields (n = 20) sampled. ‘n’ is based on total number of the representative proportion of unknown Aspergillus species isolates that were passaged for characterisation
Fig. 9
Fig. 9
Influence of species diversity on levels of AF in field maize. The digits making the regression line are field numbers (n = 10). A modified Shannon diversity index (Hm) equation 1 (Material and methods) was used to calculate species diversity (in an ideal situation, excluding other species, the highest possible Hm value would be 0.69, when the A. parasiticus to A. minisclerotigenes ratio is 1:1)

Similar articles

Cited by

References

    1. Abdollahi A, Buchanan R. Regulation of aflatoxin biosynthesis: induction of aflatoxin production by various carbohydrates. J Food Sci. 1981;46(2):633–635. doi: 10.1111/j.1365-2621.1981.tb04928.x. - DOI
    1. Amaranta C-C, Lethicia MA, Montet D, Lorber S, Puel O, Brabet C. Mycotoxins in Food and Beverages Innovations and Advances Part I. CRC Press; 2021. Biodiversity of aflatoxigenic Aspergillus section Flavi species according to food matrices and geographic areas; pp. 69–115.
    1. Balajee SA, Nickle D, Varga J, Marr KA. Molecular studies reveal frequent misidentification of Aspergillus fumigatus by morphotyping. Eukaryot Cell. 2006;5(10):1705–1712. doi: 10.1128/ec.00162-06. - DOI - PMC - PubMed
    1. Bandyopadhyay R, Ortega-Beltran A, Akande A, Mutegi C, Atehnkeng J, Kaptoge L, Senghor AL, Adhikari BN, Cotty PJ. Biological control of aflatoxins in Africa: current status and potential challenges in the face of climate change. World Mycotoxin J. 2016;9(5):771–789. doi: 10.3920/wmj2016.2130. - DOI
    1. Benard OO, Hunja M, Isabel NW. Isolation and characterisation of aflatoxigenic Aspergillus species from maize and soil samples from selected counties of Kenya. Afr J Microbiol Res. 2013;7(34):4379–4388.

LinkOut - more resources