. 2024 Apr 22;19(4):e0302388.
doi: 10.1371/journal.pone.0302388. eCollection 2024.

The genome regulatory landscape of Atlantic salmon liver through smoltification

Affiliations

The genome regulatory landscape of Atlantic salmon liver through smoltification

Thomas N Harvey et al. PLoS One. .

Abstract

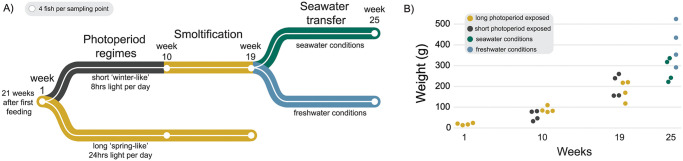
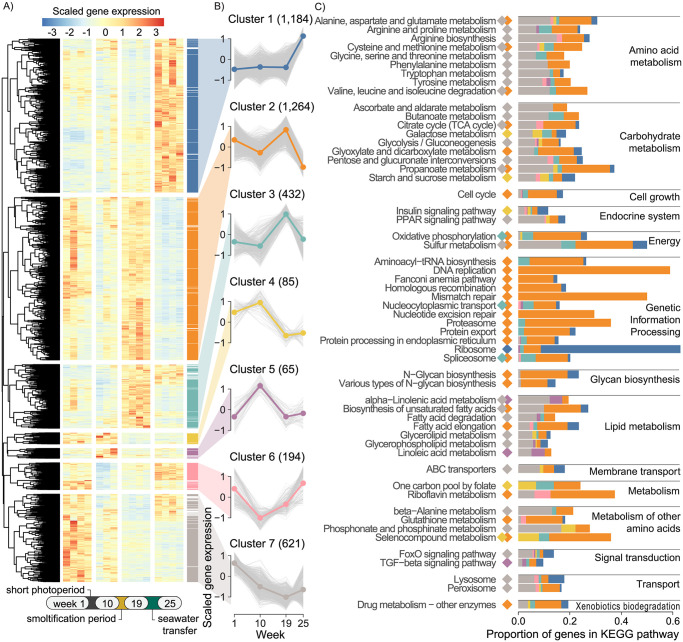
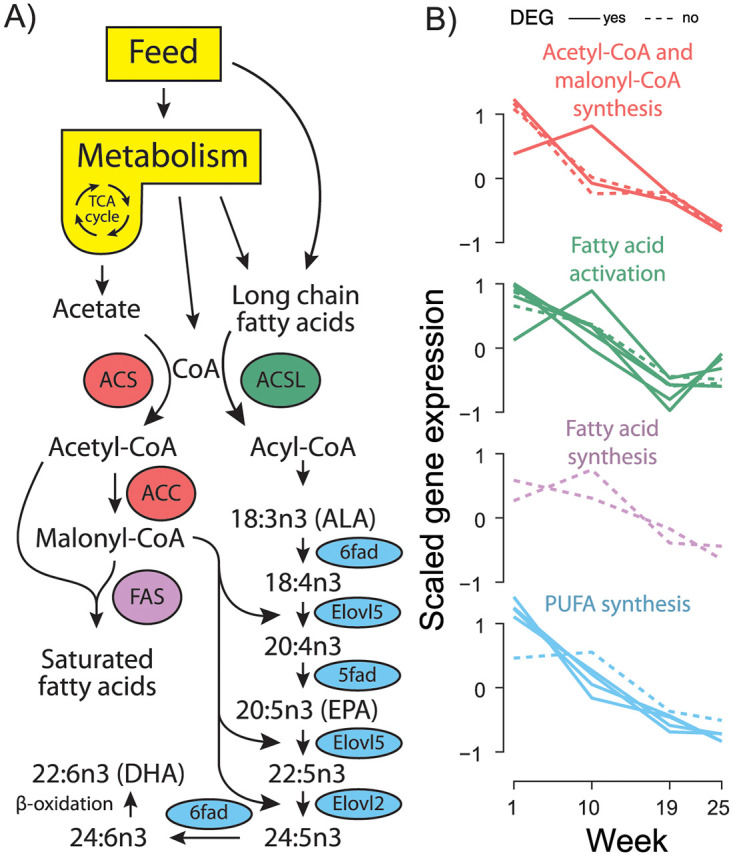
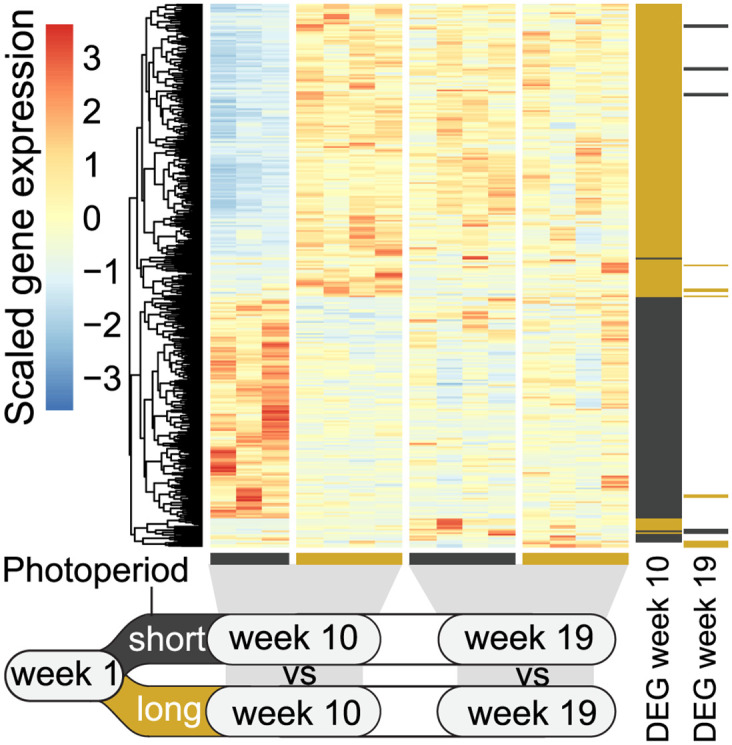
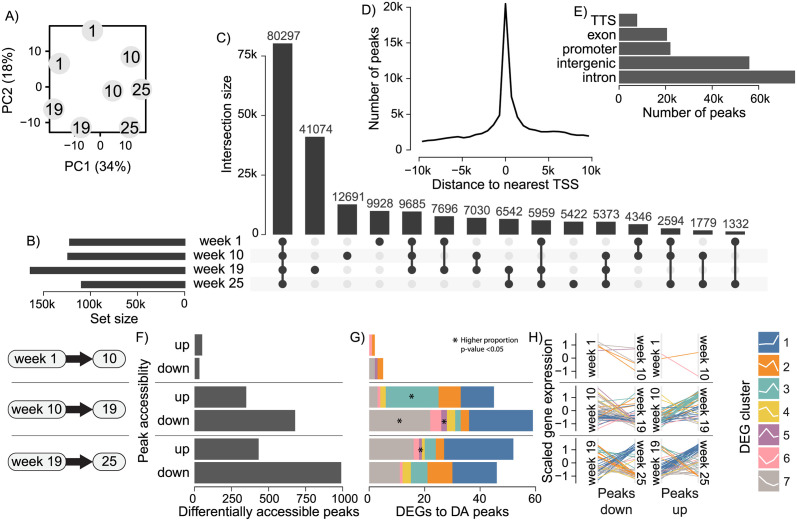
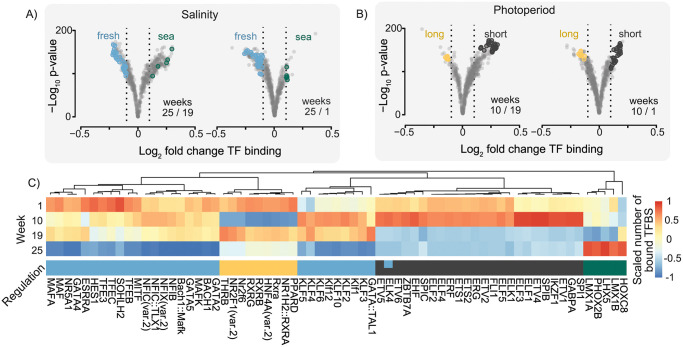
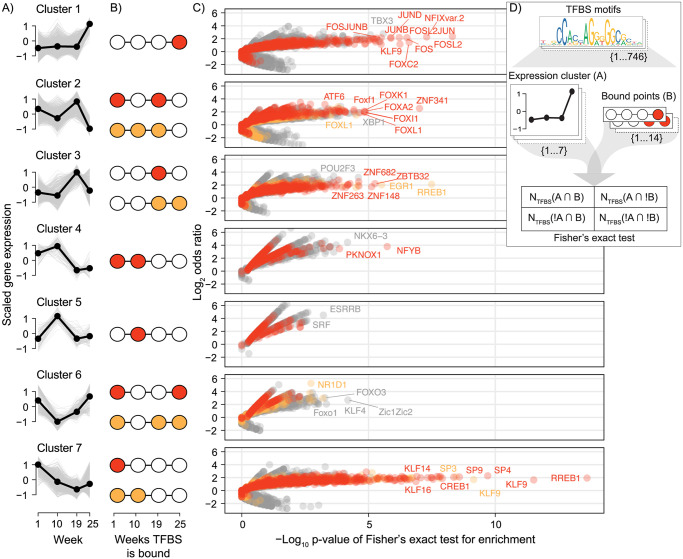
The anadromous Atlantic salmon undergo a preparatory physiological transformation before seawater entry, referred to as smoltification. Key molecular developmental processes involved in this life stage transition, such as remodeling of gill functions, are known to be synchronized and modulated by environmental cues like photoperiod. However, little is known about the photoperiod influence and genome regulatory processes driving other canonical aspects of smoltification such as the large-scale changes in lipid metabolism and energy homeostasis in the developing smolt liver. Here we generate transcriptome, DNA methylation, and chromatin accessibility data from salmon livers across smoltification under different photoperiod regimes. We find a systematic reduction of expression levels of genes with a metabolic function, such as lipid metabolism, and increased expression of energy related genes such as oxidative phosphorylation, during smolt development in freshwater. However, in contrast to similar studies of the gill, smolt liver gene expression prior to seawater transfer was not impacted by photoperiodic history. Integrated analyses of gene expression, chromatin accessibility, and transcription factor (TF) binding signatures highlight chromatin remodeling and TF dynamics underlying smolt gene regulatory changes. Differential peak accessibility patterns largely matched differential gene expression patterns during smoltification and we infer that ZNF682, KLFs, and NFY TFs are important in driving a liver metabolic shift from synthesis to break down of organic compounds in freshwater. Overall, chromatin accessibility and TFBS occupancy were highly correlated to changes in gene expression. On the other hand, we identified numerous differential methylation patterns across the genome, but associated genes were not functionally enriched or correlated to observed gene expression changes across smolt development. Taken together, this work highlights the relative importance of chromatin remodeling during smoltification and demonstrates that metabolic remodeling occurs as a preadaptation to life at sea that is not to a large extent driven by photoperiod history.


Conflict of interest statement

The authors have declared that no competing interests exist.

Figures

Fig 1
Fig 1. Salmon growth over time.
Schematic of the experimental design and weight of salmon over time. Fish were reared for 21 weeks after first feeding in constant light conditions prior to week 1 sampling. The short photoperiod group (black, solid line) was exposed to a 8 hours light per day before being switched back to constant light and sampled at week 10. After a smoltification period, fish were sampled at week 19, then transferred to seawater conditions and sampled lastly at week 25. A long photoperiod group (grey, dashed line) received constant light throughout the experiment, and a freshwater control group branched off from the short photoperiod group by remaining in freshwater. Four fish were sampled randomly at each timepoint for RNA-seq. Two of those sampled fish were used for ATAC-seq and two additional fish for RRBS per timepoint.
Fig 2
Fig 2. Global gene expression changes across salmon life-stage.
A) Relative liver expression of genes differentially expressed between any time point in the fish cohort that experienced short photoperiod fish followed by seawater transfer (FDR <0.05). Scaled expression is denoted as gene-scaled transcripts per million. Genes were partitioned into seven co-expression clusters by hierarchical clustering. Colored bars indicate cluster membership when correlation to the mean cluster pattern was >0.5. Genes with correlation = <0.5 were excluded. B) Gene expression trends over time by cluster. Colored line indicates mean relative expression while grey lines are individual genes within the cluster. C) KEGG pathway enrichment by cluster. Colored diamonds indicate for pathways which clusters they are significantly enriched in (adjusted p <0.05). Colored bars indicate the proportion of genes within the pathways that are in clusters.
Fig 3
Fig 3. Expression of key lipid metabolism genes across the parr-smolt transition.
A) Schematic of the lipid biosynthesis pathway in Atlantic salmon. B) Relative expression of genes in the pathway over time. Acetyl-CoA and malonyl-CoA synthesis (red) displays genes acc1, acs2l-1, acs2l-2, and acs2l-3. Fatty acid activation (green) displays genes acsl1, acsl3l-1, acsl3l-2, acsl3l-3, acsl4, acsl4l-1, acsl4l-2. Fatty acid synthesis (purple) displays gene fas1 and fas2. Poly unsaturated fatty acid (PUFA) synthesis (blue) displays genes 5fad, 6fada, 6fadb, elovl2, and elovl5b. Genes found differentially expressed (FDR<0.05) across life stages (Fig 2A) have a solid line and those not significant a dotted line.
Fig 4
Fig 4. Gene expression changes in response to photoperiod history.
Relative liver expression of differentially expressed genes (DEGs, FDR <0.05) between the short photoperiod group and long photoperiod group at weeks 10 and 19. Genes are marked to the right if differentially expressed higher (black) or lower (yellow) in response to a short photoperiod at weeks 10 and/or 19.
Fig 5
Fig 5. Comparison of chromatin accessibility across life-stage.
A) Similarity of ATAC-seq samples at different weeks by principal component (PC) analysis of read counts within a unified set of ATAC peaks (shared and unique between weeks). B) Number of ATAC peaks called at each week. C) Number of peaks intersecting between sets or unique to each week. D) Distribution of distances (in base pairs, max absolute distance of 10kb) of unified peaks to the nearest gene transcription start site (TSS). E) Genomic locations of unified peaks. F) Number of differentially accessible (DA) peaks between key life-stages with significant (FDR <0.05) fold change up or down in reads overlapping unified peak set. G) Number of differentially expressed genes (DEGs) associated by closest proximity to the DA peaks, colored by co-expression cluster membership. Proportions of gene clusters significantly greater (p-value <0.05) between up and down DA peaks are marked by an asterisks (*), tested by Fisher’s exact test. H) Expression trends across weeks of the DEGs to DA peaks down or up, colored by cluster membership.
Fig 6
Fig 6. Genome wide changes in transcription factor activities across key life stages.
Volcano plots show genome wide fold changes and significance for transcription factor binding site (TFBS) binding scores between A) fresh- to saltwater weeks and B) short to long photoperiod weeks. Transcription factor (TF) motifs with significant changes in global binding scores (absolute log2 fold change >0.1) across each contrast are colored. C) Heatmap shows the scaled number of total bound TFBS across the weeks for the TF motifs that are significant in A) and B). The ‘regulation’ color indicates in which environment the TF motif had the greater TFBS binding score, freshwater (blue), seawater (green), long photoperiod (yellow), or short photoperiod (black).
Fig 7
Fig 7. Enrichment of transcription factor binding patterns within gene expression clusters.
A) Gene expression trends of clusters from Fig 1. B) Assumed weeks the transcription factor binding sites (TFBS) near genes in the cluster would be bound by a transcription factor (TF) to regulate transcription at the weeks of highest expression. A primary and secondary assumed binding pattern is colored red and orange respectively. C) For each set of genes in a cluster, each TF was tested if the TFBS near to those genes were enriched for any combination of binding pattern. Fisher’s exact test results for all TF-binding pattern combinations are plotted per cluster as odds ratios against the significance. The test results for the assumed primary and secondary binding patterns in B) are colored red and orange, respectively. A top proportion of the most significant TFs (in a top quantile per test) are labeled. D) Diagram showing how each combination of TFBS motif, expression cluster, and binding pattern was tested for enrichment with a Fisher’s exact test.

References

    1. Hoar WS. 4 The Physiology of Smolting Salmonids. In: Hoar WS, Randall DJ, editors. Fish Physiology. 11: Academic Press; 1988. p. 275–343.
    1. McCormick SD, Moriyama S, Björnsson BT. Low temperature limits photoperiod control of smolting in Atlantic salmon through endocrine mechanisms. American Journal of Physiology-Regulatory, Integrative and Comparative Physiology. 2000;278(5):R1352–R61. doi: 10.1152/ajpregu.2000.278.5.R1352 . - DOI - PubMed
    1. Iversen M, Mulugeta T, Gellein Blikeng B, West AC, Jørgensen EH, Rød Sandven S, et al.. RNA profiling identifies novel, photoperiod-history dependent markers associated with enhanced saltwater performance in juvenile Atlantic salmon. PLOS ONE. 2020;15(4):e0227496. doi: 10.1371/journal.pone.0227496 - DOI - PMC - PubMed
    1. McCormick SD, Regish AM, Christensen AK. Distinct freshwater and seawater isoforms of Na+/K+-ATPase in gill chloride cells of Atlantic salmon. J Exp Biol. 2009;212(24):3994–4001. doi: 10.1242/jeb.037275 - DOI - PubMed
    1. West AC, Mizoro Y, Wood SH, Ince LM, Iversen M, Jørgensen EH, et al.. Immunologic Profiling of the Atlantic Salmon Gill by Single Nuclei Transcriptomics. Frontiers in Immunology. 2021;12. doi: 10.3389/fimmu.2021.669889 - DOI - PMC - PubMed

Publication types