

Trends in Orthopaedic Surgery Workforce Diversity: Analyzing Changes Over Time
- PMID: 38648423
- PMCID: PMC11037730
- DOI: 10.5435/JAAOSGlobal-D-24-00038
Trends in Orthopaedic Surgery Workforce Diversity: Analyzing Changes Over Time
Abstract
Introduction: There are many reasons why orthopaedic surgeons move or change careers. We asked the questions: (1) What is the geographic distribution of orthopaedic surgeons with respect to age, sex, and race and ethnicity? (2) How has our workforce changed over time with regard to these factors? (3) Are there any patterns or trends detected regarding policy or regulatory events that coincide with these differences?
Methods: The American Academy of Orthopaedic Surgeons surveys over 30,000 members, collecting data on demographics, age, race sex, and practice statistics. We calculated geographic distributions and evaluated these differences over time-potential influences from malpractice suits or tort reform were investigated.
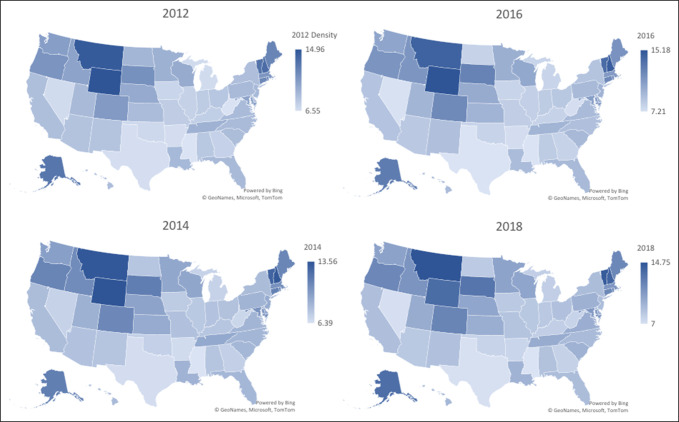
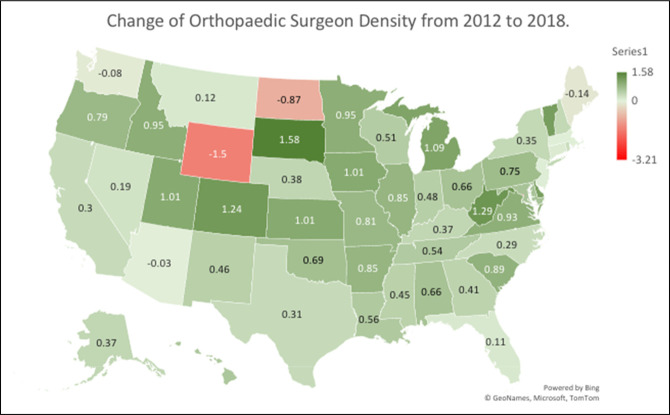
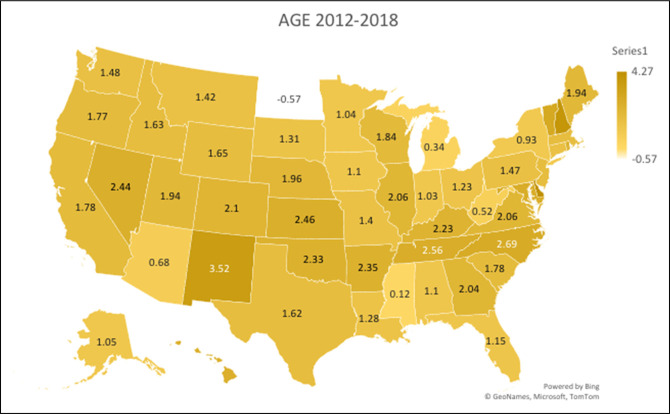
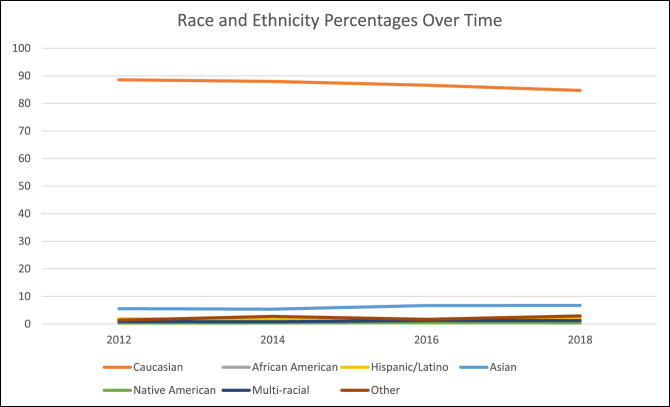
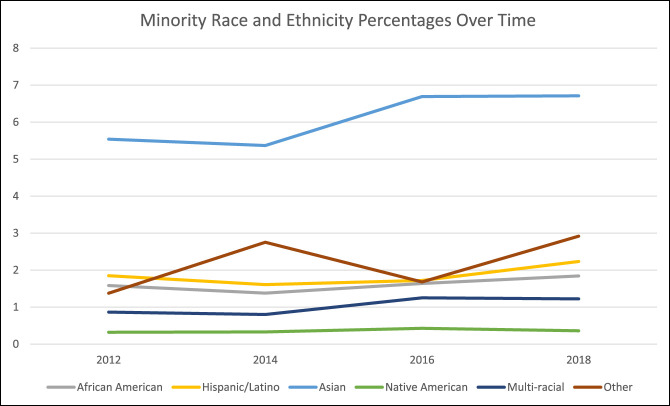
Results: Overall surgeon density increased over time. The largest negative changes were noted in District of Columbia, Wyoming, and North Dakota and positive changes in Colorado, South Dakota, and West Virginia. Age across all states increased (mean 1.7 years). Number of female surgeons increased in most states (4.6% to 5.7%). Number of African Americans increased from 1.6% to 1.8%, Hispanic/LatinX from 1.8% to 2.2%, Asian from 5.5% to 6.7%, and multiracial from 0.8% to 1.2%. No change was noted in the percentage of Native American surgeons.
Discussion: Surgeon density increased from 2012 to 2018; the cause for this change was not evident. Small increases in surgeon population, female surgeons, and in some underrepresented minorities were seen.
Copyright © 2024 The Authors. Published by Wolters Kluwer Health, Inc. on behalf of the American Academy of Orthopaedic Surgeons.
Conflict of interest statement
Each author certifies that he or she has no commercial associations (eg, consultancies, stock ownership, equity interest, patent/licensing arrangements, etc.) that might pose a conflict of interest in connection with the submitted article.
Figures


Similar articles
-
Analysis of the diversity pipeline for the orthopedic trauma surgeon workforce in the United States.Injury. 2024 Aug;55(8):111695. doi: 10.1016/j.injury.2024.111695. Epub 2024 Jun 21. Injury. 2024. PMID: 38959676
-
Diversity based on race, ethnicity, and sex between academic orthopaedic surgery and other specialties: a comparative study.J Bone Joint Surg Am. 2010 Oct 6;92(13):2328-35. doi: 10.2106/JBJS.I.01482. J Bone Joint Surg Am. 2010. PMID: 20926728
-
Trends in Race and Sex Representation Among Entering Orthopaedic Surgery Residents: A Continued Call for Active Diversification Efforts.J Am Acad Orthop Surg. 2023 Jun 15;31(12):e530-e539. doi: 10.5435/JAAOS-D-22-01007. Epub 2023 Apr 14. J Am Acad Orthop Surg. 2023. PMID: 37071884
-
Is Our Science Representative? A Systematic Review of Racial and Ethnic Diversity in Orthopaedic Clinical Trials from 2000 to 2020.Clin Orthop Relat Res. 2022 May 1;480(5):848-858. doi: 10.1097/CORR.0000000000002050. Epub 2021 Dec 2. Clin Orthop Relat Res. 2022. PMID: 34855650 Free PMC article.
-
An Updated Demographic Profile of Orthopaedic Surgery Using a New ABOS Data Set.JB JS Open Access. 2025 Jan 21;10(1):e24.00122. doi: 10.2106/JBJS.OA.24.00122. eCollection 2025 Jan-Mar. JB JS Open Access. 2025. PMID: 39840286 Free PMC article. Review.
Cited by
-
Exploring Applicants' Perceptions of the Social Media Presence of Orthopedic Surgery Residency Programs.Cureus. 2025 Jan 4;17(1):e76914. doi: 10.7759/cureus.76914. eCollection 2025 Jan. Cureus. 2025. PMID: 39902017 Free PMC article.
References
-
- Sauder N, Emara AK, Rullán PJ, Molloy RM, Krebs VE, Piuzzi NS: Hip and knee are the most litigated orthopaedic cases: A Nationwide 5-year Analysis of medical malpractice claims. J Arthroplasty 2023;38:S443-S449. - PubMed
-
- Rynecki ND, Coban D, Gantz O, et al. : Medical malpractice in orthopedic surgery: A westlaw-based demographic Analysis. Orthopedics 2018;41:e615-e620. - PubMed
-
- Teuscher DD: Developing a New Strategic Plan. AAOS Now, 2014. https://www.aaos.org/aaosnow/2014/jul/youraaos/youraaos4/, Accessed October 25, 2023.
