. 2024 Apr 30;38(8):e23606.
doi: 10.1096/fj.202302260RR.

Rhodopsin mislocalization drives ciliary dysregulation in a novel autosomal dominant retinitis pigmentosa knock-in mouse model

Affiliations

Rhodopsin mislocalization drives ciliary dysregulation in a novel autosomal dominant retinitis pigmentosa knock-in mouse model

Shimpei Takita et al. FASEB J. .

Abstract

Rhodopsin mislocalization encompasses various blind conditions. Rhodopsin mislocalization is the primary factor leading to rod photoreceptor dysfunction and degeneration in autosomal dominant retinitis pigmentosa (adRP) caused by class I mutations. In this study, we report a new knock-in mouse model that harbors a class I Q344X mutation in the endogenous rhodopsin gene, which causes rod photoreceptor degeneration in an autosomal dominant pattern. In RhoQ344X/+ mice, mRNA transcripts from the wild-type (Rho) and RhoQ344X mutant rhodopsin alleles are expressed at equal levels. However, the amount of RHOQ344X mutant protein is 2.7 times lower than that of wild-type rhodopsin, a finding consistent with the rapid degradation of the mutant protein. Immunofluorescence microscopy indicates that RHOQ344X is mislocalized to the inner segment and outer nuclear layers of rod photoreceptors in both RhoQ344X/+ and RhoQ344X/Q344X mice, confirming the essential role of the C-terminal VxPx motif in promoting OS delivery of rhodopsin. The mislocalization of RHOQ344X is associated with the concurrent mislocalization of wild-type rhodopsin in RhoQ344X/+ mice. To understand the global changes in proteostasis, we conducted quantitative proteomics analysis and found attenuated expression of rod-specific OS membrane proteins accompanying reduced expression of ciliopathy causative gene products, including constituents of BBSome and axonemal dynein subunit. Those studies unveil a novel negative feedback regulation involving ciliopathy-associated proteins. In this process, a defect in the trafficking signal leads to a reduced quantity of the trafficking apparatus, culminating in a widespread reduction in the transport of ciliary proteins.


Conflict of interest statement

DISCLOSURES

The authors declare no conflicts of interests.

Figures

Figure 1.
Figure 1.. CRISPR/Cas9-mediated knock-in of Q344X mutation in mouse rhodopsin (Rho).
(A) Schematic representation of mouse Rho gene in chromosome 6. The PAM sequences tailored to exon 5 and microhomology template insertion site are indicated along with wild-type and Q344X alleles. The C to T conversion at the 344-position, resulting in the Q344X mutation present in exon 5 of the Rho gene, is highlighted in red. Another silent point mutation C to A in the codon for threonine (T) at the 342 position (highlighted in red) is introduced to prevent the recognition by guide RNA after microhomology template insertion. (B) Validation of CRISPR/Cas9-mediated knock-in of Q344X mutation to the mouse rhodopsin gene (Rho) by sequencing. Upper panel shows wild-type allele with the QVAPA motif. Lower panel shows the Q344X allele with C to G mutation, leading to an early insertion of a stop codon at the 344th position. (C) Partial sequences of exon 5 from the wild-type and Q344X rhodopsin alleles surrounding the BsaI restriction site (GAGACC) highlighted by the shaded rectangle. In the RhoQ344X allele, the introduced silent point mutation in the codon for threonine (T) at position 342 resulted in the loss of the BsaI restriction site. Lane 1, undigested PCR fragment from a RhoQ344X/+ knock-in mouse; lane 2, same PCR fragment as lane 1 digested with BsaI; lane3, undigested PCR fragment from a wild-type mouse; lane 4, same PCR fragment as lane 3 digested with BsaI. Upon a digestion with BsaI, a 598 bp PCR product of wild-type allele (lane 2, upper and lower fragments, respectively) was digested into two fragments (lane 4, 318 bp and 280 bp). (D) Ratio of wild-type and Q344X mutant rhodopsin mRNA expression in the RhoQ344X/+ knock-in retina. PCR product from RhoQ344X/+ retinal cDNA was either undigested or digested with BsaI (left panel, - and +, respectively). Using real-time quantitative PCR, relative amounts of wild-type and Q344X mutant mRNA were compared (n = 3 animals). There is no significant difference in the mRNA expression levels between wild-type and Q344X mutant alleles (48.6 ± 3.6 % for wild-type and 51.5 ± 8.6 % for RhoQ344X mRNA). ns: not significant (p = 0.6164)
Figure 2.
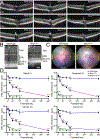
Figure 2.. OCT analyses of class I RhoQ344X knock-in mutant mouse indicate degeneration of photoreceptor neurons.
(A) OCT images for the ventral and dorsal regions including the optic nerve head (ONH) were acquired for wild-type, RhoQ344X/+, and RhoQ344X/Q344X mice at P21, P60, and P120. ONLs are indicated by red vertical bars. Scale bars, 100 μm. (B) OCT images from P60 wild-type and RhoQ344X/+ mice at the locations 500 μm away from the ONH are shown. ELM, external limiting membrane; RPE, retinal pigment epithelium. Scale bar, 50 μm. (C). The thicknesses of the ONL were measured at four distinct locations situated 500 μm away from the ONH, as illustrated in the fundus images of wild-type and RhoQ344X/+ mice. (D) ONL thicknesses were compared among wild-type (blue), RhoQ344X/+ (magenta), and RhoQ344X/Q344X (green) mice in four distinct regions (nasal, temporal, ventral, and dorsal) as indicated in (C). The thicknesses of the ONL were plotted as a function of postnatal days (P21 – 360), and the data were presented as mean ± SD (n = 4 animals for each genotype). The data were subjected to statistical analysis using two-way ANOVA, followed by Tukey’s post-hoc test for pairwise comparisons. Significant differences (****, p < 0.0001) were observed when comparing wild-type mice to RhoQ344X/+ or RhoQ344X/Q344X mice.
Figure 3.
Figure 3.. Histological analysis of photoreceptor cell loss in P35 and 90 RhoQ344X/+ mice.
(A) Retinal sections from wild-type and RhoQ344X/+ mice, aged P35 and P90, were labeled with Hoechst 33342 (blue) to visualize their nuclear layers. RPE: retinal pigmented epithelium, OS: outer segments, IS: inner segments, ONL: outer nuclear layer, INL: inner nuclear layer, GCL: ganglion cell layer. Scale bar, 20 μm. (B) Thicknesses in the ONL were measured every 150 μm on the dorsal and ventral sides of the ONHs. The data show a progressive reduction of ONL thickness in Rho Q344X/+ mice due to the loss of photoreceptor cells from P35 to P90. Data were shown as mean ± SD for P35 and P90 (n = 4). The data were analyzed using two-way ANOVA. For pair-wise comparison of wild-type and RhoQ344/+ mice, the Šídák method was utilized to calculate p-values comparing wild-type to RhoQ344X/+ mice. Statistical significance (****, p < 0.0001; ***, p < 0.001; **, p < 0.01) is indicated above each data point. ns: not significant (p > 0.01). (C) Retinal sections from P21 RhoQ344X/Q344X mice were labeled with Hoechst 33342 (blue) to visualize their nuclear layers (left panel). Retinal sections from P21 RhoQ344X/Q344X mice were subjected to immunofluorescence labeling using antibodies against rhodopsin (B6–30, green) and a photoreceptor OS marker, Pde6γ (red), to label OS (right panels). DIC, differential interference contrast. (D) Thicknesses of the OS layers from P35 wild-type mice, P35 RhoQ344X/+ mice, and P21 RhoQ344X/Q344X mice were measured every 150 μm on the dorsal and ventral sides of the ONH. Data were presented as mean ± SD (n = 4 mice) for all the genotypes. The data were analyzed using two-way ANOVA. For pairwise comparisons, Dunnett’s multiple comparison test was utilized to calculate p-values (wild-type vs. RhoQ344X/+ or wild-type vs. RhoQ344X/Q344X, ****, p < 0.0001), as indicated above each data point.
Figure 4.
Figure 4.. Rhodopsin mislocalization in RhoQ344X knock-in mice.
(A) Retinal sections from wild-type, and RhoQ344X/+, and RhoQ344X/Q344X were subjected to immunofluorescent labeling using the 1D4 antibody (red). As the 1D4 recognizes the Ct epitope only present in wild-type rhodopsin protein, signals were only observed in wild-type and RhoQ344X/+ mice. Mice were studied at P24 and P62 or 63. Rhodopsin is observed mainly in the OS of wild-type mice, whereas it is also mildly mislocalized to IS, ONL and OPL in RhoQ344X/+ mice both at P24 and P62/63. OPL: outer plexiform layer (B) Retinal sections from wild-type, RhoQ344X/+, and RhoQ344X/Q344X were subjected to immunofluorescent labeling using B6–30 antibody (red). As B6–30 recognizes the Nt epitope preserved both in wild-type and RHOQ344X mutant rhodopsin, signals were observed in wild-type, RhoQ344X/+, and RhoQ344X/Q344X mice. Both at P24 and P62/63, signals are observed mainly in the OS of wild-type mice, whereas they are also observed in IS, ONL, and OPL of RhoQ344X/+ mice. RHOQ344X mutant rhodopsin is significantly mislocalized to IS, ONL, OPL of RhoQ344X/Q344X mice. Nuclei were labeled with Hoechst 33342 (blue). Scale bars, 20 μm.
Figure 5.
Figure 5.. Rhodopsin expression is remarkably downregulated in the RhoQ344X/+ retina at P35.
Quantitative immunoblotting analysis was conducted using anti-rhodopsin monoclonal antibodies, B6–30 (Nt-specific) and 1D4 (Ct-specific) (n = 4 mice per genotype). Anti-β-tubulin was employed for loading controls. For quantification of signals originating from rhodopsin, we selected the regions corresponding to monomeric and dimeric forms of rhodopsin. (A) B6–30 recognizes wild-type, RHOQ344X, and RHOP23H mutant rhodopsin on retinal homogenates from wild-type, RhoQ344X/+, and RhoP23H/+ mice. Based on the analysis, total rhodopsin in the retina is significantly decreased in RhoQ344X/+, and RhoP23H/+ retinas. (B) The 1D4 antibody recognizes wild-type and RHOP23H but is incapable of binding to RHOQ344X, which lacks the Ct 5 amino acids. Based on the analysis, wild-type and RHOP23H are significantly decreased in RhoQ344X/+, and RhoP23H/+ retinas. (C) The quantities of RHOQ344X in RhoQ344X/+ retinas were calculated and compared to those of wild-type rhodopsin based on the difference in immunoblot signal intensities generated by B6–30 and 1D4 antibodies.
Figure 6.
Figure 6.. NKA expression is downregulated and GFAP expression is upregulated in the P35 RhoQ344X/+ retinas.
(A and B) Retinal sections from wild-type (A) and RhoQ344X/+ (B) mice were subjected to immunofluorescence labeling using antibodies against NKA (red) and ROM1 (green), a photoreceptor OS marker. Nuclei were labeled with Hoechst 33342 (blue). NKA is localized to the ISs and other regions of photoreceptors but is not observed in the OSs. (C) Immunofluorescence originating from NKA was quantitated in IS, INL and GCL spanning 227 μm of retina length. Average intensities measured for RhoQ344X/+ were normalized to those for wild-type and the data expressed as mean ± SD (n = 4 animals for each genotype). The data were subjected to statistical analysis using unpaired t-test for comparisons. Significant differences (*, p < 0.05) were observed when comparing fluorescence intensity from inner segment of wild-type mice to RhoQ344X/+ mice. ns: not significant (p > 0.05). (D and E) Retinal sections from wild-type (C) and RhoQ344X/+ (D) mice were subjected to immunofluorescence labeling using antibodies against GFAP (green), a marker for astrocytes and Müller cell-mediated reactive gliosis. Nuclei were labeled with Hoechst 33342 (blue). Müller cell-mediated gliosis was activated in the P35 RhoQ344X/+ retina. Scale bars, 20 μm.
Figure 7.
Figure 7.. Differentially expressed proteins show rod outer segment proteins are downregulated in the RhoQ344x/+ retina at P35.
(A) A volcano plot for the identified proteins. X-axis shows log2-transformed fold change (differential protein expression between wild-type and RhoQ344X/+ retinas), and y-axis shows −log10-transformed q-value. For instance, the log2-transformed fold change for Pdap1 is 1.2. This equates to a linear scale fold change of 2.4. A total of 89 proteins (shown in red) were differentially expressed with 2-fold change (log2-transformed change of < −1 or > 1) and q-value < 0.05 thresholds indicated by the vertical and horizontal dashed lines. (B) Pathway analysis for GO terms using the protein abundance with 60% threshold (a total of 93 proteins). Top 20 significantly changed pathways are shown in dot plots from top to bottom for biological process (left, adjusted p < 0.0001), cellular component (middle, adjusted p < 0.005), and molecular function (right, adjusted p < 0.05). The size of each dot within the plots (Count) represents the level of protein enrichment, while the color coding indicates statistical significance (p.adjust). These markers are explained within each plot. (C) Networks illustrating the outcomes of the hypergeometric test and pathway analysis based on gene enrichment are presented. The size of each dot (Count) represents the level of gene enrichment (number of genes), while the color coding indicates statistical significance (p.adjust), as indicated in the bottom right corner of the panel.

Similar articles

Cited by

References

    1. Nir I, and Papermaster DS (1986) Immunocytochemical localization of opsin in the inner segment and ciliary plasma membrane of photoreceptors in retinas of rds mutant mice. Invest Ophthalmol Vis Sci 27, 836–840 - PubMed
    1. Bowes C, van Veen T, and Farber DB (1988) Opsin, G-protein and 48-kDa protein in normal and rd mouse retinas: developmental expression of mRNAs and proteins and light/dark cycling of mRNAs. Exp Eye Res 47, 369–390 - PubMed
    1. Nir I, Agarwal N, Sagie G, and Papermaster DS (1989) Opsin distribution and synthesis in degenerating photoreceptors of rd mutant mice. Exp Eye Res 49, 403–421 - PubMed
    1. Lewis GP, Erickson PA, Anderson DH, and Fisher SK (1991) Opsin distribution and protein incorporation in photoreceptors after experimental retinal detachment. Exp Eye Res 53, 629–640 - PubMed
    1. Edward DP, Lim K, Sawaguchi S, and Tso MO (1993) An immunohistochemical study of opsin in photoreceptor cells following light-induced retinal degeneration in the rat. Graefes Arch Clin Exp Ophthalmol 231, 289–294 - PubMed

Publication types

LinkOut - more resources