. 2024 Apr 2;16(4):evae061.
doi: 10.1093/gbe/evae061.

Extensive Loss and Gain of Conserved Noncoding Elements During Early Teleost Evolution

Affiliations

Extensive Loss and Gain of Conserved Noncoding Elements During Early Teleost Evolution

Elisavet Iliopoulou et al. Genome Biol Evol. .

Abstract

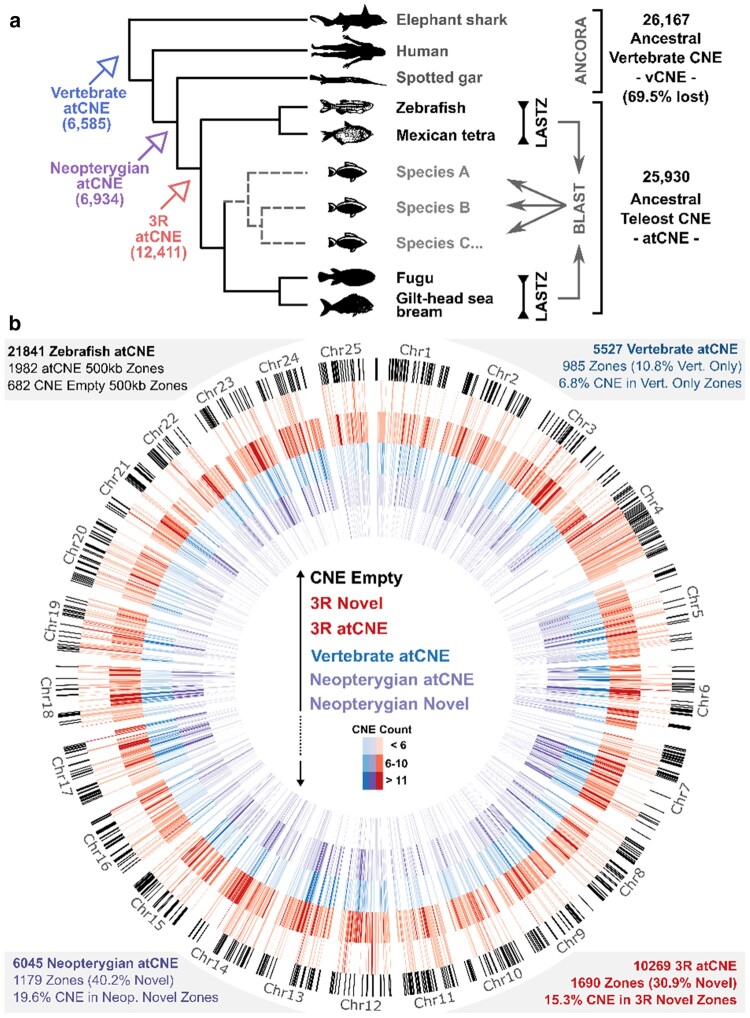
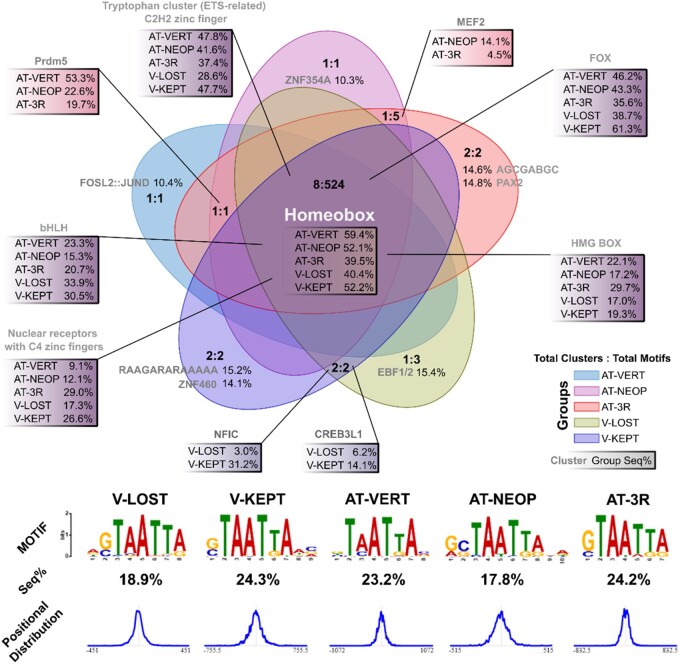
Conserved noncoding elements in vertebrates are enriched around transcription factor loci associated with development. However, loss and rapid divergence of conserved noncoding elements has been reported in teleost fish, albeit taking only few genomes into consideration. Taking advantage of the recent increase in high-quality teleost genomes, we focus on studying the evolution of teleost conserved noncoding elements, carrying out targeted genomic alignments and comparisons within the teleost phylogeny to detect conserved noncoding elements and reconstruct the ancestral teleost conserved noncoding elements repertoire. This teleost-centric approach confirms previous observations of extensive vertebrate conserved noncoding elements loss early in teleost evolution, but also reveals massive conserved noncoding elements gain in the teleost stem-group over 300 million years ago. Using synteny-based association to link conserved noncoding elements to their putatively regulated target genes, we show the most teleost gained conserved noncoding elements are found in the vicinity of orthologous loci involved in transcriptional regulation and embryonic development that are also associated with conserved noncoding elements in other vertebrates. Moreover, teleost and vertebrate conserved noncoding elements share a highly similar motif and transcription factor binding site vocabulary. We suggest that early teleost conserved noncoding element gains reflect a restructuring of the ancestral conserved noncoding element repertoire through both extreme divergence and de novo emergence. Finally, we support newly identified pan-teleost conserved noncoding elements have potential for accurate resolution of teleost phylogenetic placements in par with coding sequences, unlike ancestral only elements shared with spotted gar. This work provides new insight into conserved noncoding element evolution with great value for follow-up work on phylogenomics, comparative genomics, and the study of gene regulation evolution in teleosts.

Keywords: CNE; conserved noncoding elements; enhancer evolution; teleost comparative genomics; whole-genome duplication.


Figures

Fig. 1.
Fig. 1.
Teleost ancestral CNE identification and distribution. a) CNE sets from pairwise whole-genome alignments in two focal reference genome pairs (LASTZ) were searched in 20 other teleost genomes via BLAST, identifying 25,930 atCNEs that were present in the teleost common ancestor. Comparison to nonteleost vertebrate genomes and ancestral vertebrate CNEs from the ANCORA database revealed widespread loss of vertebrate atCNEs and gain of novel atCNEs in Neopterygians and Teleosts (3R). b) Distribution and count of 21,841 atCNEs over 1,982 500 kb-long zones in the zebrafish genome. From largest (outermost) to smallest (innermost) circle radius: (1) Genomic regions with no atCNE presence (black). (2) Novel zones with 3R atCNE presence (red) and absence of older (Neopterygian or vertebrate) atCNE. (3) Zones with 3R atCNE presence (red). (4) Zones with vertebrate atCNE presence (blue). (5) Zones with Neopterygian atCNE presence (purple). (6) Novel zones with Neopterygian atCNE presence (purple), and absence of older (Vertebrate) atCNE.
Fig. 2.
Fig. 2.
Ancestral CNE losses across the teleost phylogeny. a) Phylogenetic reconstruction of the relationships of the 24 teleost species included in the study, using single copy universal atCNEs, including (left tree—2,668 atCNEs) or excluding (right tree—4,673 atCNEs) spotted gar. The two basally diverged clades used to infer ancestral teleost CNEs are highlighted: clade 1 (from A. mexicanus to T. tibetana) and clade 2 (from Z. mbuna T. rubripes). Branches with species highlighted in red show topological discrepancies in the spotted gar shared atCNE phylogeny (left). b) Presence/absence of ancestral atCNE categories of different origin (Vertebrate in blue, Neopterygian in purple, 3R in red) across the teleost phylogeny as a percentage of total identified atCNEs. The cladogram is constructed based on phylogenetic reconstructions from (a).
Fig. 3.
Fig. 3.
CNE sequence and synteny conservation. a) PhyloP (CONACC) conservation scores for atCNEs and Genes in D. rerio, O. niloticus, and T. rubripes mapped on D. rerio chromosomes. b) Average phyloP (CONACC) conservation scores and standard deviation for atCNEs in different categories and genes in D. rerio, O. niloticus, and T. rubripes. c) Synteny of atCNEs across eight teleost genomes and L. oculatus.
Fig. 4.
Fig. 4.
CNE–gene target association and paralog analysis. a) CNE were linked to putative target genes through orthology-guided synteny-based association, using the maximal syntenic score (number of species a CNE–gene pair is found within 1 Mb) and minimal proximity rank (position of a gene to a CNE when all genes are ordered in increasing distance) for each CNE-target pair. b) Percentage (and counts within boxes) of ancestral (atCNE also proximal to orthologous locus in human) or novel gene targets for atCNEs in different categories. c) Paralogy cluster and paralog CNE counts for different categories in human/other vertebrates (left) or zebrafish/teleosts (right). Common paralogy clusters between the two groups are shared in black and common/ancestral atCNEs within paralogy clsuters are shown in blue. d) CNE gains, duplications and losses in the OTX1/OTX2 paralogous loci in vertebrates and teleosts. The ancestral OTX locus in stem-vertebrate aOTX had two ancestral vertebrate CNEs (aOTX_Va & aOTX_Vb). Paralogous copies of these elements are found in human OTX1 (OTX1_Va & OTX1_Vb) and OTX2 (OTX2_Va & OTX2_Vb). In zebrafish, OTX1_Va, OTX1_Vb, and OTX2_Vb were lost and the 3R WGD produced two paralogous copies of OTX2_Va (OTX2a_Va & OTX2b_Va). Two Neopterygian gained CNEs in the OTX2 locus (OTX2_Na & OTX2_Nb) also gave rise to two pairs of paralogous elements in the paralogous loci of OTX2a (OTX2a_Na & OTX2a_Nb) and OTX2b (OTX2b_Na & OTX2b_Nb).
Fig. 5.
Fig. 5.
Motif discovery and TFBS enrichment. Top) Overlap of enriched TFBS categories among combinations of atCNEs (AT-VERT: Vertebate—blue, AT-NEOP Neopterygian—purple, AT-GAIN: 3R—red) and avCNEs (V-KEPT: Kept in Teleosts—dark purple, V-LOST: Lost in Teleosts—yellow). Enrichment overlaps are displayed in the format “Total Categories: Total Enriched Motifs” in each overlap area. The percentage of sequences of each CNE group with motifs in representative categories (c1, c2,…) are shown. Bottom) Percentage of sequences in each CNE group that contain the most common shared de novo predicted motif (consensus TAATTA) and its positional distribution.
Fig. 6.
Fig. 6.
Teleost CNE-target localization and models of CNE gain. a) Localization of atCNEs and associated target genes in zebrafish chromosomes. CNE zones are plotted in blue if they contain vertebrate atCNEs, in purple if they contain Neopterygian atCNEs and do not contain vertebrate atCNEs, in red if they contain 3R atCNEs and do not contain any older (vertebrate or Neopterygian) atCNEs. Gene zones are plotted in light gray if they contain ancestral targets or in dark gray if they contain only novel targets and do not contain ancestral targets. b) Two hypothesized scenarios of atCNE gain: scenario 1: Extreme sequence divergence of ancestral sequence renders CNE unrecognizable, while TFBS are preserved and scenario 2: CNE gain through de novo emergence.

References

    1. Altschul SF, Gish W, Miller W, Myers EW, Lipman DJ. Basic local alignment search tool. J Mol Biol. 1990:215:403–410. 10.1016/S0022-2836(05)80360-2. - DOI - PubMed
    1. Armstrong J, Hickey G, Diekhans M, Fiddes IT, Novak AM, Deran A, Fang Q, Xie D, Feng S, Stiller J, et al. Progressive Cactus is a multiple-genome aligner for the thousand-genome era. Nature. 2020:587:246–251. 10.1038/s41586-020-2871-y. - DOI - PMC - PubMed
    1. Babarinde IA, Saitou N. Heterogeneous tempo and mode of conserved noncoding sequence evolution among four mammalian orders. Genome Biol Evol. 2013:5:2330–2343. 10.1093/gbe/evt177. - DOI - PMC - PubMed
    1. Braasch I, Gehrke AR, Smith JJ, Kawasaki K, Manousaki T, Pasquier J, Amores A, Desvignes T, Batzel P, Catchen J, et al. The spotted gar genome illuminates vertebrate evolution and facilitates human-teleost comparisons. Nat Genet. 2016:48:427–437. 10.1038/ng.3526. - DOI - PMC - PubMed
    1. Capella-Gutiérrez S, Silla-Martínez JM, Gabaldón T. trimAI: a tool for automated alignment trimming in large-scale phylogenetic analyses. Bioinformatics. 2009:25:1972–1973. 10.1093/bioinformatics/btp348. - DOI - PMC - PubMed

Publication types