. 2024 Jun 1;41(6):msae078.
doi: 10.1093/molbev/msae078.

The Number and Pattern of Viral Genomic Reassortments are not Necessarily Identifiable from Segment Trees

Affiliations

The Number and Pattern of Viral Genomic Reassortments are not Necessarily Identifiable from Segment Trees

Qianying Lin et al. Mol Biol Evol. .

Abstract

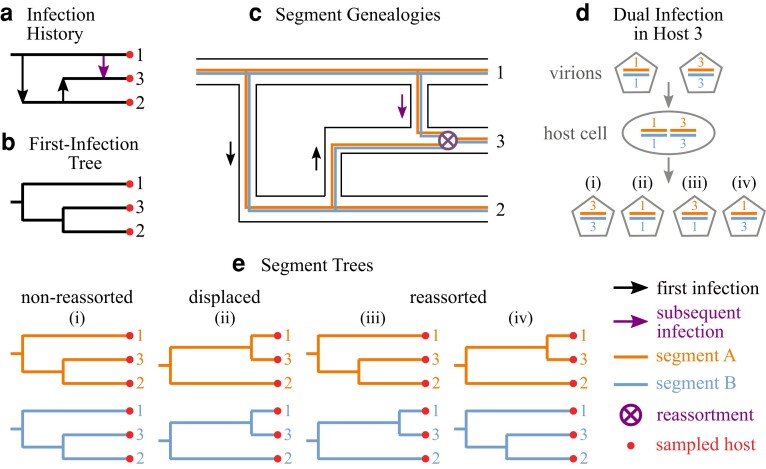
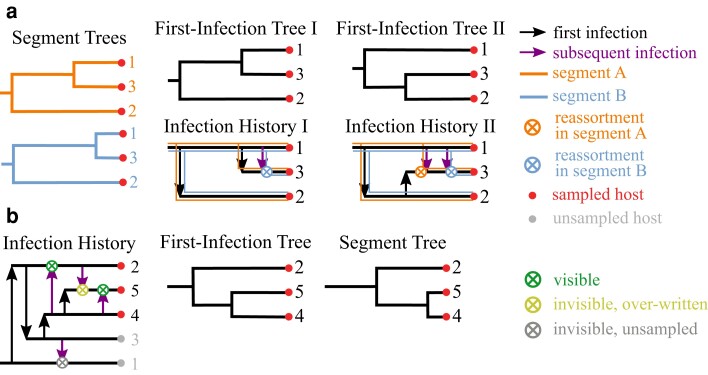
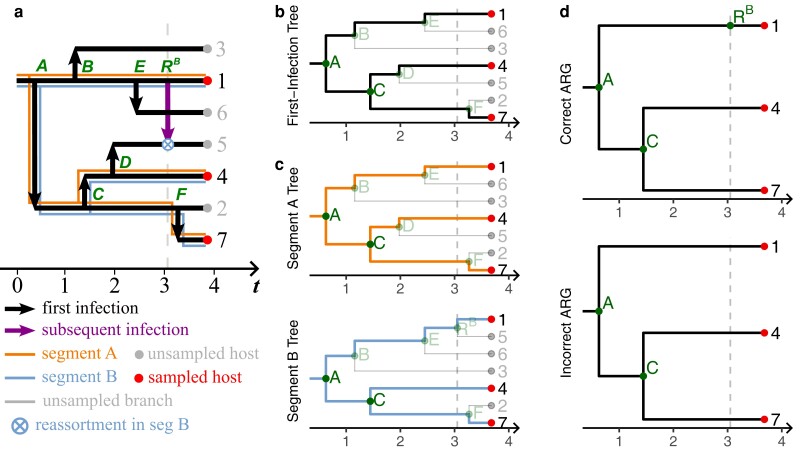
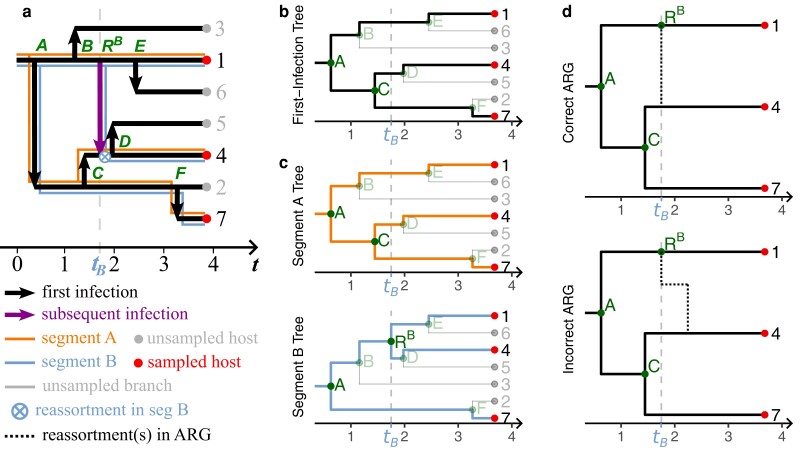
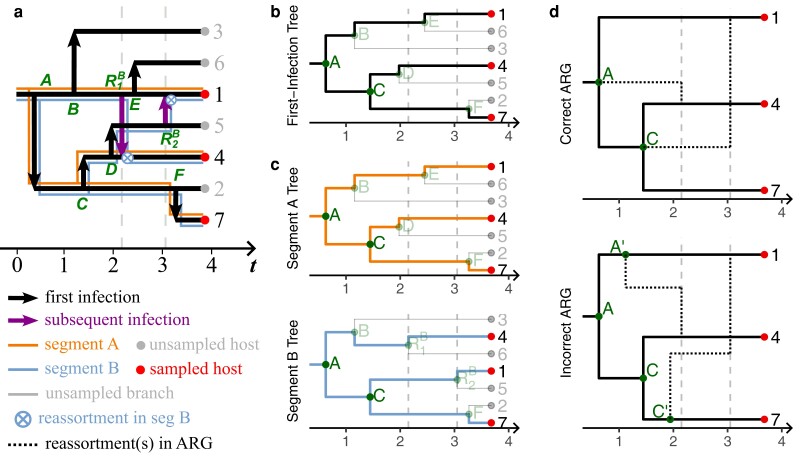
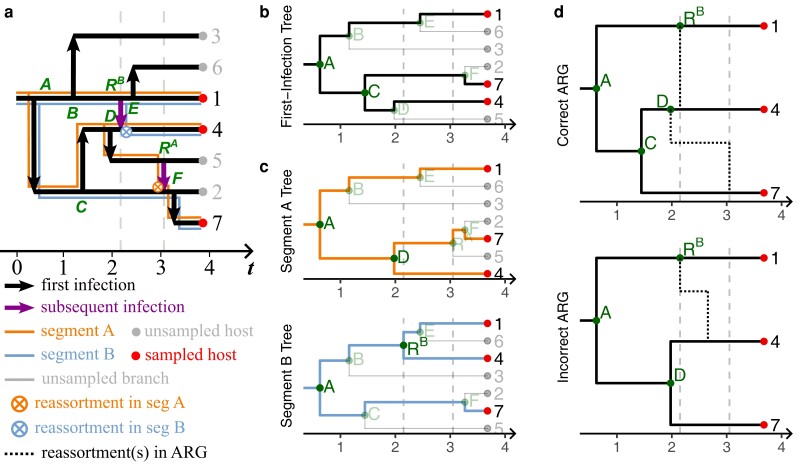
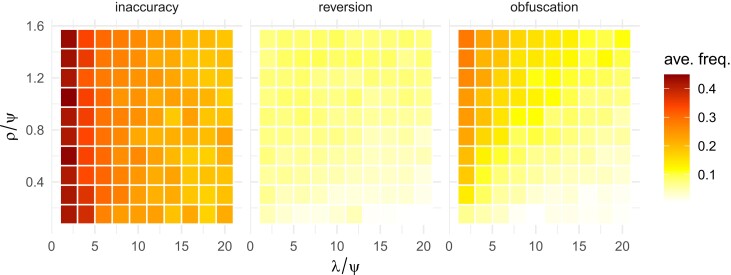
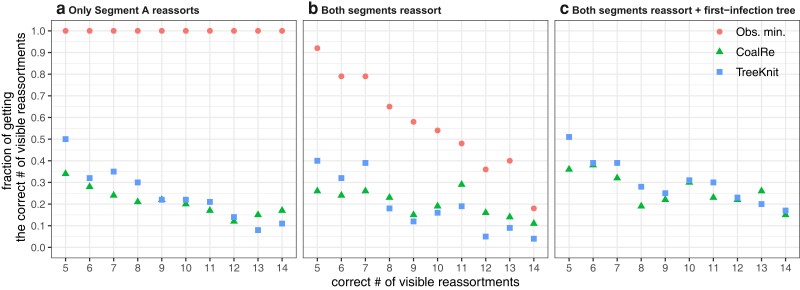
Reassortment is an evolutionary process common in viruses with segmented genomes. These viruses can swap whole genomic segments during cellular co-infection, giving rise to novel progeny formed from the mixture of parental segments. Since large-scale genome rearrangements have the potential to generate new phenotypes, reassortment is important to both evolutionary biology and public health research. However, statistical inference of the pattern of reassortment events from phylogenetic data is exceptionally difficult, potentially involving inference of general graphs in which individual segment trees are embedded. In this paper, we argue that, in general, the number and pattern of reassortment events are not identifiable from segment trees alone, even with theoretically ideal data. We call this fact the fundamental problem of reassortment, which we illustrate using the concept of the "first-infection tree," a potentially counterfactual genealogy that would have been observed in the segment trees had no reassortment occurred. Further, we illustrate four additional problems that can arise logically in the inference of reassortment events and show, using simulated data, that these problems are not rare and can potentially distort our observation of reassortment even in small data sets. Finally, we discuss how existing methods can be augmented or adapted to account for not only the fundamental problem of reassortment, but also the four additional situations that can complicate the inference of reassortment.

Keywords: genomic reassortment; molecular epidemiology; phylodynamics; population genetics.


Conflict of interest statement

Conflict of Interest None declared.

Figures

Fig. 1.
Fig. 1.
Dual infection can lead to reassorted segment trees. Time flows from left to right in panels a), b), c), and e). a) The infection history encompasses all initial and subsequent infection events. In this small example, Host 1 infects Host 2, who then infects Host 3, and later Host 1 infects Host 3. Host 3 is then dually infected. b) The first-infection tree includes first infections of each host, but not subsequent infections or the identities of who infected whom. c) The genealogy of each of the two viral genomic segments can be traced within the infection history. d) Two virions in Host 3, the resident virion in Host 3 originated from the first infection from Host 2, and the invasive virion from the subsequent infection from Host 1, can reassort upon dual infection of a cell within Host 3. e) Depending on which virion is sampled from Host 3, the segment trees may show discordance with one another and/or with the first-infection tree. In outcome (i) the host maintains the viral genotype from its first infection, in (ii) the genotype from the second infection displaces the first, and in (iii) and (iv) a new reassorted viral genotype is generated.
Fig. 2.
Fig. 2.
How the infection history, first-infection tree, and sampling process impact genomic reassortment inference. a) Suppose that two segment trees are sampled. In a special case, First-Infection Tree I arose from Infection History I and is identical to one of the segment trees, so a single reassortment event is visible in the data. However, it could also be the case that First-Infection Tree II resulted from Infection History II, where two reassortment events are visible. Put another way, only one reassortment in segment B is needed to explain the segment trees’ difference from First-Infection Tree I, while one reassortment in each segment is need to explain why they both differ from First-Infection Tree II. b) Of all the reassortment events in the full population (all four shown), only some leave a visible imprint in the data. Reassortment events that occur in unsampled lineages are invisible, as are those that occur in sampled lineages but are over-written by another reassortment event later in the same lineage.
Fig. 3.
Fig. 3.
Invisible reassortment. This figure is an example of an invisible type of reassortment event that arises when a reassortment event either occurs in an unsampled part of the population or is replaced by a later reassortment event in the sampled part of the population. Trees are measured in arbitrary time units increasing from left to right. The full infection history a), first-infection tree b), segment trees c), and ARGs d) are shown. The vertical gray dashed line indicates the time of that reassortment event.
Fig. 4.
Fig. 4.
Inaccurate reassortment. This figure is an example of an inaccurate reassortment event that arises when both children of a reassortment event are sampled creating a node in the segment tree that was caused by reassortment and not a new infection. The full infection history a), first-infection tree b), segment trees c), and ARGs d) are shown. The vertical gray dashed line indicates the time of that reassortment event and in d), the black dotted lines indicate an actual or inferred reassortment in the population.
Fig. 5.
Fig. 5.
Reversed reassortment. This figure is an example of a reversed reassortment event that arises when only one child of a reassortment event is sampled, creating the need for a trifrucating node in the ARG. The full infection history a), first-infection tree b), segment trees c), and ARGs d) are shown. The vertical gray dashed line indicates the time of that reassortment event and in d), the black dotted lines indicate an actual or inferred reassortment in the population.
Fig. 6.
Fig. 6.
Obscured reassortments. This figure is an example of an obscured reassortment event that arises when both sampled segment trees contain reassortment events such that the first-infection tree no longer has the same structure as one of the segment trees. The full infection history a), first-infection tree b), segment trees c), and ARGs d) are shown. The vertical gray dashed line indicates the time of that reassortment event and in d), the black dotted lines indicate an actual or inferred reassortment in the population.
Fig. 7.
Fig. 7.
The frequency of the inaccuracy, reversion, and the obfuscation situations. Starting from population size I=100, the first infection rate is fixed at λ=5 and the effective removal rate is μ+ψ=5, thus the expected population stays at I=100. The total reassortment rate ρ is the sum of the rates for each segment and the joint reassortment rate: ρ=ρA+ρB+ρAB, where ρA:ρB=3:2 and ρAB=0. Samples are taken sequentially at a constant rate ψ until 50 individuals in the population are sampled.
Fig. 8.
Fig. 8.
Fraction of correctly estimating the number of visible reassortments. With a constant expected population size I=100 and rates λ=5, μ=4.75, ψ=0.25, and ρ=0.2, we simulated 100 sets of trees with 50 samples for each of the number of visible reassortments, ranging from 5 to 14. For each set, we computed the observed minimum number of reassortments and estimated the number of reassortments by the inferred MCC ARG from CoalRe and the ARG from TreeKnit, such that we computed the fraction of 100 simulated trees that estimate the number of visible reassortments correctly. Two reassortment schemes are used: in a), only segment A reassorts, ρA=0.2 and ρB=ρAB=0; in b) and c), both segments reassort but not simultaneously, ρA=0.12, ρB=0.08, and ρAB=0. Two inference schemes are used: in a) and b), only segment trees are used for inference; in c), segment trees and the simulated first-infection tree are used.

Similar articles

Cited by

References

    1. Barrat-Charlaix P, Vaughan TG, Neher RA. TreeKnit: inferring ancestral reassortment graphs of influenza viruses. PLoS Comput Biol. 2022:18(8):e1010394. 10.1371/journal.pcbi.1010394. - DOI - PMC - PubMed
    1. Batten CA, Maan S, Shaw AE, Maan NS, Mertens PPC. A European field strain of bluetongue virus derived from two parental vaccine strains by genome segment reassortment. Virus Res. 2008:137(1):56–63. 10.1016/j.virusres.2008.05.016. - DOI - PubMed
    1. Beaty BJ, Sundin DR, Chandler LJ, Bishop DHL. Evolution of bunyaviruses by genome reassortment in dually infected mosquitoes (Aedes triseriatus). Science. 1985:230(4725):548–550. 10.1126/science.4048949. - DOI - PubMed
    1. Bouckaert R, Vaughan TG, Barido-Sottani J, Duchêne S, Fourment M, Gavryushkina A, Heled J, Jones G, Kühnert D, De Maio N, et al. BEAST 2.5: an advanced software platform for Bayesian evolutionary analysis. PLoS Comput Biol. 2019:15(4):e1006650. 10.1371/journal.pcbi.1006650. - DOI - PMC - PubMed
    1. Briese T, Bird B, Kapoor V, Nichol ST, Lipkin WI. Batai and Ngari viruses: M segment reassortment and association with severe febrile disease outbreaks in East Africa. J Virol. 2006:80(11):5627–5630. 10.1128/JVI.02448-05. - DOI - PMC - PubMed