

Breast density quantification in dual-energy mammography using virtual anthropomorphic phantoms
- PMID: 38648734
- PMCID: PMC11087176
- DOI: 10.1002/acm2.14360
Breast density quantification in dual-energy mammography using virtual anthropomorphic phantoms
Abstract
Purpose: Breast density is a significant risk factor for breast cancer and can impact the sensitivity of screening mammography. Area-based breast density measurements may not provide an accurate representation of the tissue distribution, therefore volumetric breast density (VBD) measurements are preferred. Dual-energy mammography enables volumetric measurements without additional assumptions about breast shape. In this work we evaluated the performance of a dual-energy decomposition technique for determining VBD by applying it to virtual anthropomorphic phantoms.
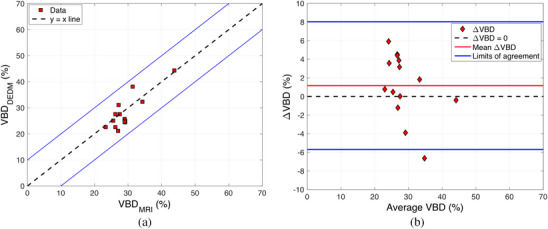
Methods: The dual-energy decomposition formalism was used to quantify VBD on simulated dual-energy images of anthropomorphic virtual phantoms with known tissue distributions. We simulated 150 phantoms with volumes ranging from 50 to 709 mL and VBD ranging from 15% to 60%. Using these results, we validated a correction for the presence of skin and assessed the method's intrinsic bias and variability. As a proof of concept, the method was applied to 14 sets of clinical dual-energy images, and the resulting breast densities were compared to magnetic resonance imaging (MRI) measurements.
Results: Virtual phantom VBD measurements exhibited a strong correlation (Pearson's ) with nominal values. The proposed skin correction eliminated the variability due to breast size and reduced the bias in VBD to a constant value of -2%. Disagreement between clinical VBD measurements using MRI and dual-energy mammography was under 10%, and the difference in the distributions was statistically non-significant. VBD measurements in both modalities had a moderate correlation (Spearman's = 0.68).
Conclusions: Our results in virtual phantoms indicate that the material decomposition method can produce accurate VBD measurements if the presence of a third material (skin) is considered. The results from our proof of concept showed agreement between MRI and dual-energy mammography VBD. Assessment of VBD using dual-energy images could provide complementary information in dual-energy mammography and tomosynthesis examinations.
Keywords: clinical images; dual‐energy decomposition; dual‐energy mammography; magnetic resonance imaging; virtual phantoms; volumetric breast density.
© 2024 The Authors. Journal of Applied Clinical Medical Physics is published by Wiley Periodicals, Inc. on behalf of The American Association of Physicists in Medicine.
Conflict of interest statement
The authors have no relevant conflicts of interest to disclose.
Figures


Similar articles
-
Automatic Estimation of Volumetric Breast Density Using Artificial Neural Network-Based Calibration of Full-Field Digital Mammography: Feasibility on Japanese Women With and Without Breast Cancer.J Digit Imaging. 2017 Apr;30(2):215-227. doi: 10.1007/s10278-016-9922-9. J Digit Imaging. 2017. PMID: 27832519 Free PMC article.
-
Comparison between software volumetric breast density estimates in breast tomosynthesis and digital mammography images in a large public screening cohort.Eur Radiol. 2019 Jan;29(1):330-336. doi: 10.1007/s00330-018-5582-0. Epub 2018 Jun 25. Eur Radiol. 2019. PMID: 29943180 Free PMC article.
-
Fully Automated Quantitative Estimation of Volumetric Breast Density from Digital Breast Tomosynthesis Images: Preliminary Results and Comparison with Digital Mammography and MR Imaging.Radiology. 2016 Apr;279(1):65-74. doi: 10.1148/radiol.2015150277. Epub 2015 Oct 21. Radiology. 2016. PMID: 26491909 Free PMC article.
-
Contrast-enhanced dual-energy mammography: a promising new imaging tool in breast cancer detection.Womens Health (Lond). 2014 May;10(3):289-98. doi: 10.2217/whe.14.18. Womens Health (Lond). 2014. PMID: 24956295 Review.
-
Advances in digital and physical anthropomorphic breast phantoms for x-ray imaging.Med Phys. 2018 Oct;45(10):e870-e885. doi: 10.1002/mp.13110. Epub 2018 Aug 28. Med Phys. 2018. PMID: 30058117 Review.
References
-
- Hartman K, Highnam R, Warren R, Jackson V. Volumetric assessment of breast tissue composition from FFDM images. In: Krupinski EA, ed. Digital Mammography. Springer; 2008:33‐39. doi:10.1007/978-3-540-70538-3_5 - DOI
-
- Highnam R, Brady SM, Yaffe MJ, Karssemeijer N, Harvey J. Robust breast composition measurement—VolparaTM. In: Martí J, Oliver A, Freixenet J, Martí R, eds. Digital Mammography. Springer; 2010:342‐349. doi:10.1007/978-3-642-13666-5_46 - DOI
MeSH terms
Grants and funding
LinkOut - more resources
Full Text Sources
Medical
Research Materials
